Exercise 25-26 (20 minutes)
ALTERNATIVE A: INCREASE OR (DECREASE) IN NET INCOME
Cost to buy new machine………………………………………………………………..$(115,000)
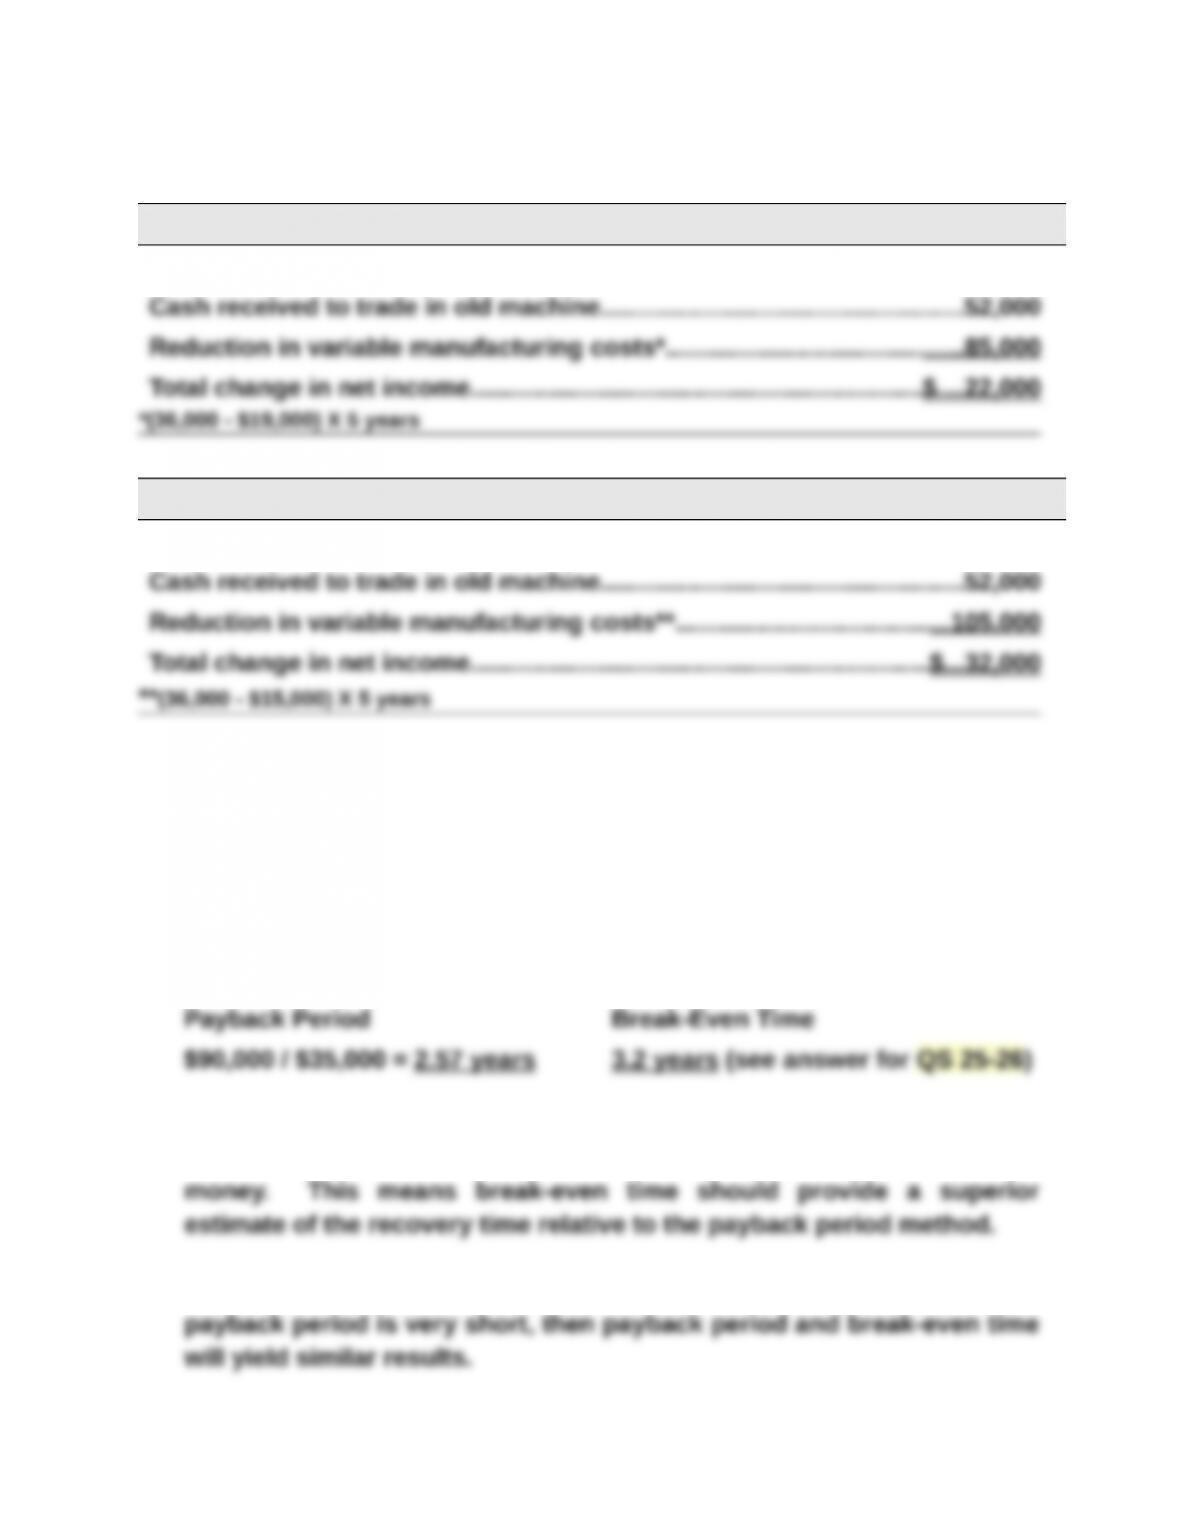
ALTERNATIVE B: INCREASE OR (DECREASE) IN NET INCOME
Cost to buy new machine………………………………………………………………..$(125,000)
The company should replace the machine with alternative machine B. This
will increase net income by $32,000.
Exercise 25-27 (15 minutes)
1. Recovery time computation
2. The advantage of break-even time is that it considers the time value of
3. When (1) the interest rate is very low, 1% for example, and (2) the

PROBLEM SET A
Problem 25-1A (50 minutes)
Part 1
Annual straight-line depreciation = = $115,000
Part 2
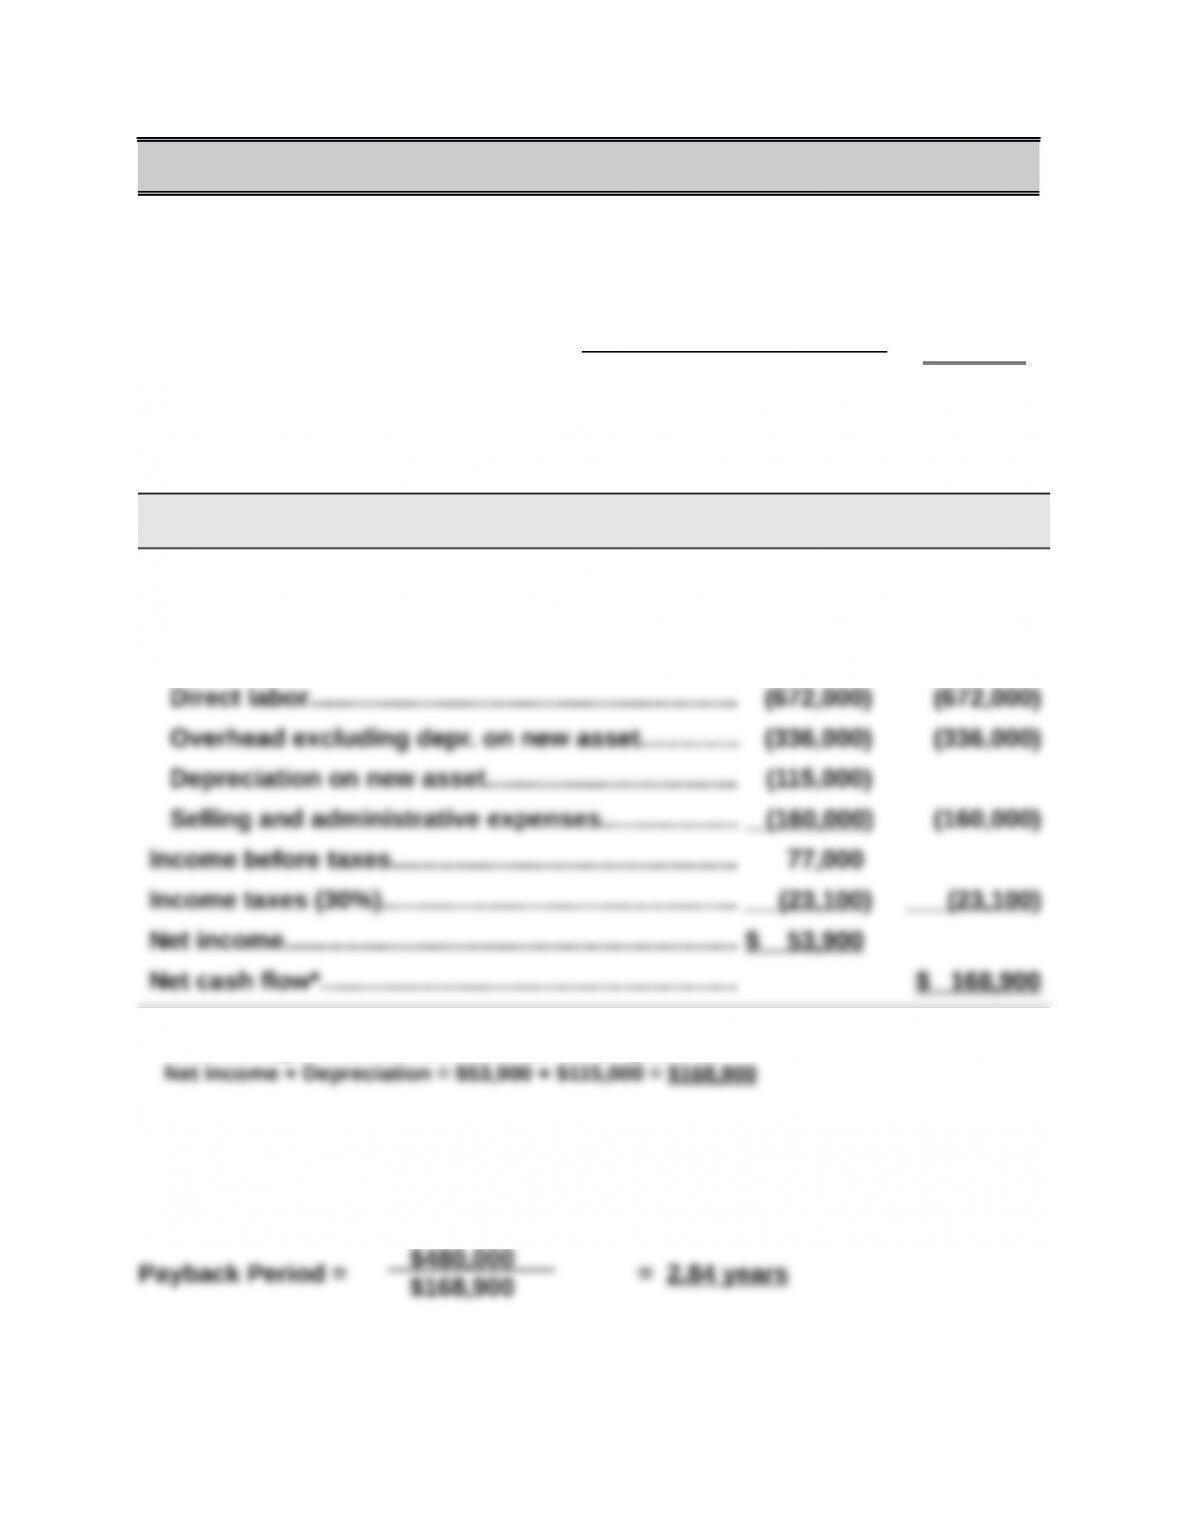
Net Net Cash
Income Flow
Expected annual sales of new product………………$1,840,000 $1,840,000
Expected costs of new product
Direct materials…………………………………………….. (480,000) (480,000)
* Alternatively, annual net cash flow can be computed as
Part 3
$480,000 – $20,000
4 years
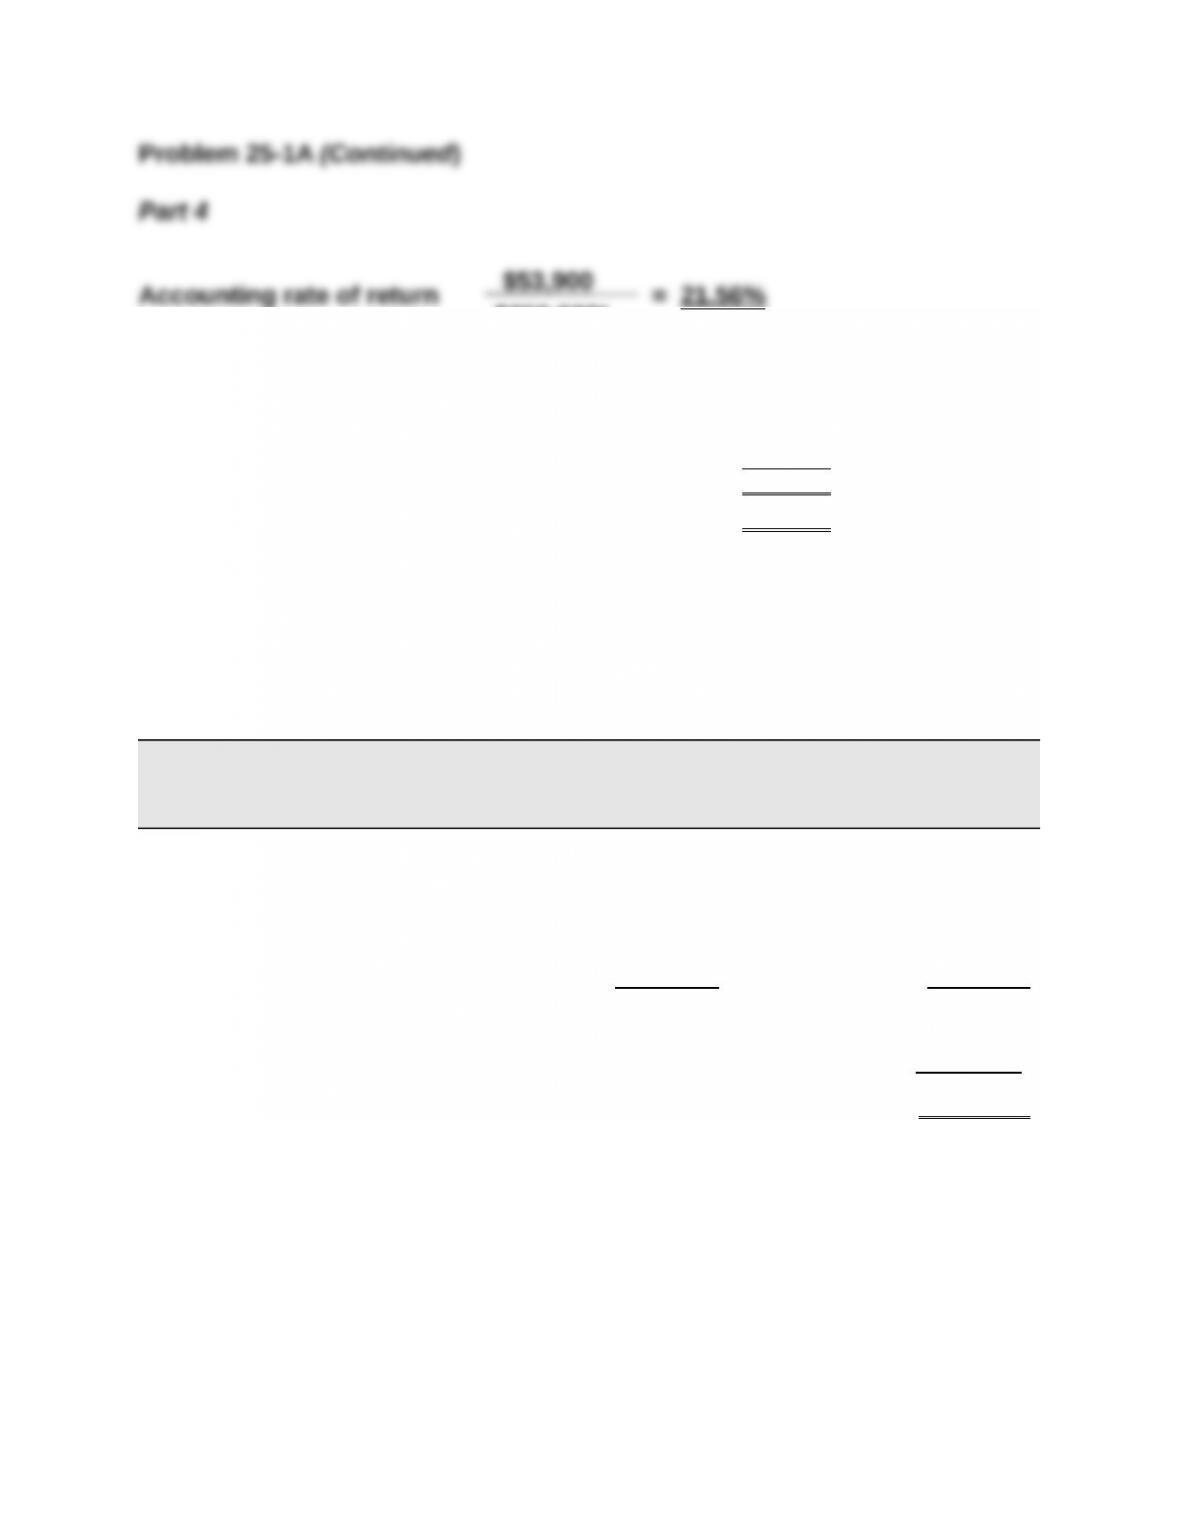
Problem 25-1A (Continued)
Part 4
Accounting rate of return = = 21.56%
* Average investment
Asset cost…………………………………………………………………………..$480,000
Final year’s book value………………………………………………………. 20,000
Sum……………………………………………………………………………………$500,000
Average (Sum /2)………………………………………………………………..$250,000
Part 5
Present Value of Net Cash Flows
Present Present
Net Cash Value of Value of Net
Flows 1 at 7% Cash Flows
Year 1…………………………………………………$168,900 0.9346 $ 157,854
Year 2…………………………………………………168,900 0.8734 147,517
Year 3…………………………………………………168,900 0.8163 137,873
Year 4*……………………………………………….. 188,900 0.7629 144,112
Totals…………………………………………………$695,600 587,356
Amount invested………………………………… (480,000)
Net present value……………………………….. $ 107,356
* Year 4’s cash flow includes the $20,000 salvage value.
$250,000*
Problem 25-2A (55 minutes)
Part 1
PROJECT Y
Net income…………………………………………………………………………… $ 56,000
PROJECT Z
Net income…………………………………………………………………………… $ 36,400
Part 2
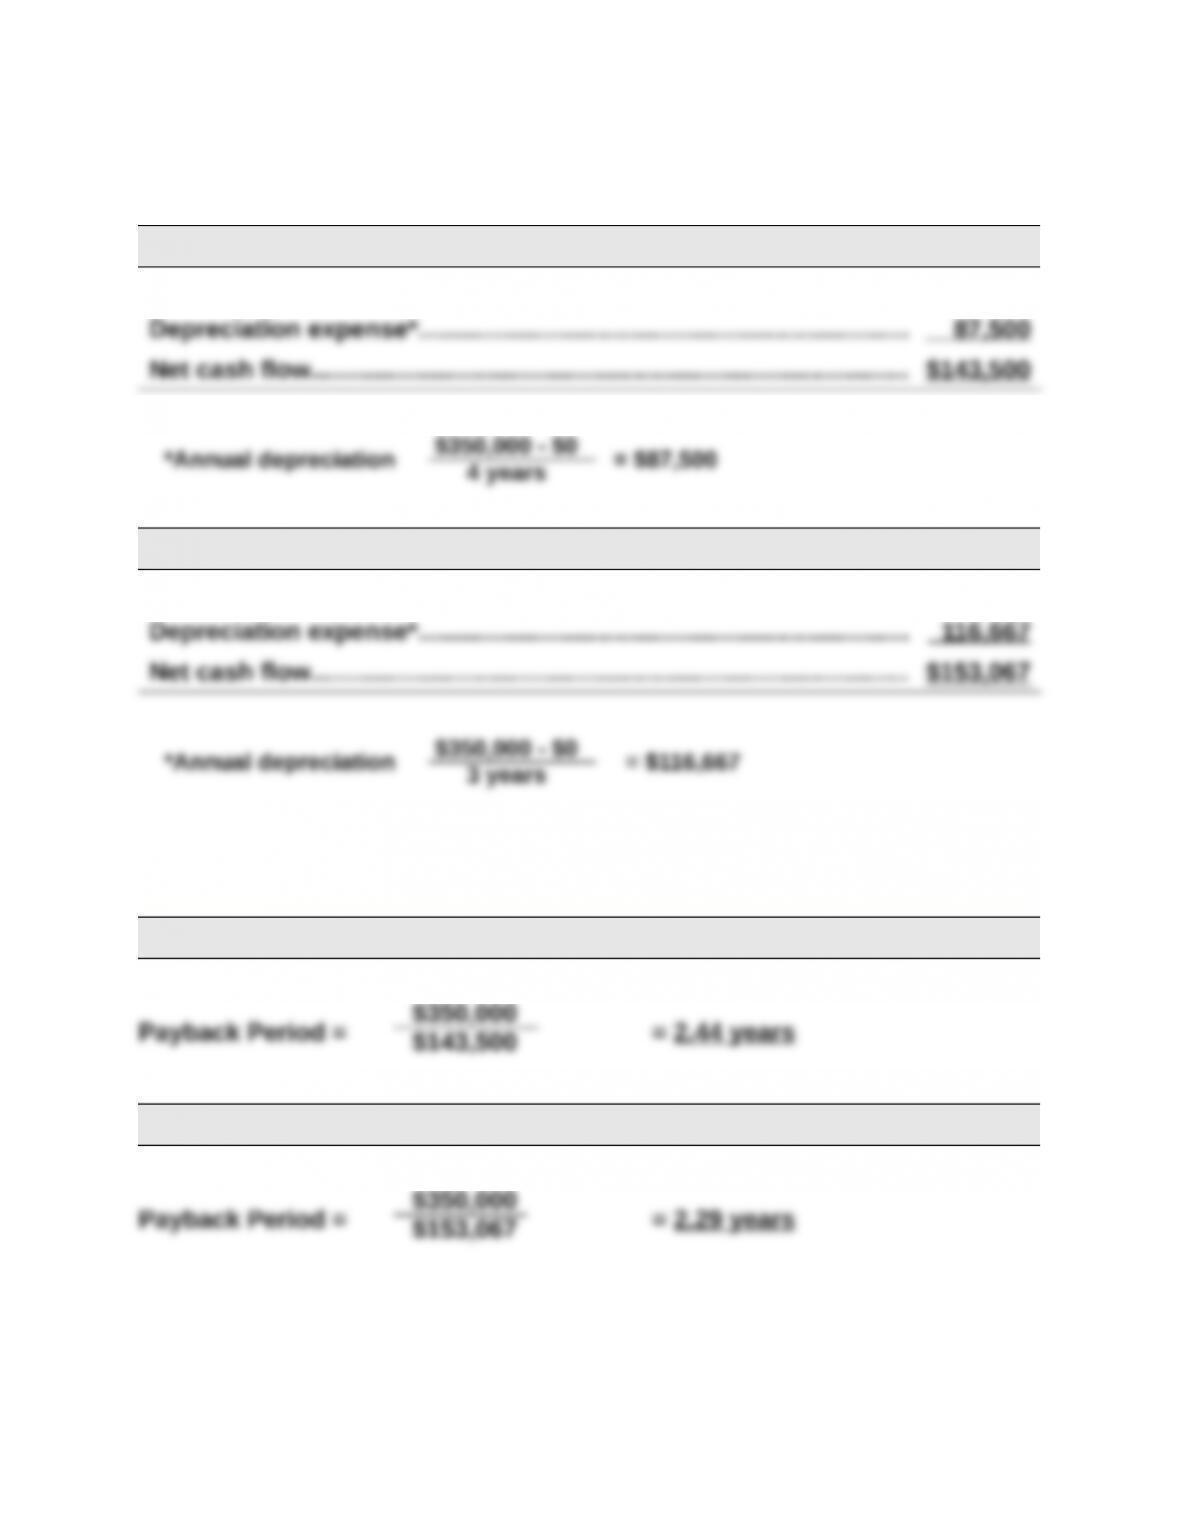
PROJECT Y
PROJECT Z
4 years
3 years
$350,000
$143,500
$350,000
Problem 25-2A (Continued)
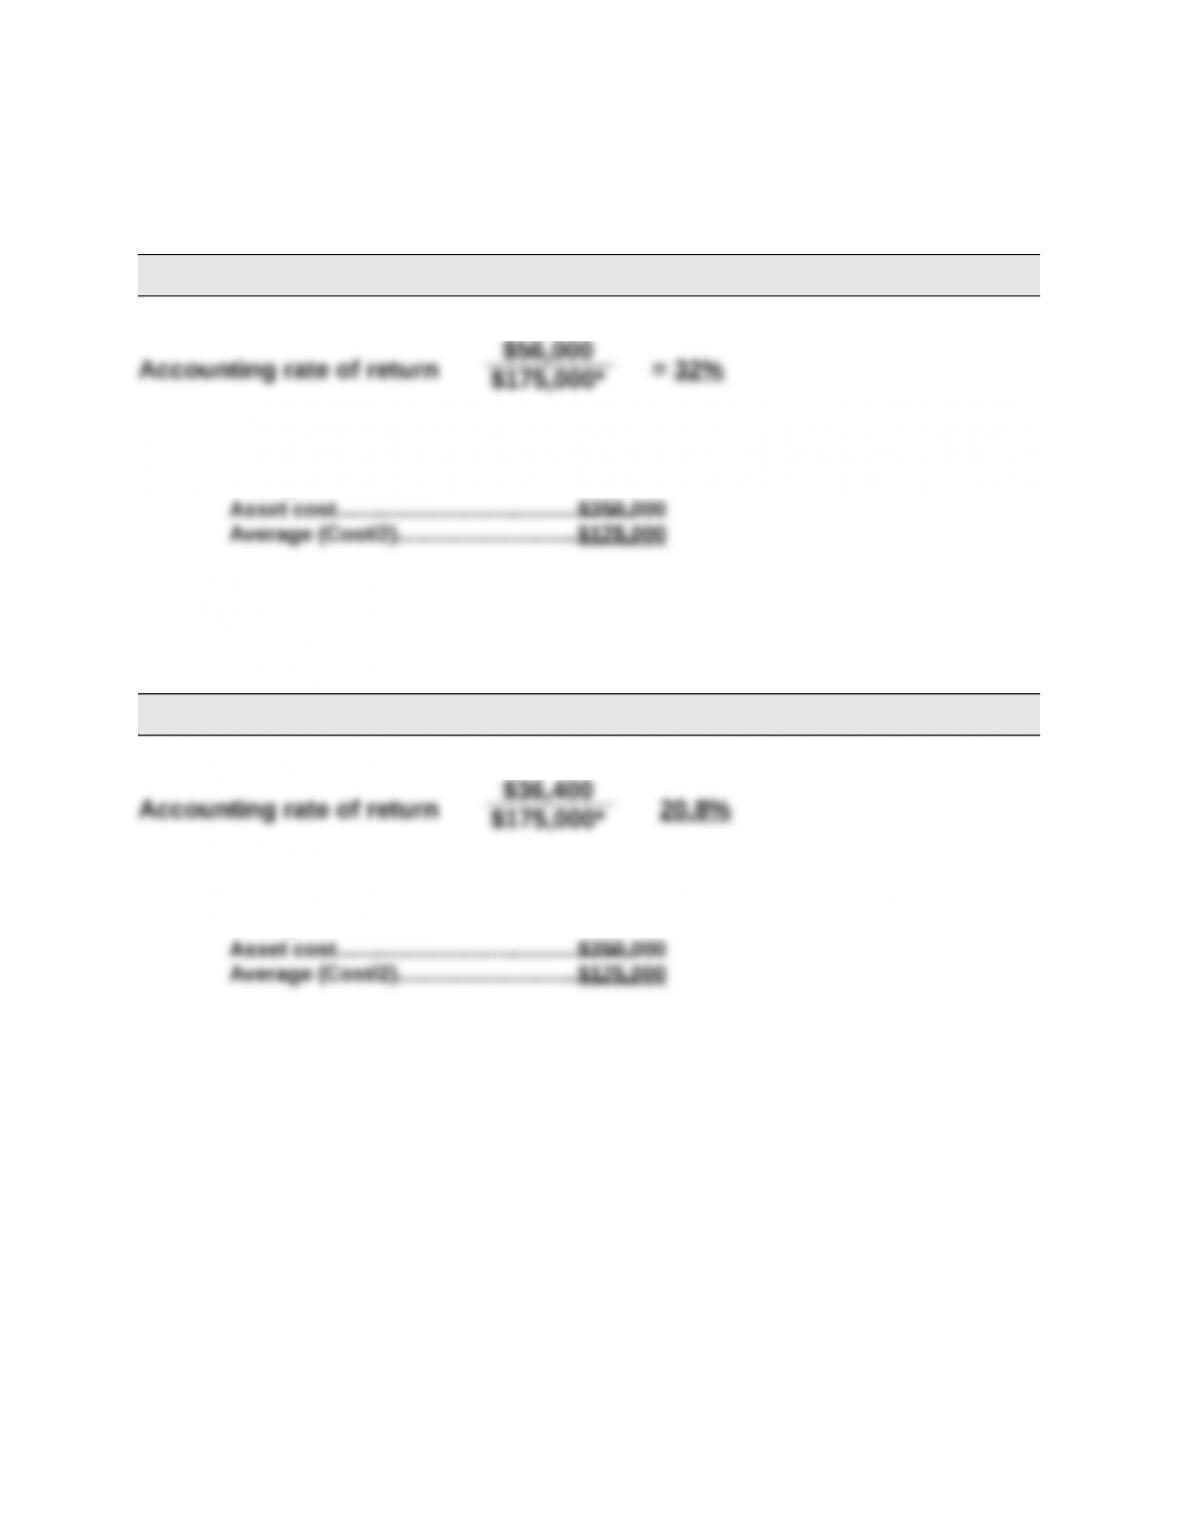
Part 3
PROJECT Y
*Average investment
PROJECT Z
*Average investment
Asset cost……………………………………………$350,000
Average (Cost/2)…………………………………..$175,000
$56,000
$175,000*
$36,400
$175,000*
Problem 25-2A (Continued)
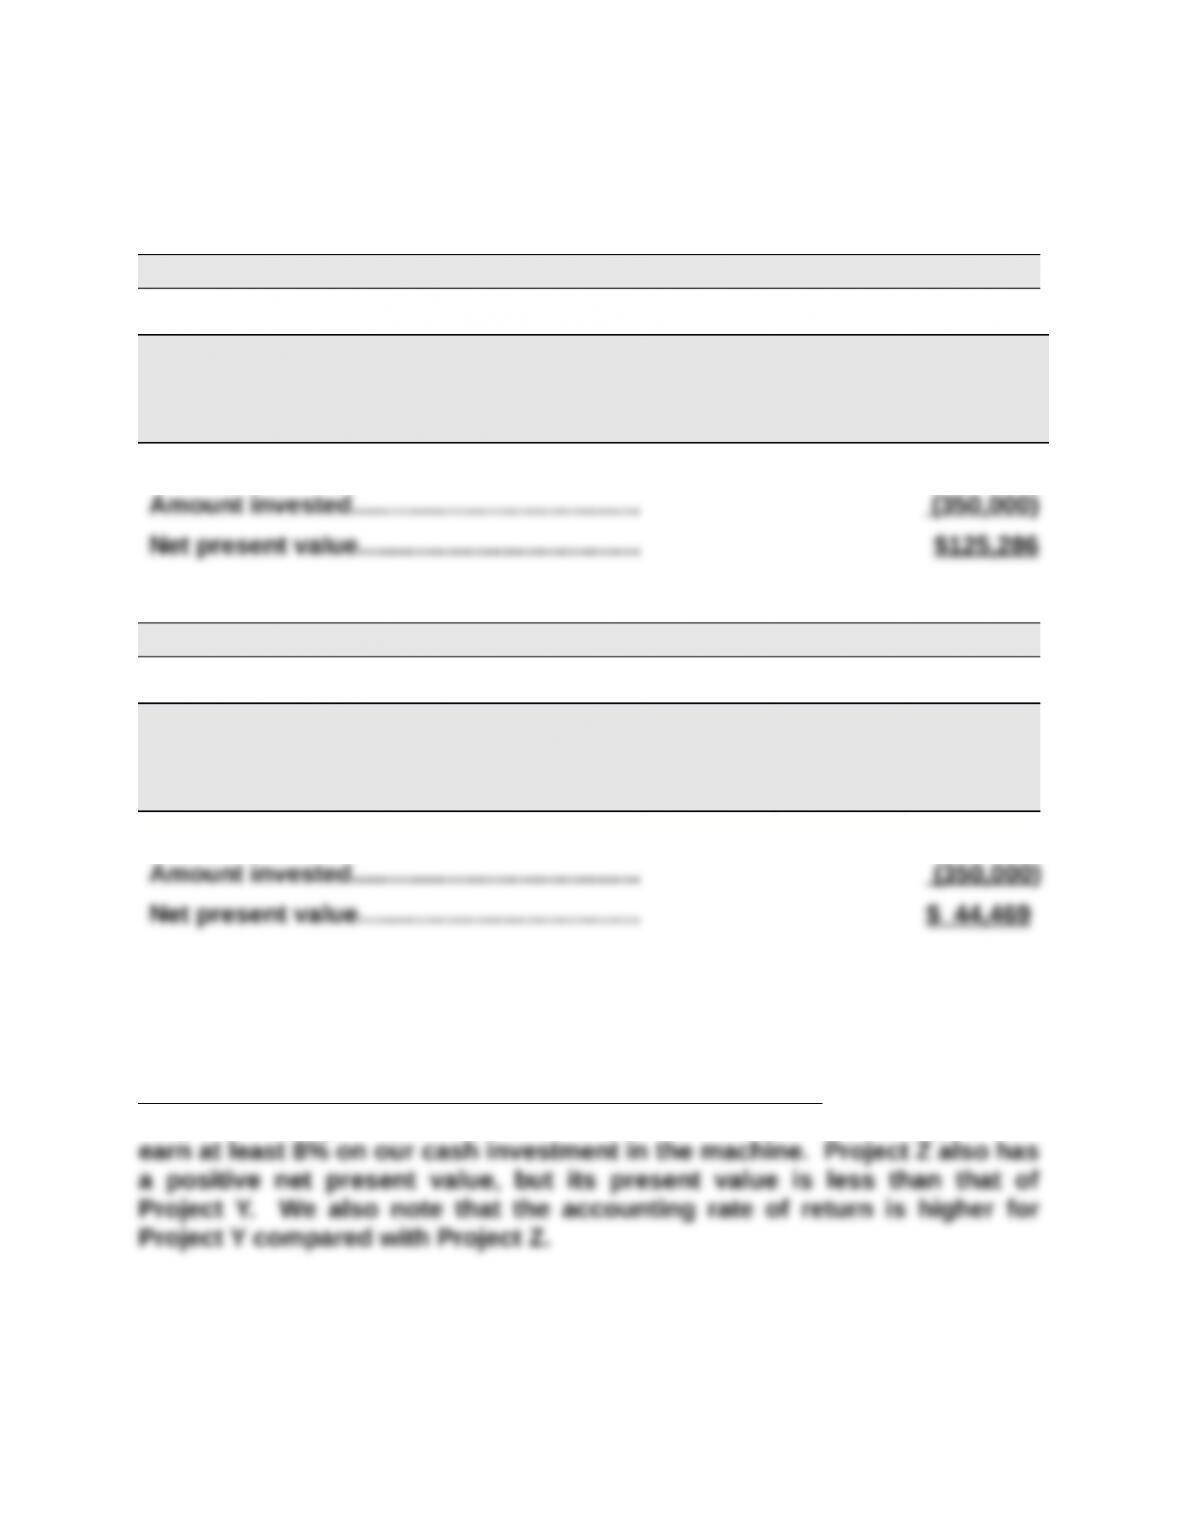
Part 4
PROJECT Y
Present Value of Net Cash Flows
Present Present
Value of Value of
Net Cash
Flows
1 at 8%
Annuity
Net Cash
Flows
Years 1-4…………………………………………….. $143,500 3.3121 $475,286
PROJECT Z
Present Value of Net Cash Flows
Present Present
Value of Value of
Net Cash
Flows
1 at 8%
Annuity
Net Cash
Flows
Years 1-3…………………………………………….. $153,067 2.5771 $394,469
Part 5
Recommendation to management is to pursue Project Y. This is because
Project Y has a positive net present value, which means that we expect it to
Problem 25-3A (60 minutes)
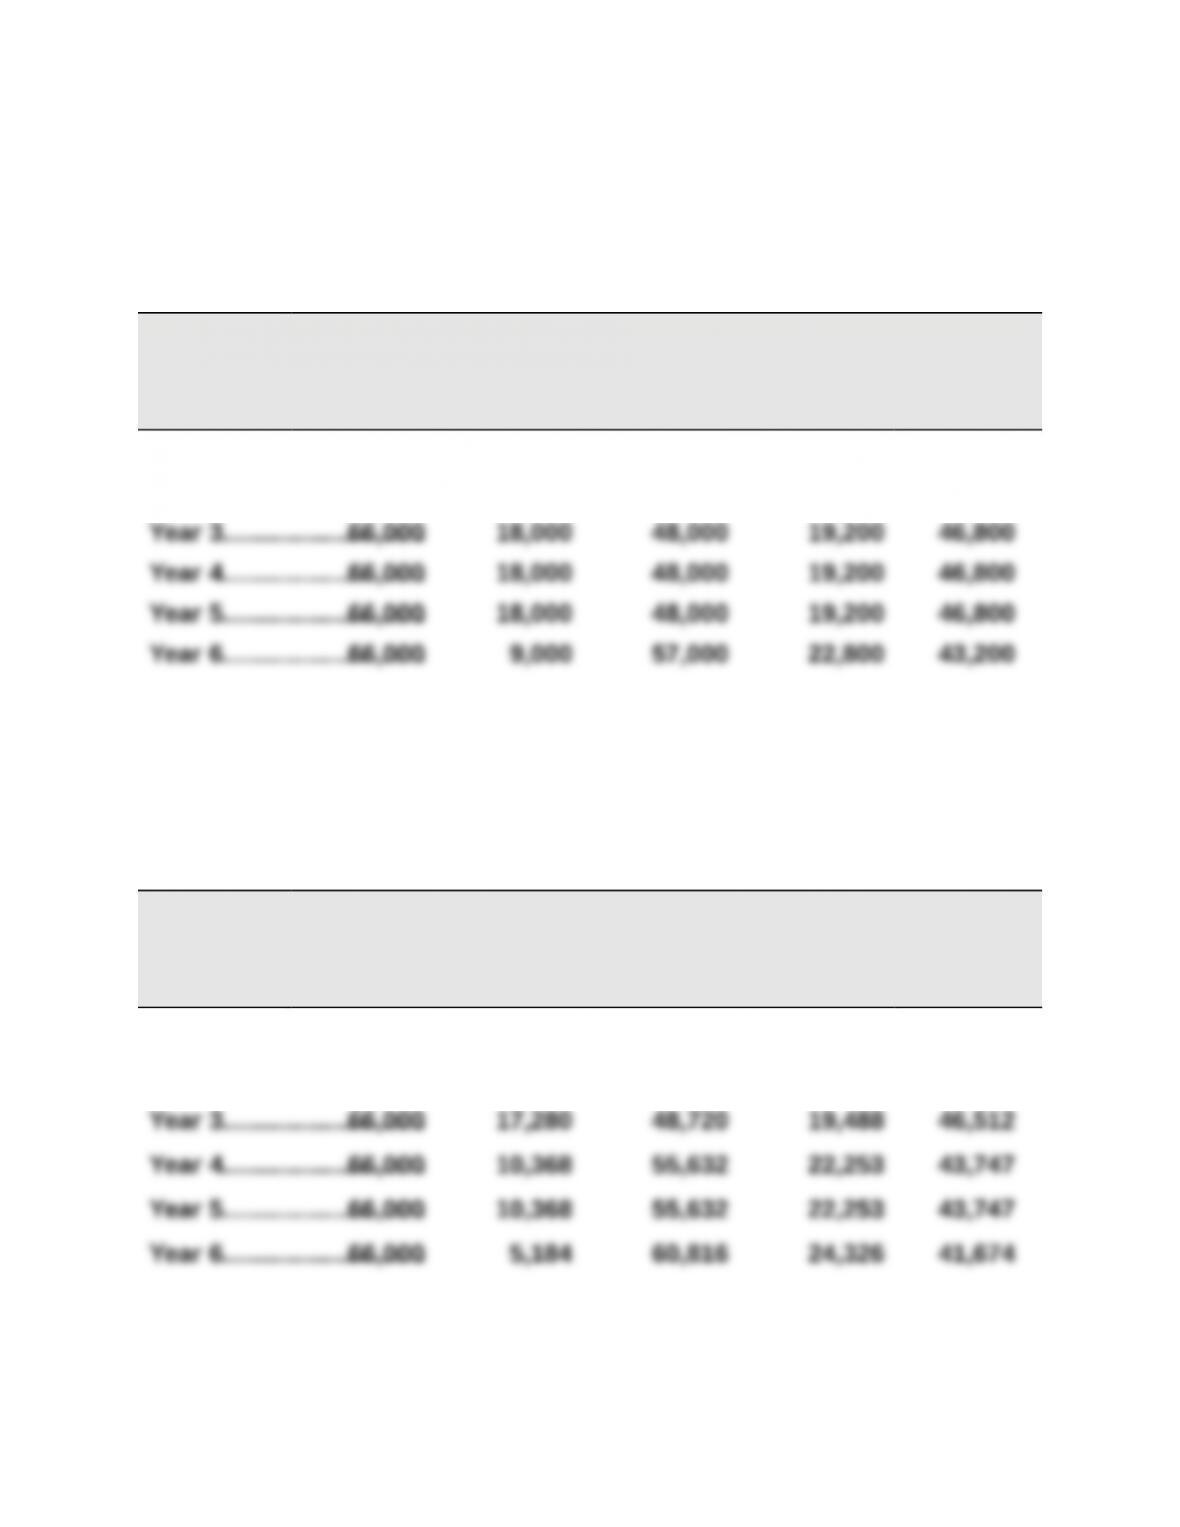
Part 1
RESULTS USING STRAIGHT-LINE DEPRECIATION
(a)
Income
Before
Deprec.
(b)
Straight-Li
ne Deprec.
(c)
Taxable
Income
(a) – (b)
(d)
40%
Income
Taxes
(e)
Net Cash
Flows
(a) – (d)
Year 1……………………….$66,000 $ 9,000 $57,000 $22,800 $43,200
Year 2……………………….66,000 18,000 48,000 19,200 46,800
Part 2
RESULTS USING MACRS DEPRECIATION
(a)
Income
Before
Deprec.
(b)
MACRS
Deprec.
(c)
Taxable
Income
(a) – (b)
(d)
40%
Income
Taxes
(e)
Net Cash
Flows
(a) – (d)
Year 1……………………….$66,000 $18,000 $48,000 $19,200 $46,800
Year 2……………………….66,000 28,800 37,200 14,880 51,120
Problem 25-3A (Continued)
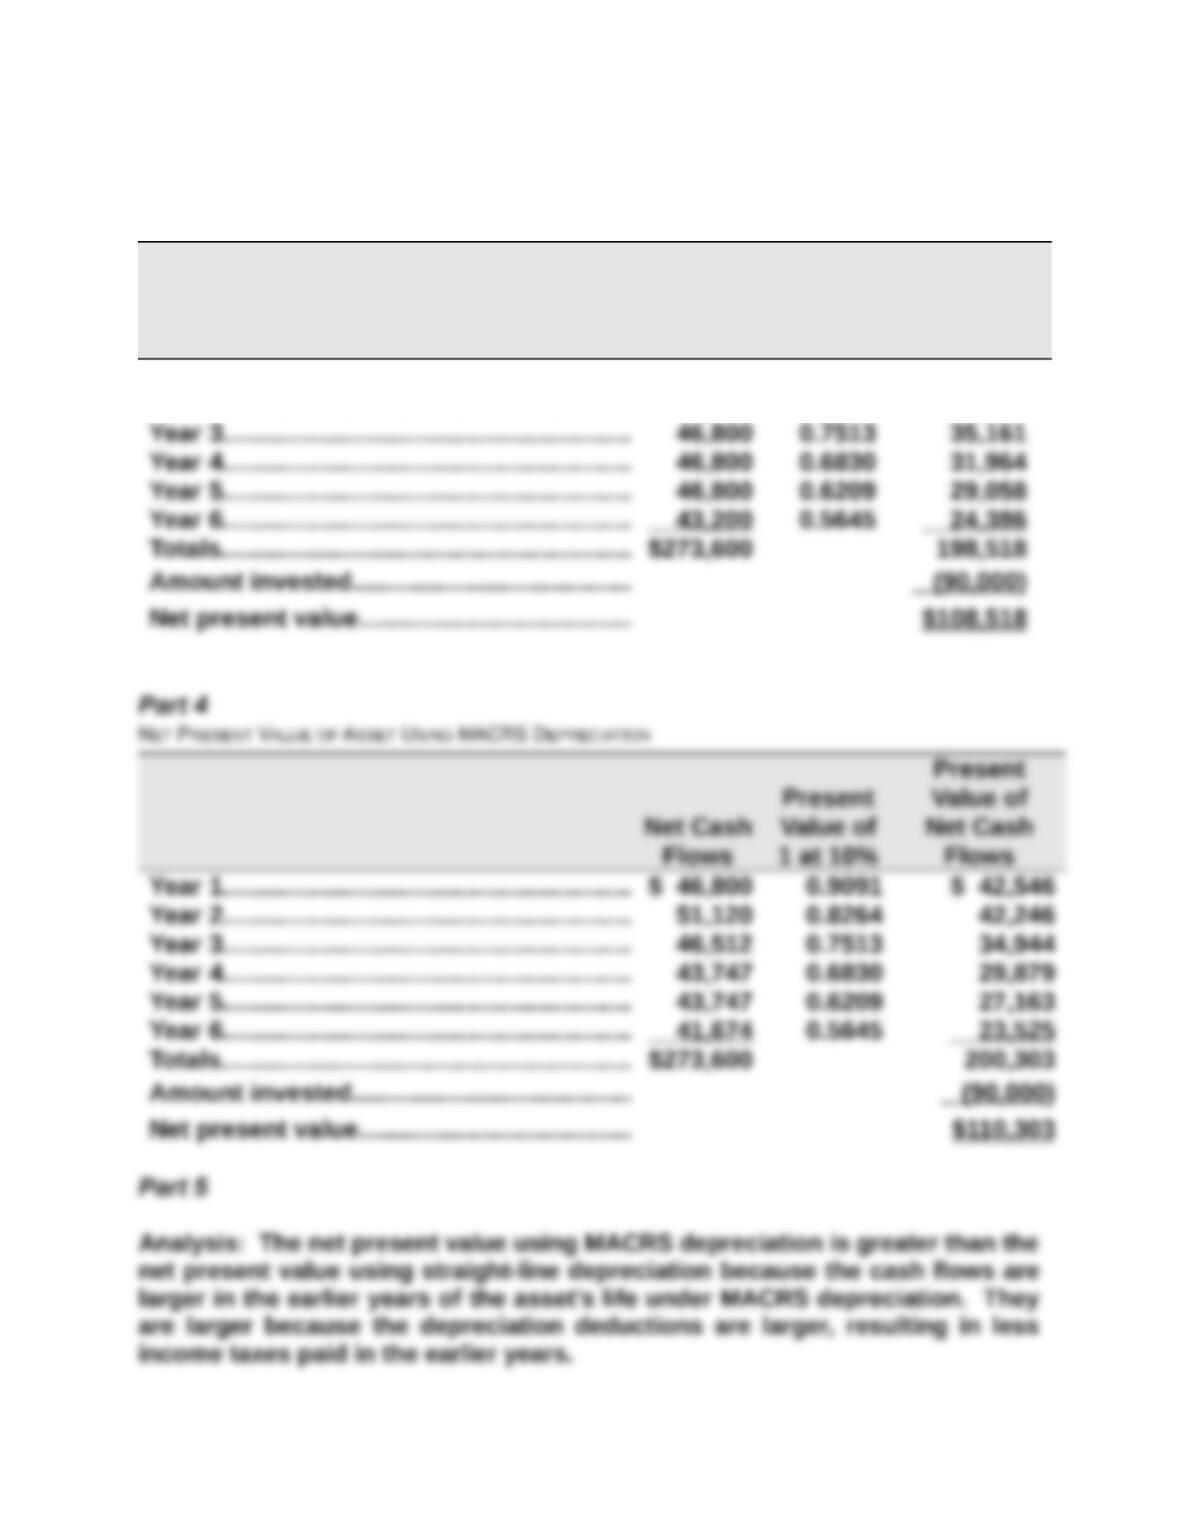
Part 3
NET PRESENT VALUE OF ASSET USING STRAIGHT-LINE DEPRECIATION
Present
Present Value of
Net Cash
Flows
Value of
1 at 10%
Net Cash
Flows
Year 1………………………………………………… $ 43,200 0.9091 $ 39,273
Year 2………………………………………………… 46,800 0.8264 38,676
Problem 25-4A (45 minutes)
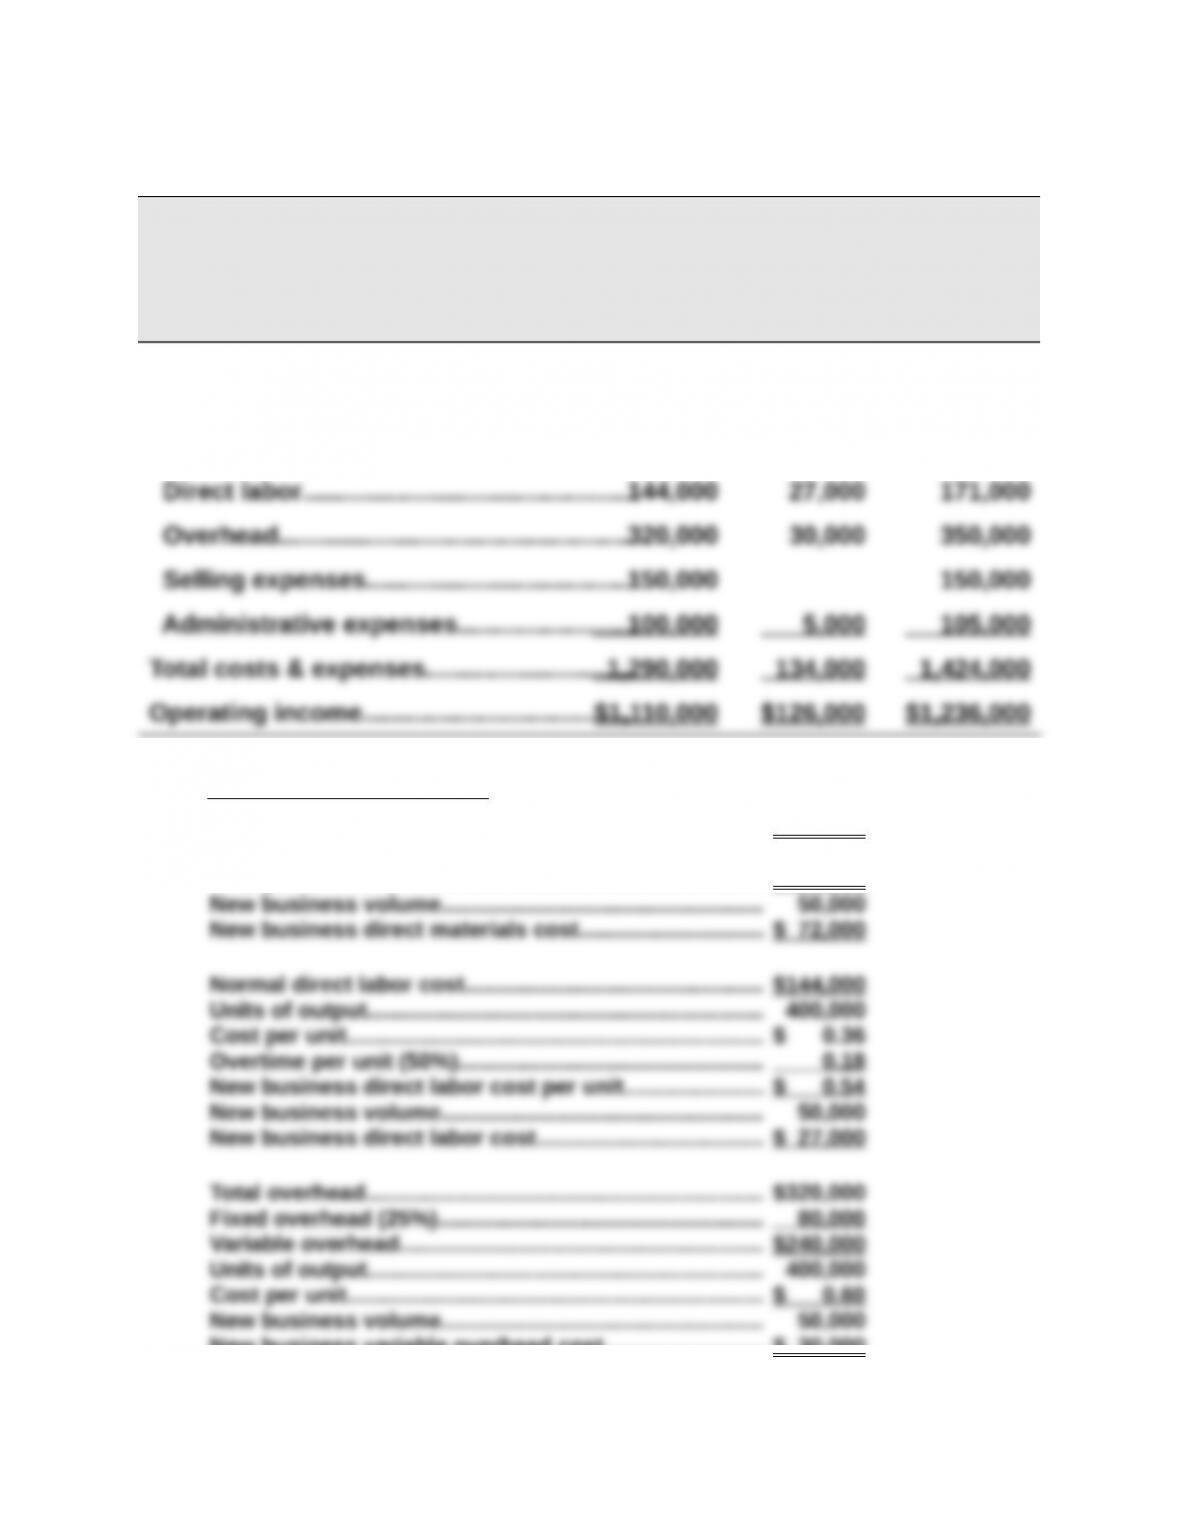
JONES PRODUCTS
COMPARATIVE INCOME STATEMENTS
(1) (2) (3)
Normal New
Volume Business Combined
Sales………………………………………………….$2,400,000 $260,000 $2,660,000
Costs and expenses
Direct materials…………………………………576,000 72,000 648,000
Supporting computations
Normal direct materials cost………………………………….. $576,000
Units of output………………………………………………………. 400,000
Cost per unit…………………………………………………………. $ 1.44
New business variable overhead cost…………………….. $ 30,000
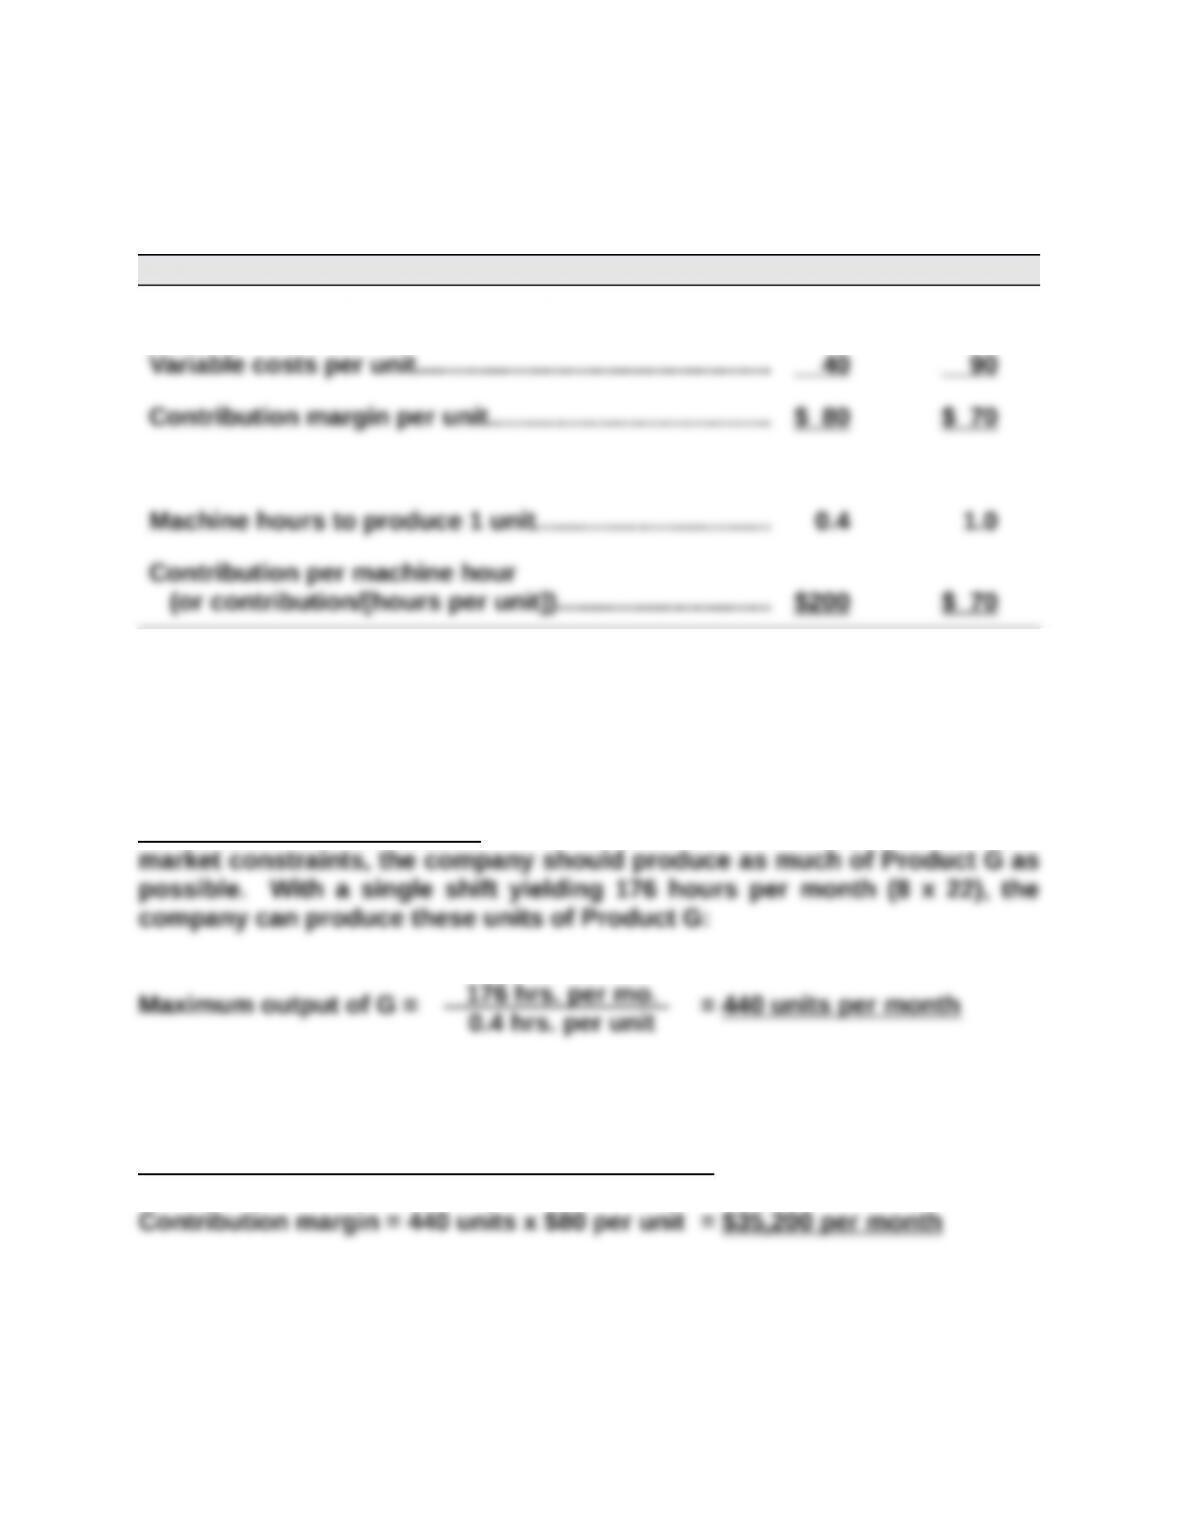
Problem 25-5A (55 minutes)
Part 1
Product G Product B
Selling price per unit……………………………………………. $120 $160
Part 2
Sales Mix Recommendation. To the extent allowed by production and
Contribution Margin at Recommended Sales Mix
Contribution margin = 440 units x $80 per unit = $35,200 per month
0.4 hrs. per unit