Chapter 24 – Performance Measurement and Responsibility Accounting
Problem 24-5AB (60 minutes)
Part 1
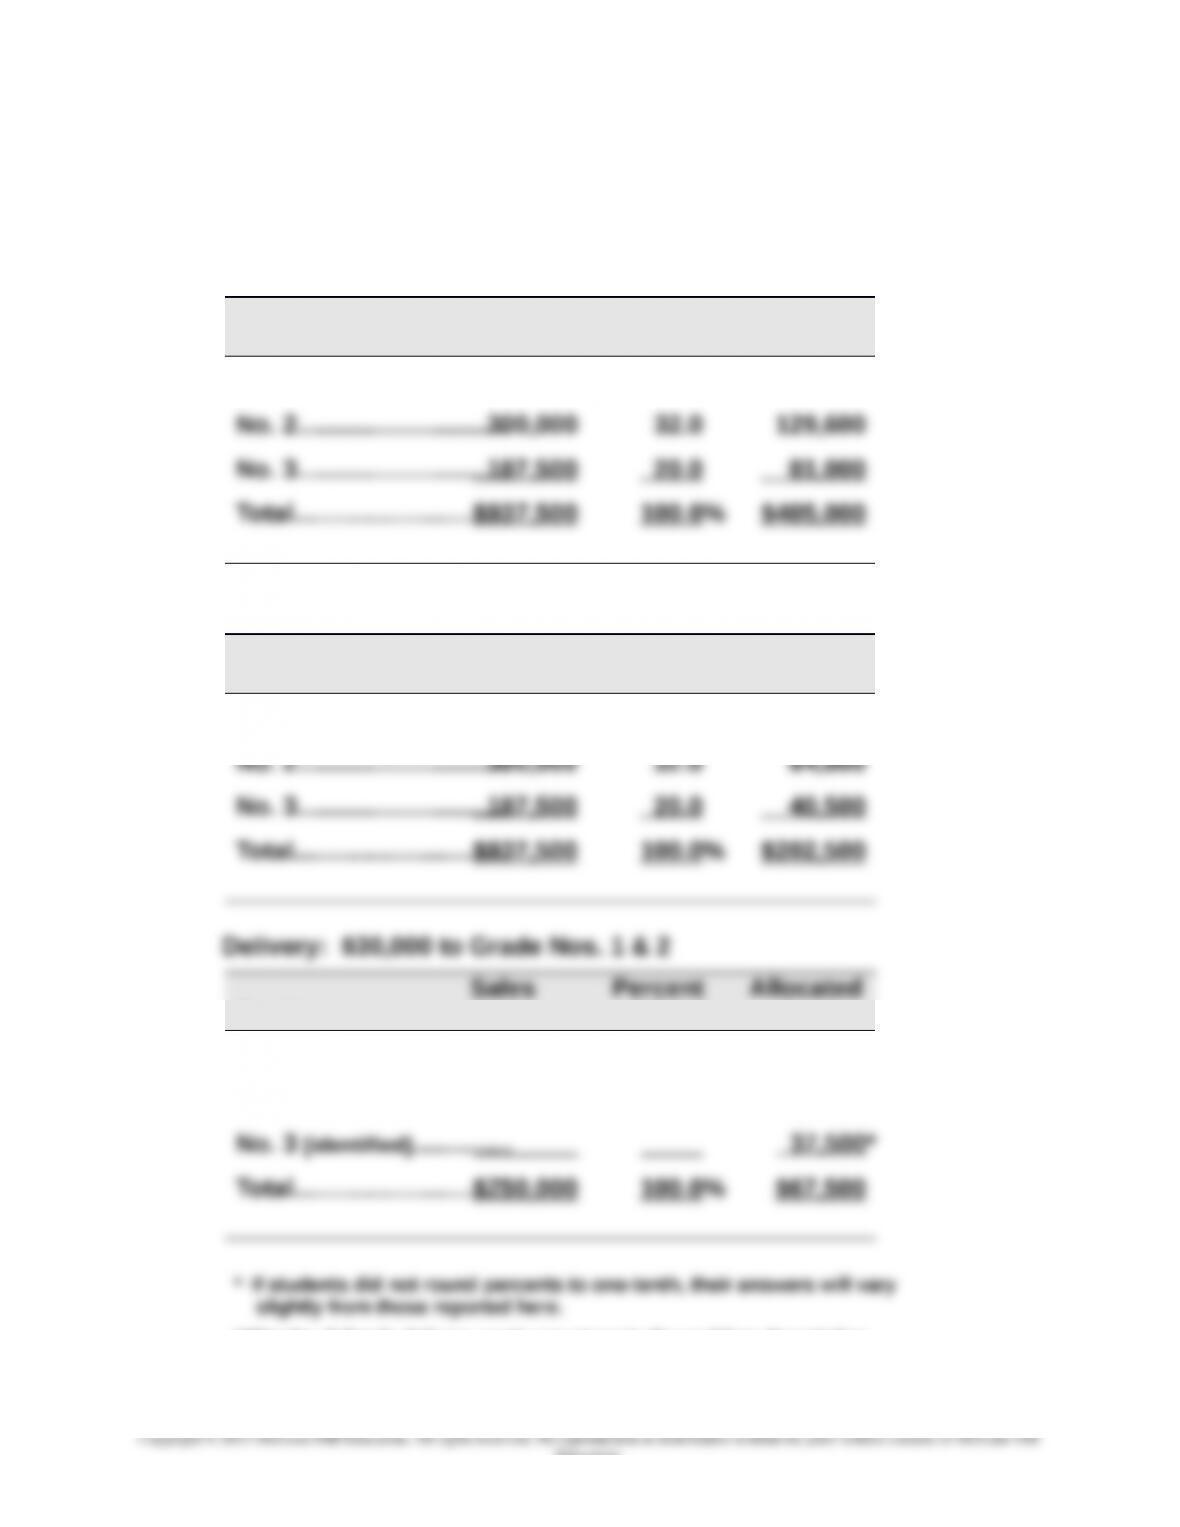
Allocations of joint costs on the basis of sales values
Tree pruning and care: $405,000
Grade
Sales
Value
Percent
of Total
Allocated
Cost
No. 1……………………….…$450,000 48.0% $194,400
Picking, sorting, and grading: $202,500
Grade
Sales
Value
Percent
of Total
Allocated
Cost
No. 1……………………….…$450,000 48.0% $ 97,200
Grade
Value
of Total
Cost
No. 1……………………….…$450,000 60.0% $18,000
No. 2……………………….…300,000 40.0 12,000
**The No. 3 Grade delivery costs are given in the problem description.
Problem 24-5AB (Continued)
24-1425
Education.
Chapter 24 – Performance Measurement and Responsibility Accounting
Part 2
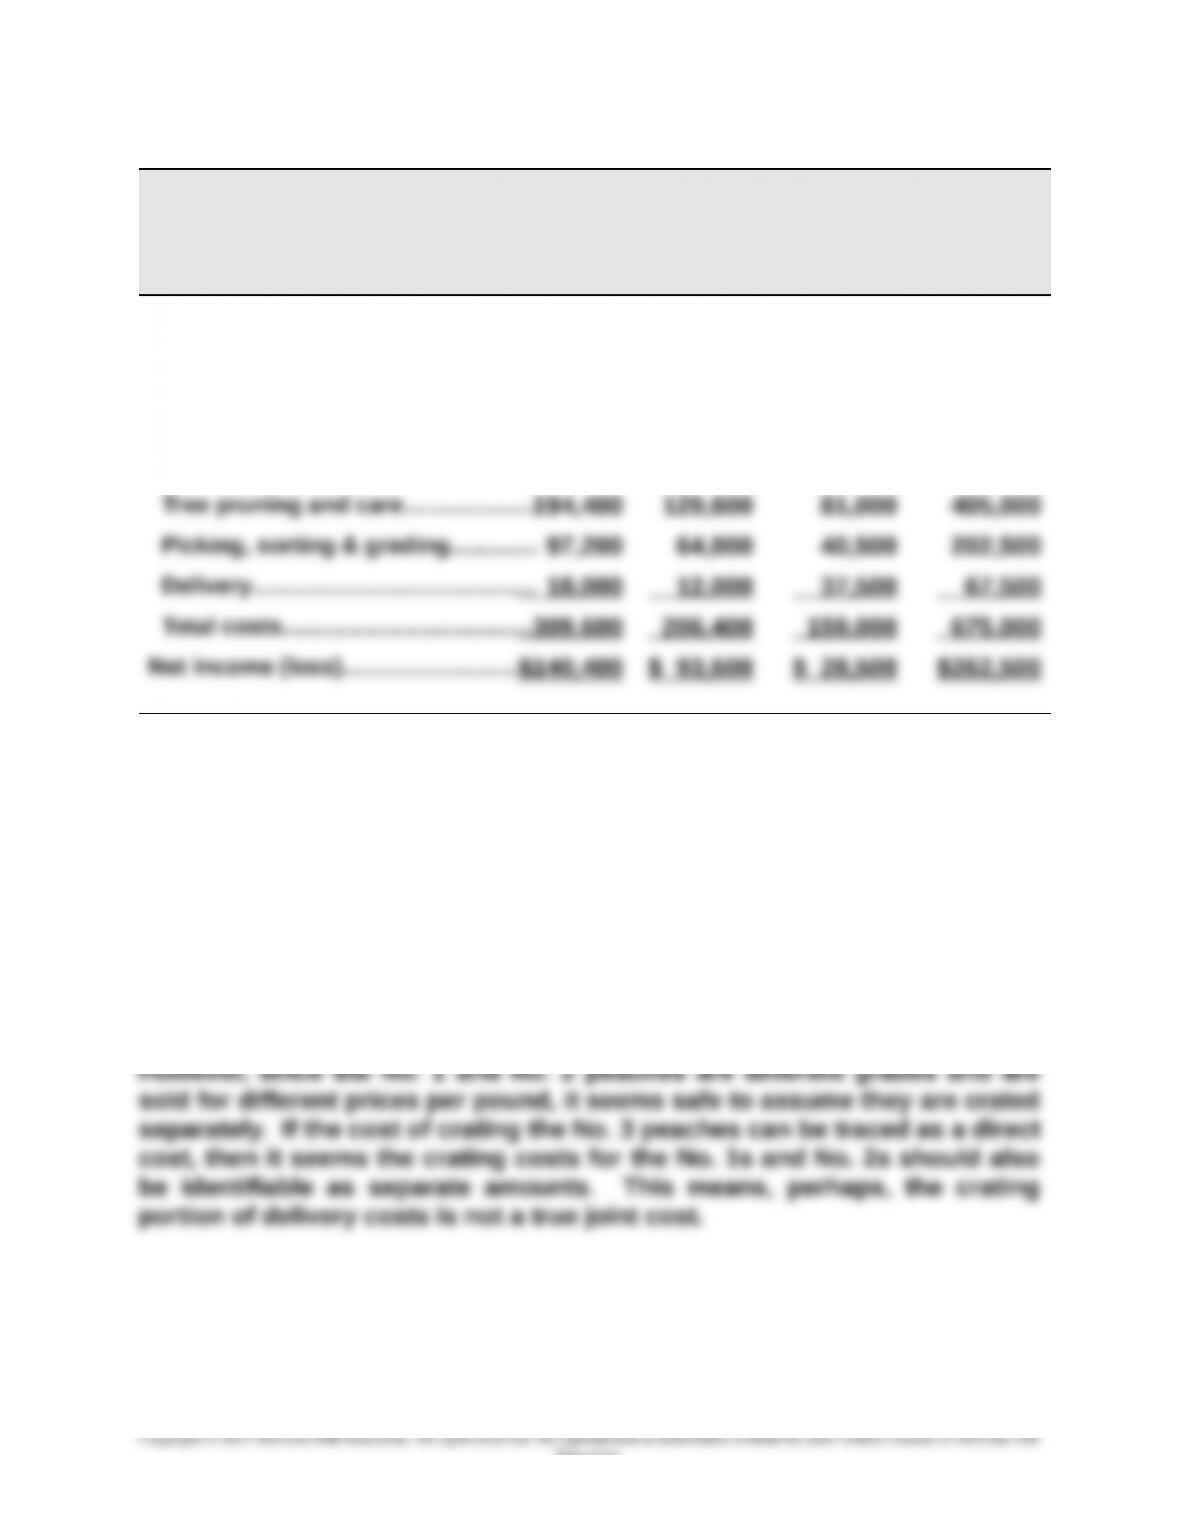
GEORGIA ORCHARDS
Income Statement
For Year Ended December 31, 2015
No. 1 No. 2 No. 3 Combined
Sales (by grade)
No. 1: 300,000 lbs. @ $1.50............
$450,000
No. 2: 300,000 lbs. @ $1.00............ $300,000
No. 3: 750,000 lbs. @ $0.25............ $187,500
Total sales….…………………….….….… $937,500
Costs
Part 3
Delivery costs include both crating and hauling costs. Georgia is able to
identify the portion of the cost directly related to the No. 3 peaches,
presumably because the No. 3s are going to a different destination than the
No. 1 and No. 2 peaches. If the No. 1s and No. 2s are going to the same
place, then the hauling portion of the delivery cost may truly be a joint cost,
at least for the No. 1 and No. 2 peaches.
24-1426
Education.
Chapter 24 – Performance Measurement and Responsibility Accounting
PROBLEM SET B
Problem 24-1B (50 minutes)
Part 1
a.
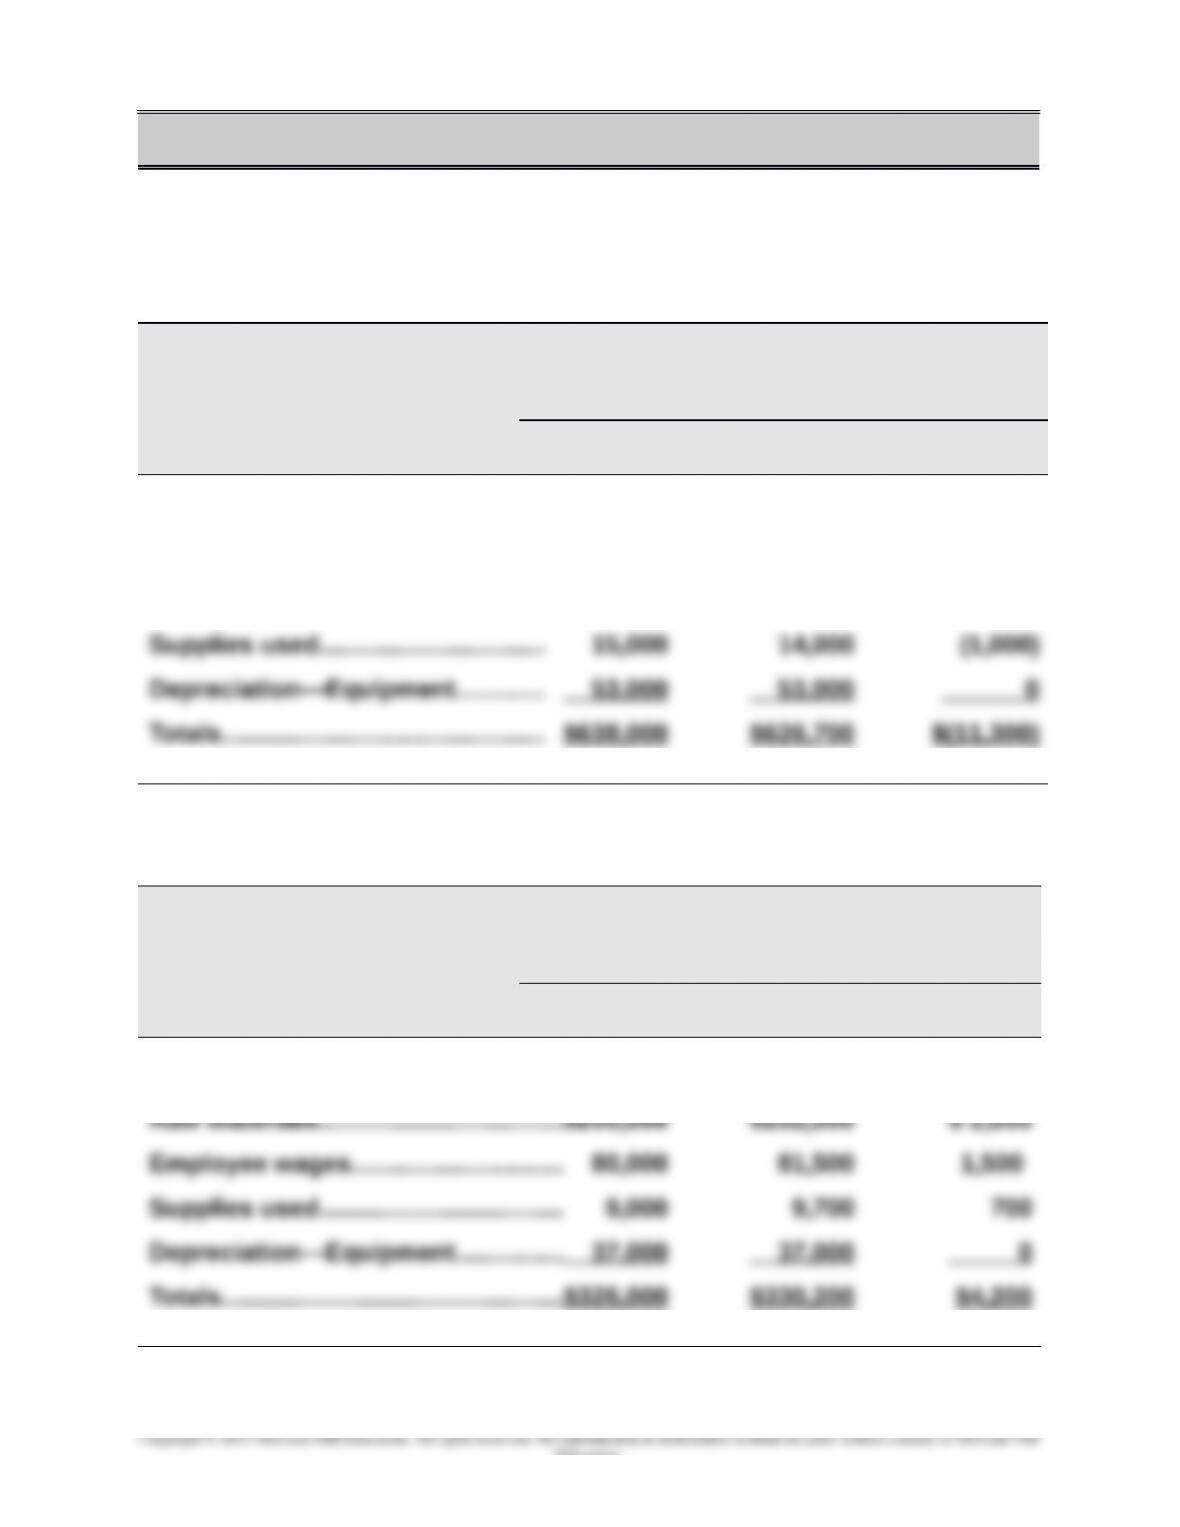
Responsibility Accounting Performance Report
Dept. Manager, Refrigerator Department
For the Month of April
Budgeted Actual Over (Under)
Amount Amount Budget
Controllable Costs
Raw materials….………..…………..... $400,000 $385,000 $(15,000)
Employee wages…………………….… 170,000 174,700 4,700
b.
Responsibility Accounting Performance Report
Dept. Manager, Dishwasher Department
For the Month of April
Budgeted Actual Over (Under)
Amount Amount Budget
Controllable Costs
24-1427
Education.
Chapter 24 – Performance Measurement and Responsibility Accounting
Problem 24-1B (Continued)
c.
Controllable Costs
Dept. manager salaries…....... $ 104,000 $ 101,500 $ (2,500)
Utilities……………………………… 48,000 55,200 7,200
Building rent….……..…………... 80,000 82,300 2,300
Other office salaries…….…….. 40,000 35,200 (4,800)
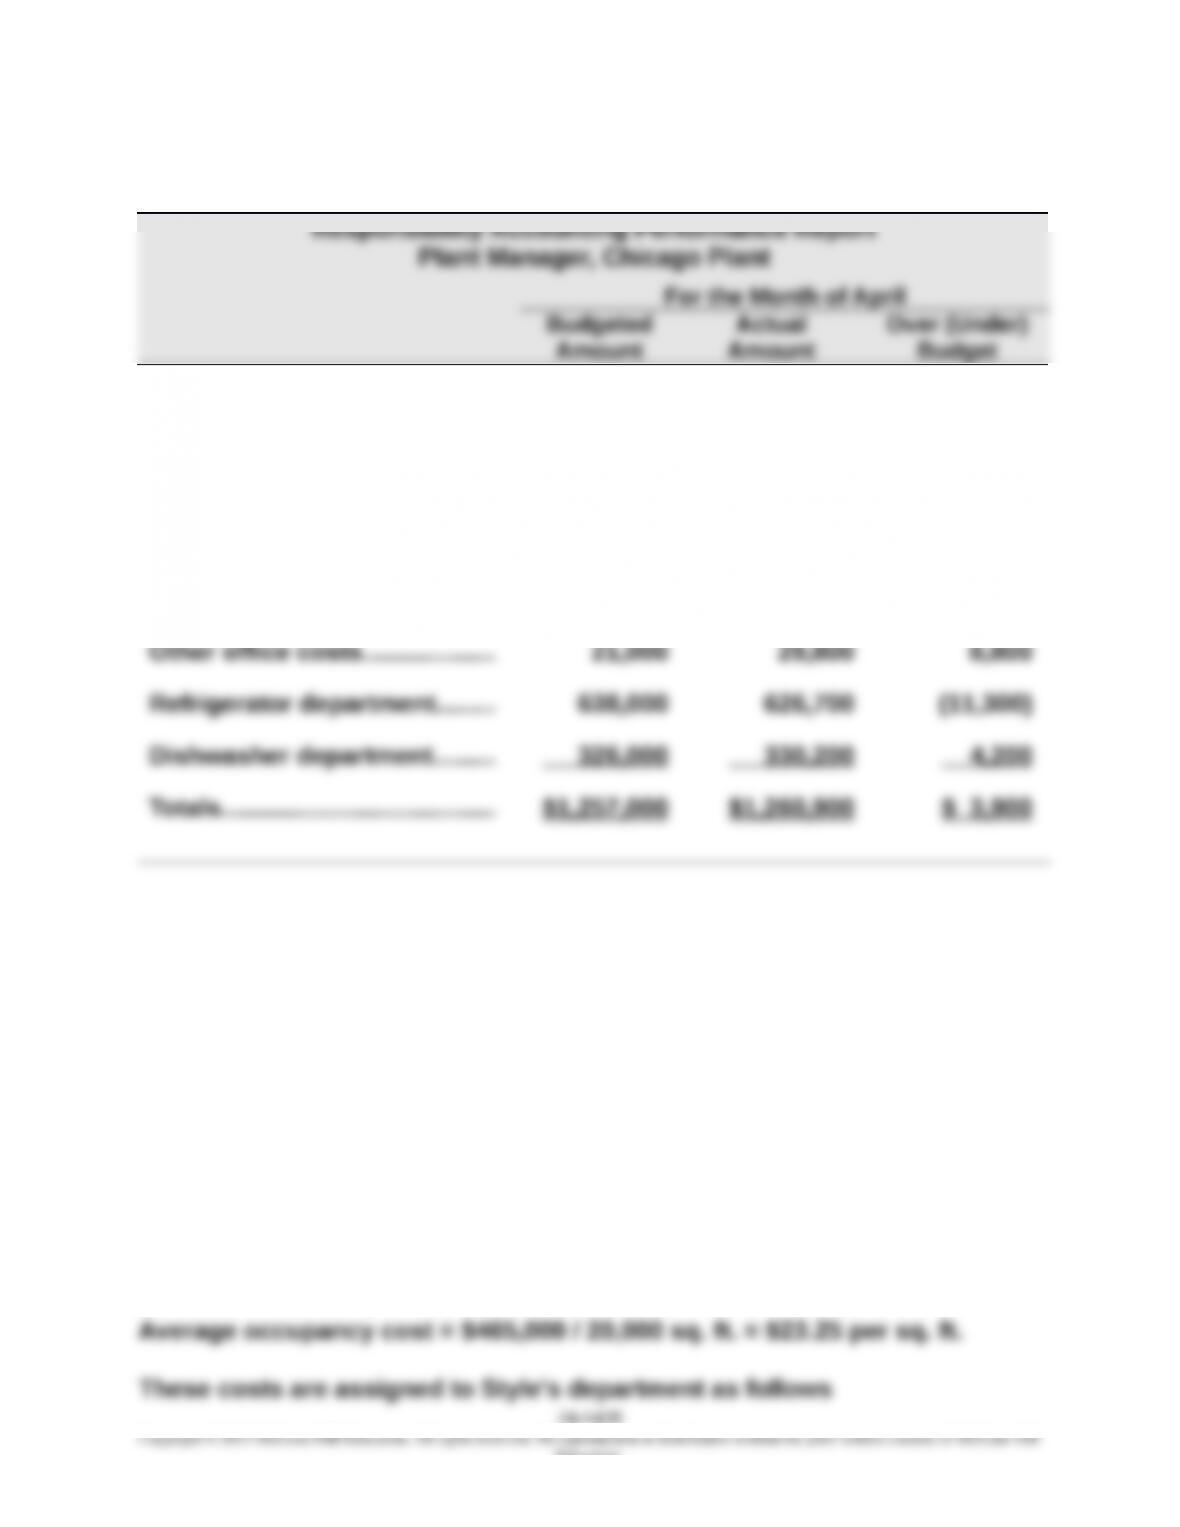
Part 2
The refrigerator department manager did a good job of controlling costs
and meeting the budget, spending $11,300 below budget. However, the
dishwasher department did not do such a good job, spending $4,200 above
the budgeted amount. The plant manager’s controllable costs would have
been under budget by $300 if the Dishwasher department manager’s actual
costs had been equal to budgeted costs.
Problem 24-2B (60 minutes)
Part 1
24-1428
Education.
Chapter 24 – Performance Measurement and Responsibility Accounting
Department Square
Footage
Rate Total
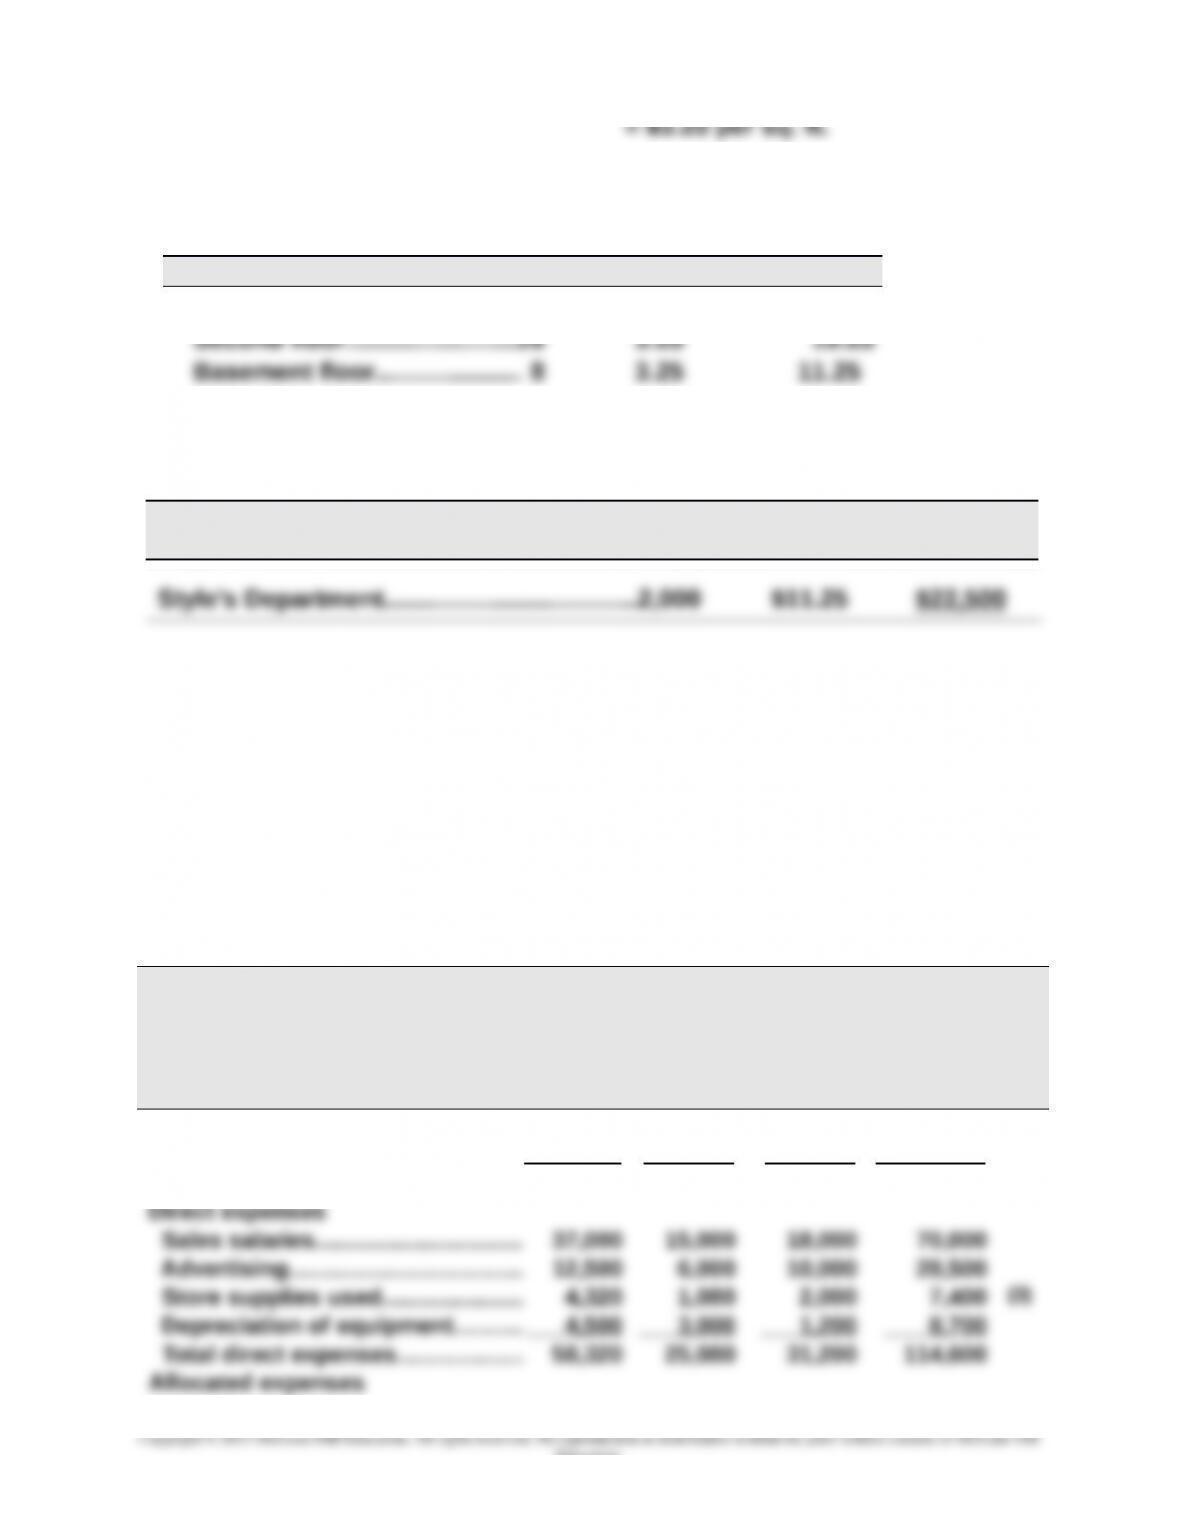
Style’s Dept…..……..…… 2,000 $23.25 $46,500
Part 2
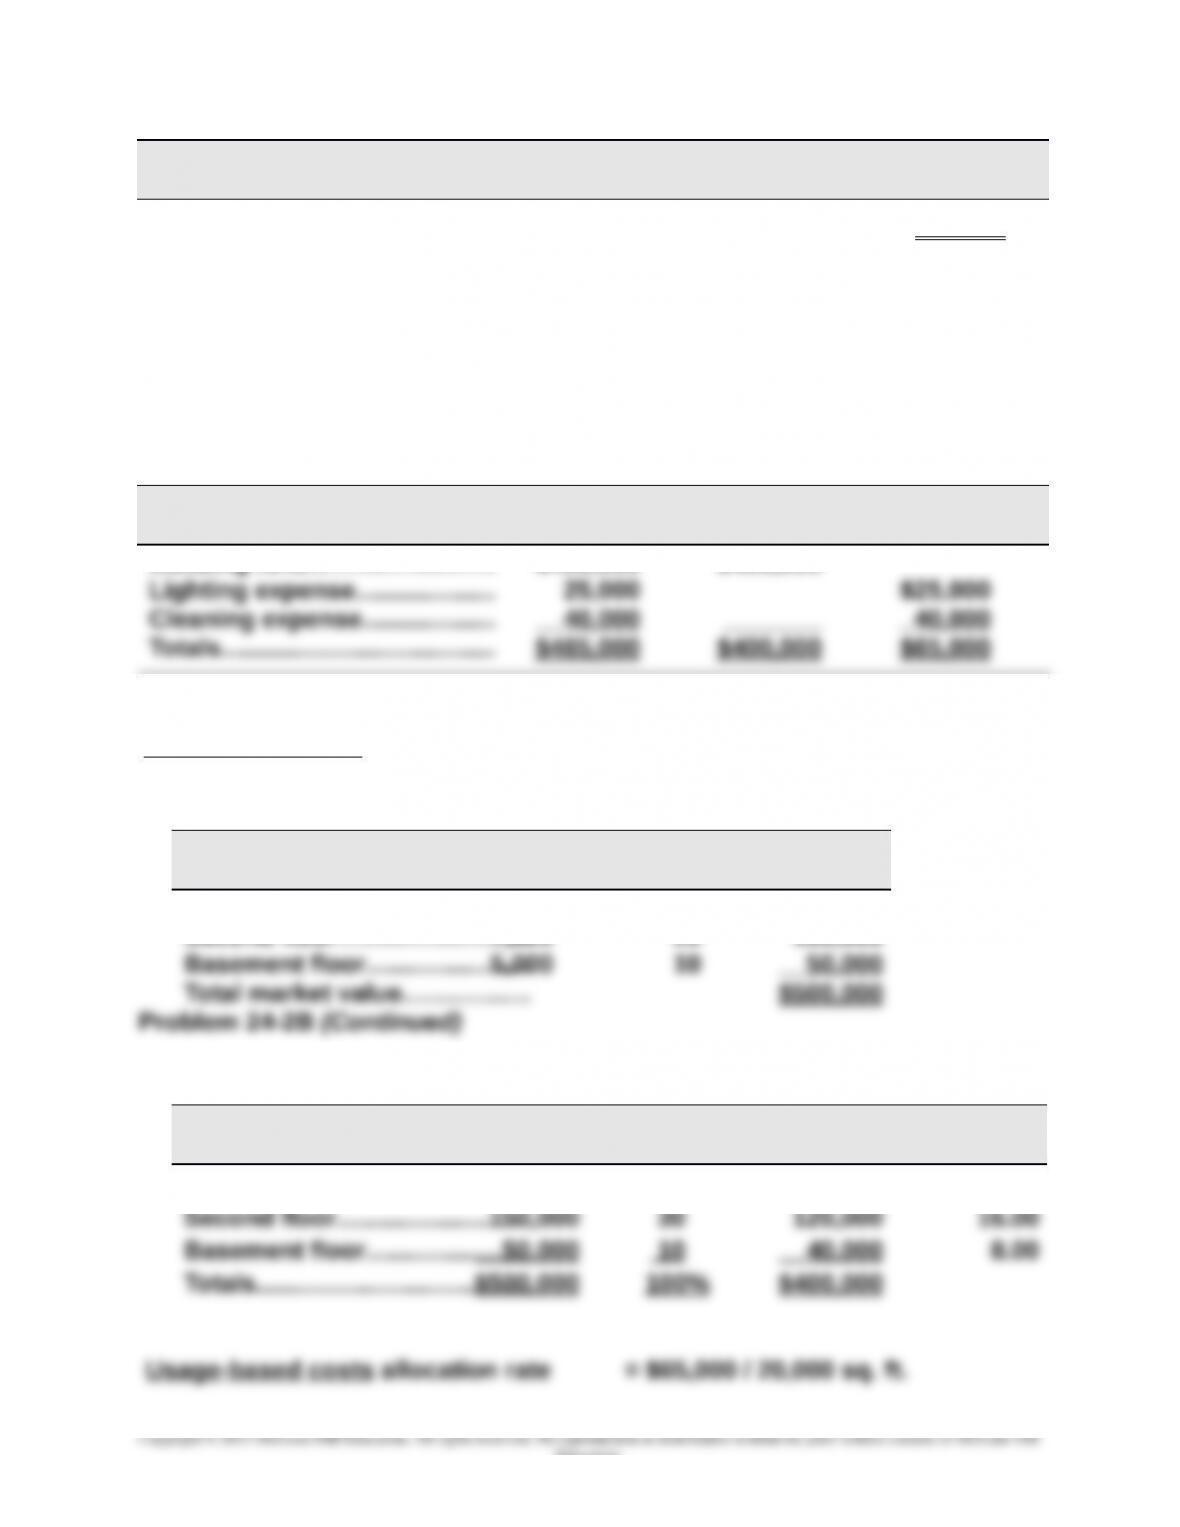
Market rates are used to allocate occupancy costs for the building rent.
Lighting and cleaning costs are allocated to the departments on all three
floors at the average rate per square foot. Costs assigned to each class are:
Occupancy Costs
Total
Costs
Value-Based
Costs
Usage-Based
Costs
Building rent….……..…………... $400,000 $400,000
Value-based costs are allocated in two steps
(i) Compute market value of each floor
Floor
Square
Footage
Value per
Sq. Ft. Total
First floor……………………………7,500 $40 $300,000
Second floor….……..…….........7,500 20 150,000
(ii) Allocate the $400,000 to each floor based on its percent of market value
Floor
Market
Value
% of
Total
Allocated
Cost
Cost per
Sq. Ft.
First floor……………………………$300,000 60% $240,000 $32.00
24-1429
Education.
Chapter 24 – Performance Measurement and Responsibility Accounting
Total allocation rates for the departments on all three floors are
Floor Value Usage Total
First floor………….……………..$32 $3.25 $35.25
These rates are applied to allocate occupancy costs to Style’s department:
Department
Square
Footage Rate Total
Part 3
A basement manager would prefer the allocation based on market value. This
is a reasonable and logical approach to allocation of occupancy costs. With a
flat rate method, all square footage has equal value. This is not logical for this
type of occupancy. Less cost would be allocated to the basement
departments if the market value method were used.
Problem 24-3B (70 minutes)
BONANZA ENTERTAINMENT
Forecasted Departmental Income Statements
For Year Ended December 31, 2016
Movies
Video
Games
Compact
Discs Combined
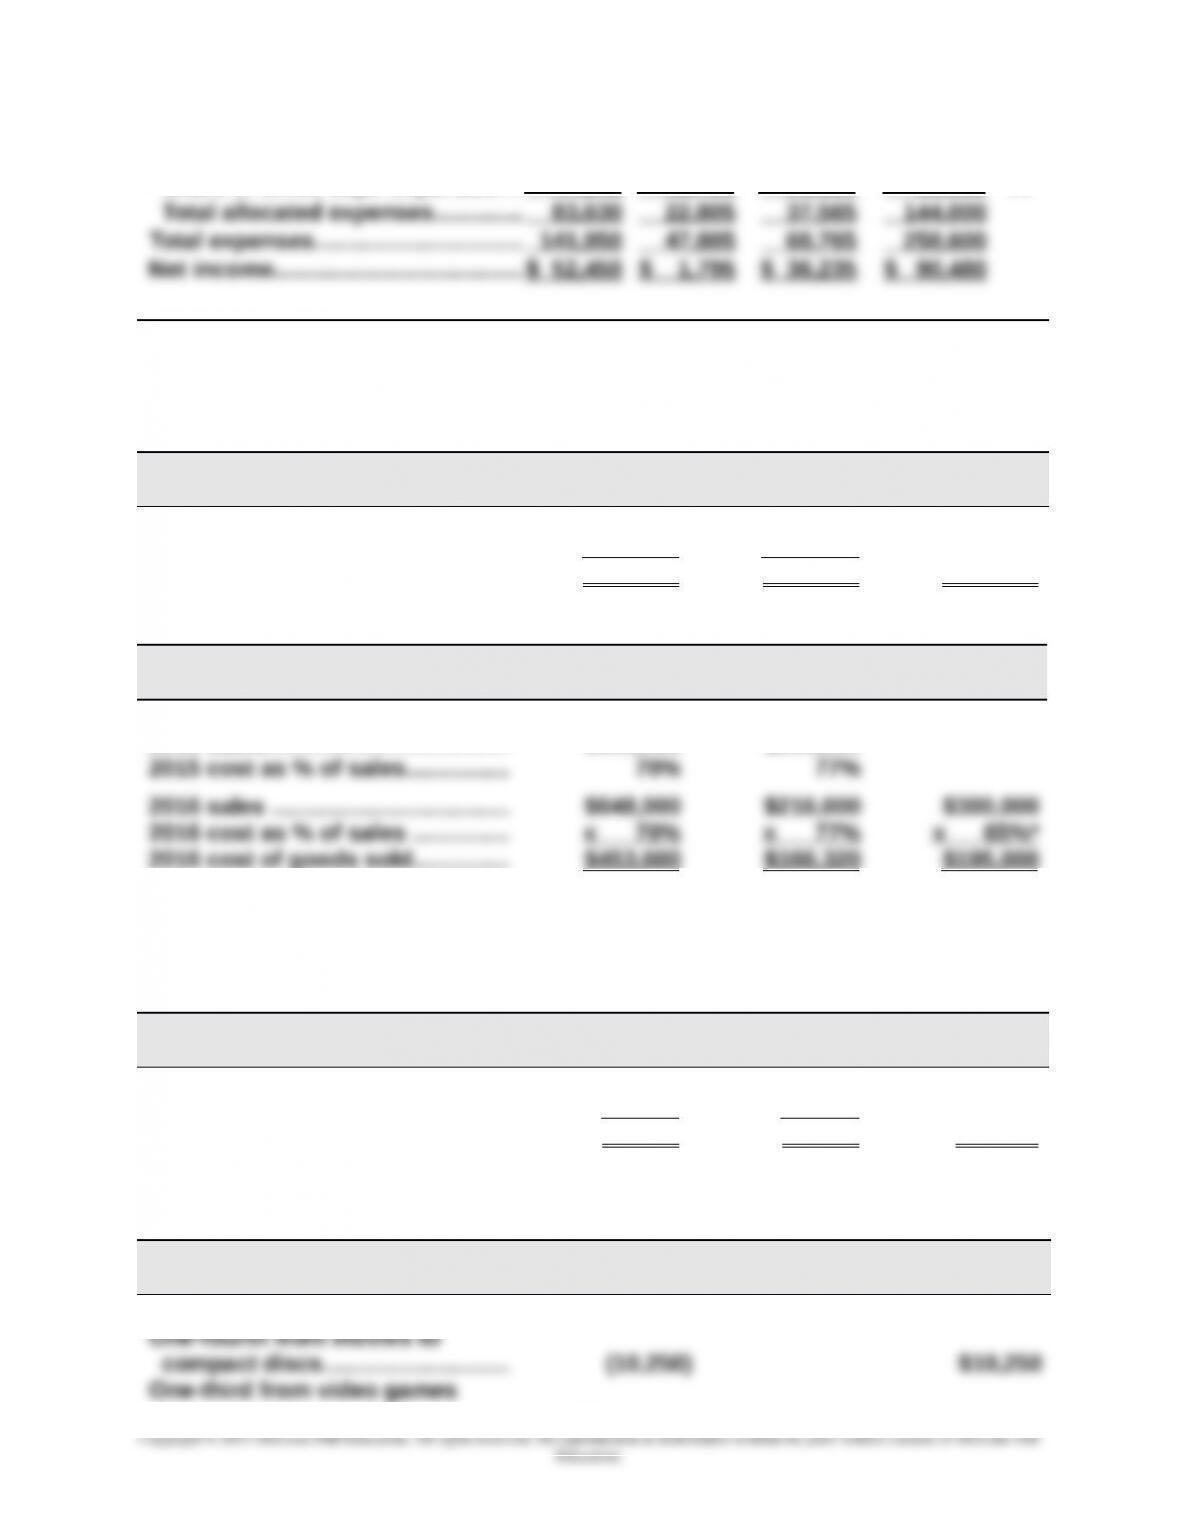
Sales…..……………………………….….... $648,000 $216,000 $300,000 $1,164,000 (1)
Cost of goods sold……..….….......... 453,600 166,320 195,000 814,920 (2)
Gross profit………..………………..….... 194,400 49,680 105,000 349,080
24-1430
Education.
Chapter 24 – Performance Measurement and Responsibility Accounting
Rent expense……….………………..… 30,750 6,000 13,250 50,000 (4)
Utilities expense…………………….… 5,535 1,080 2,385 9,000 (4)
Share of office dept. expenses.... 47,345 15,725 21,930 85,000 (5)
Supporting Computations—coded (1) through (5) in statement above
Note 1 (Sales)
Movies
Video
Games
Compact
Discs
2015 sales…………………….….…..…. $600,000 $200,000
Growth rate (8% increase)........... x 108% x 108%
2016 sales…………………….….…..…. $648,000 $216,000 $300,000
Note 2 (Cost of Goods Sold)
Movies
Video
Games
Compact
Discs
2015 cost of goods sold…………... $420,000 $154,000
2015 sales…………………….….…..…. $600,000 $200,000
* The 65% cost of goods sold percent is computed as 100% minus the predicted 35% gross margin.
Problem 24-3B (Continued)
Note 3 (Store Supplies Used)
Movies
Video
Games
Compact
Discs
2015 store supplies used ……...... $ 4,000 $ 1,000
Growth rate (8% increase)........... x 108% x 108%
2016 store supplies …..…............. $ 4,320 $ 1,080 $ 2,000
Note 4 (Rent and Utilities)
Movies
Video
Games
Compact
Discs
2015 rent …….…………..….….…..….. $41,000 $ 9,000
24-1431
2016 rent …….…………..….….…..….. $30,750 $ 6,000 $13,250
Percent of total ………..………….….. 61.5% 12.0% 26.5%
2016 allocation of $9,000
total utilities ………….…………..….. $ 5,535 $1,080 $ 2,385
2016 sales ……………………….…..…. $648,000 $216,000 $300,000
Percent of total sales* …..…......... 55.7% 18.5%†25.8%
2016 allocation of $85,000
* Rounded to the nearest 0.1% * If students round to something other than one-tenth of a percent,
their numbers will slightly vary.
†Adjusted to eliminate rounding difference.
Problem 24-4B (45 minutes)
Part 1
SADAR COMPANY
Departmental Contribution Statements
Videos Music
Sales…………………..…..………… $370,500 $279,500
Cost of goods sold……..……… 320,000 175,000
Gross profit……………….………. 50,500 104,500
Direct expenses
Salaries……………………………... 35,000 25,000
Maintenance……………………....
Utilities………………………………
12,000
5,000
10,000
4,500
Salaries**………………………..…. 16,200 10,800
24-1432
Education.
Chapter 24 – Performance Measurement and Responsibility Accounting
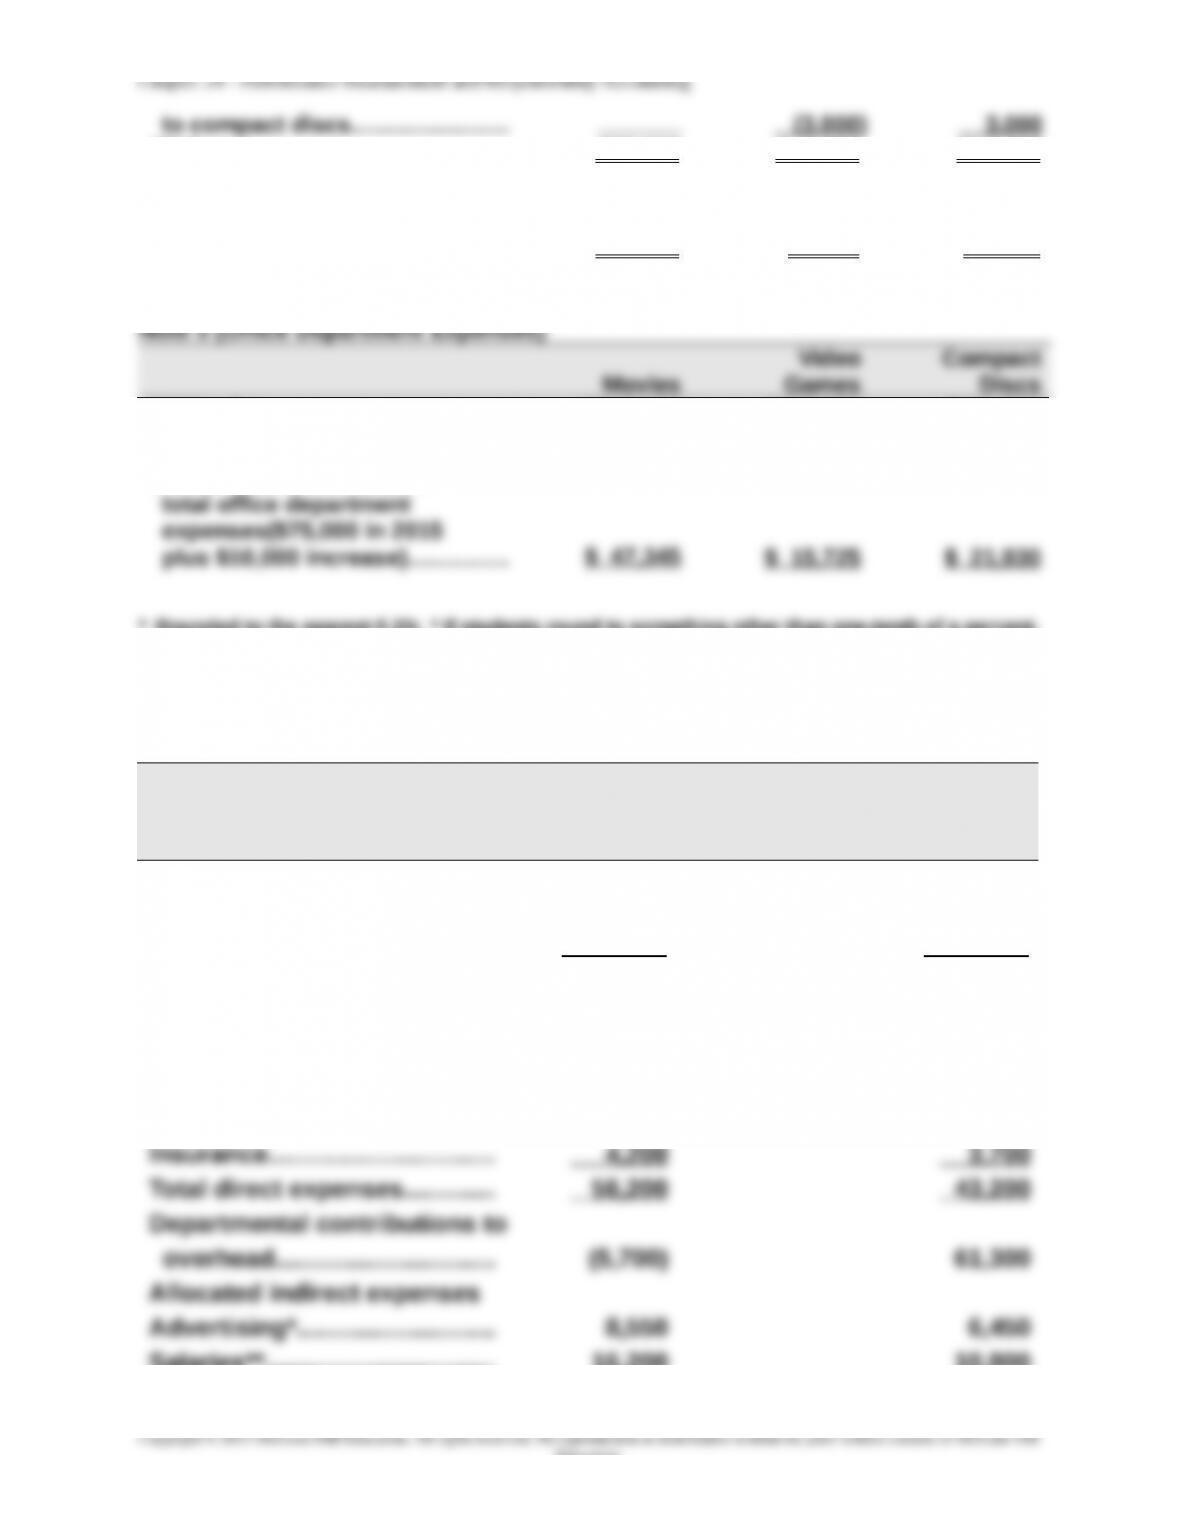
Office****…………………………....
Total indirect expenses……….
2,000
26,750
1,200
18,450
Operating income……….……… $ (32,450) $ 42,850
*Advertising allocation: Sales % Amount Allocated
Videos $370,500 57% $15,000 $ 8,550
Music 279,500 43% 15,000 6,450
Total $650,000 100% $15,000
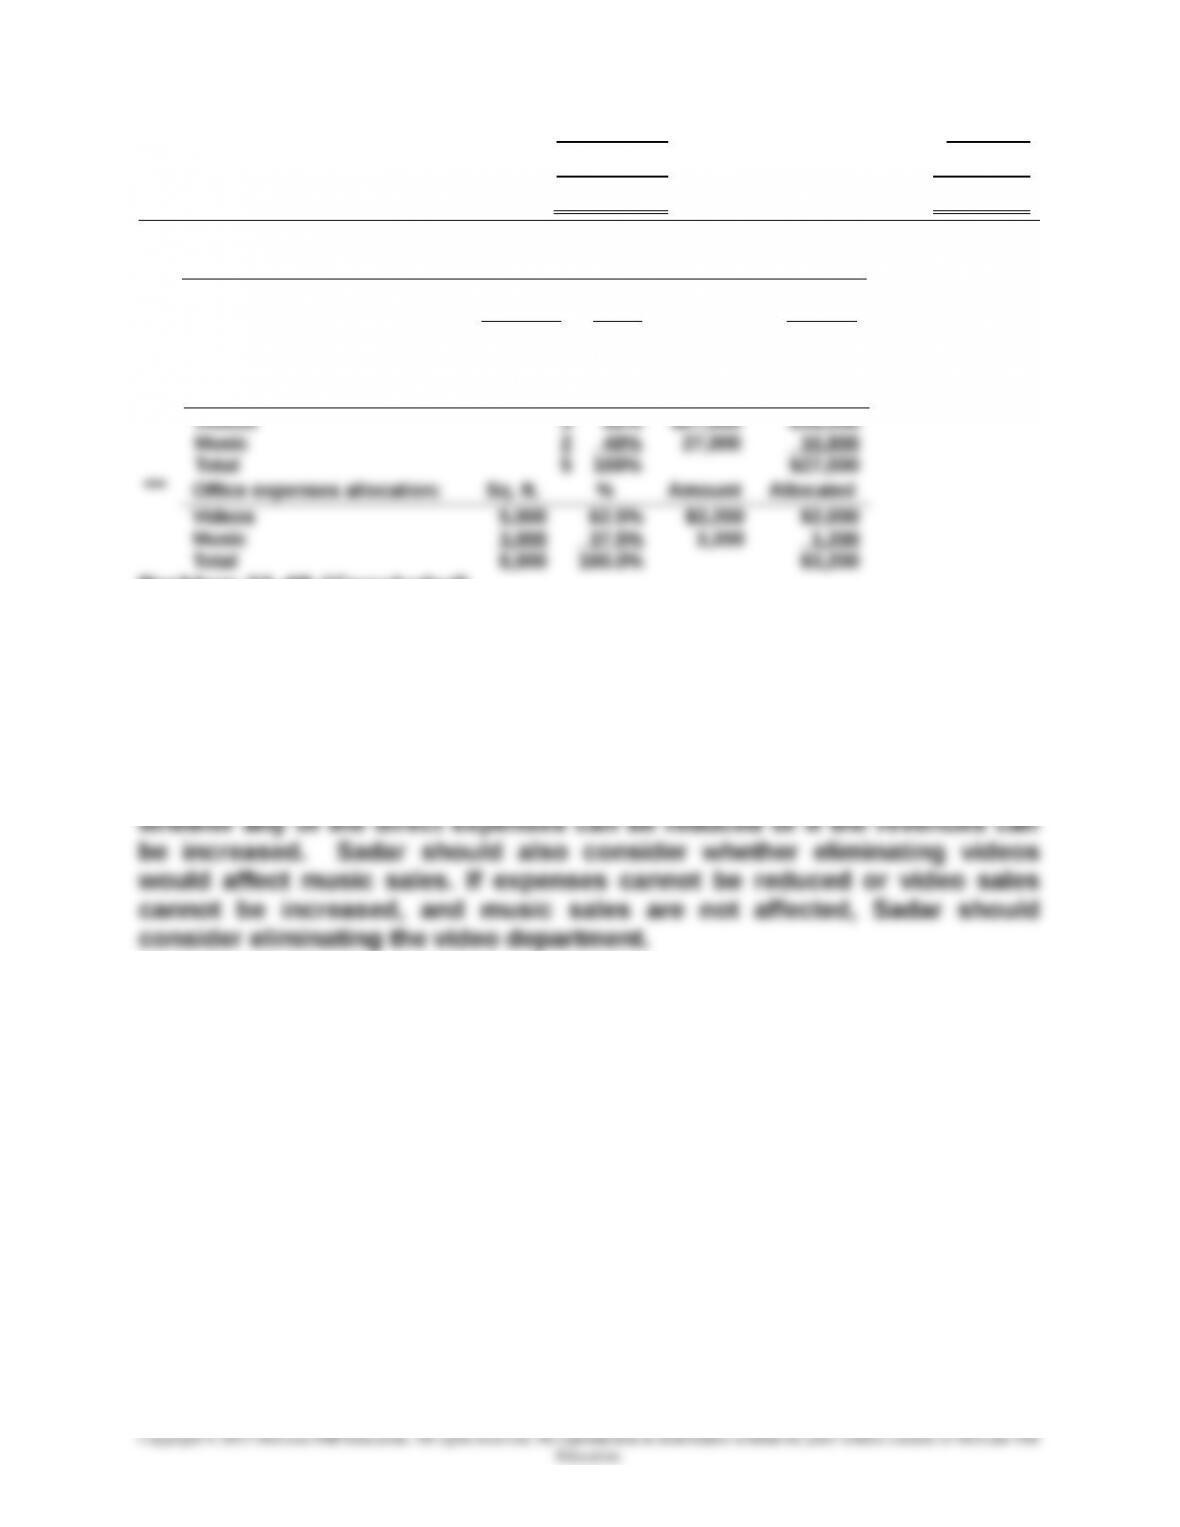
** Salaries allocation: Employees % Amount Allocated
Problem 22-4B (Concluded)
Part 2
The videos department has both a negative contribution to overhead and a
negative departmental net income. It is not even covering its own direct
costs, and is therefore not contributing anything to overhead. Before
deciding whether to eliminate the video department, Sadar should consider
24-1433