Problem 24-1B (Continued)
c.
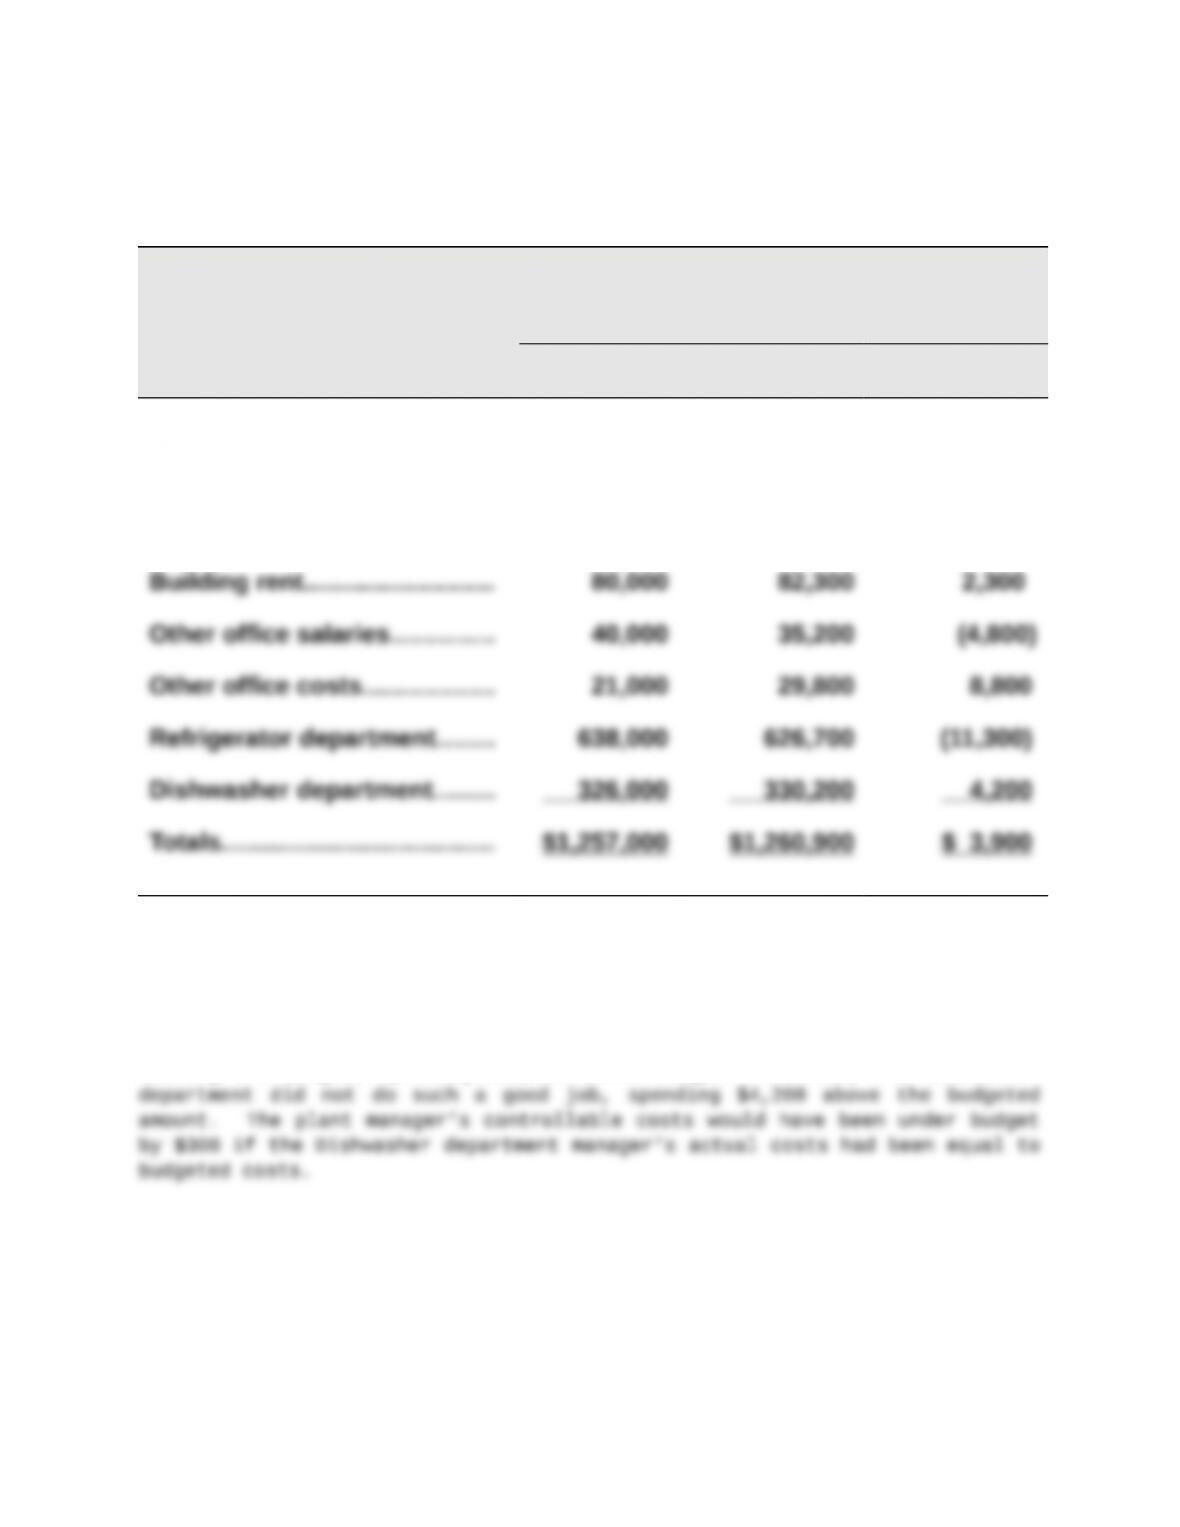
Responsibility Accounting Performance Report
Plant Manager, Chicago Plant
For the Month of April
Budgeted Actual Over (Under)
Amount Amount Budget
Controllable Costs
Dept. manager salaries………. $ 104,000 $ 101,500 $ (2,500)
Utilities…………………………….. 48,000 55,200 7,200
Part 2
The refrigerator department manager did a good job of controlling costs and
meeting the budget, spending $11,300 below budget. However, the dishwasher
Problem 24-2B (60 minutes)
Part 1
Average occupancy cost = $465,000 / 20,000 sq. ft. = $23.25 per sq. ft.
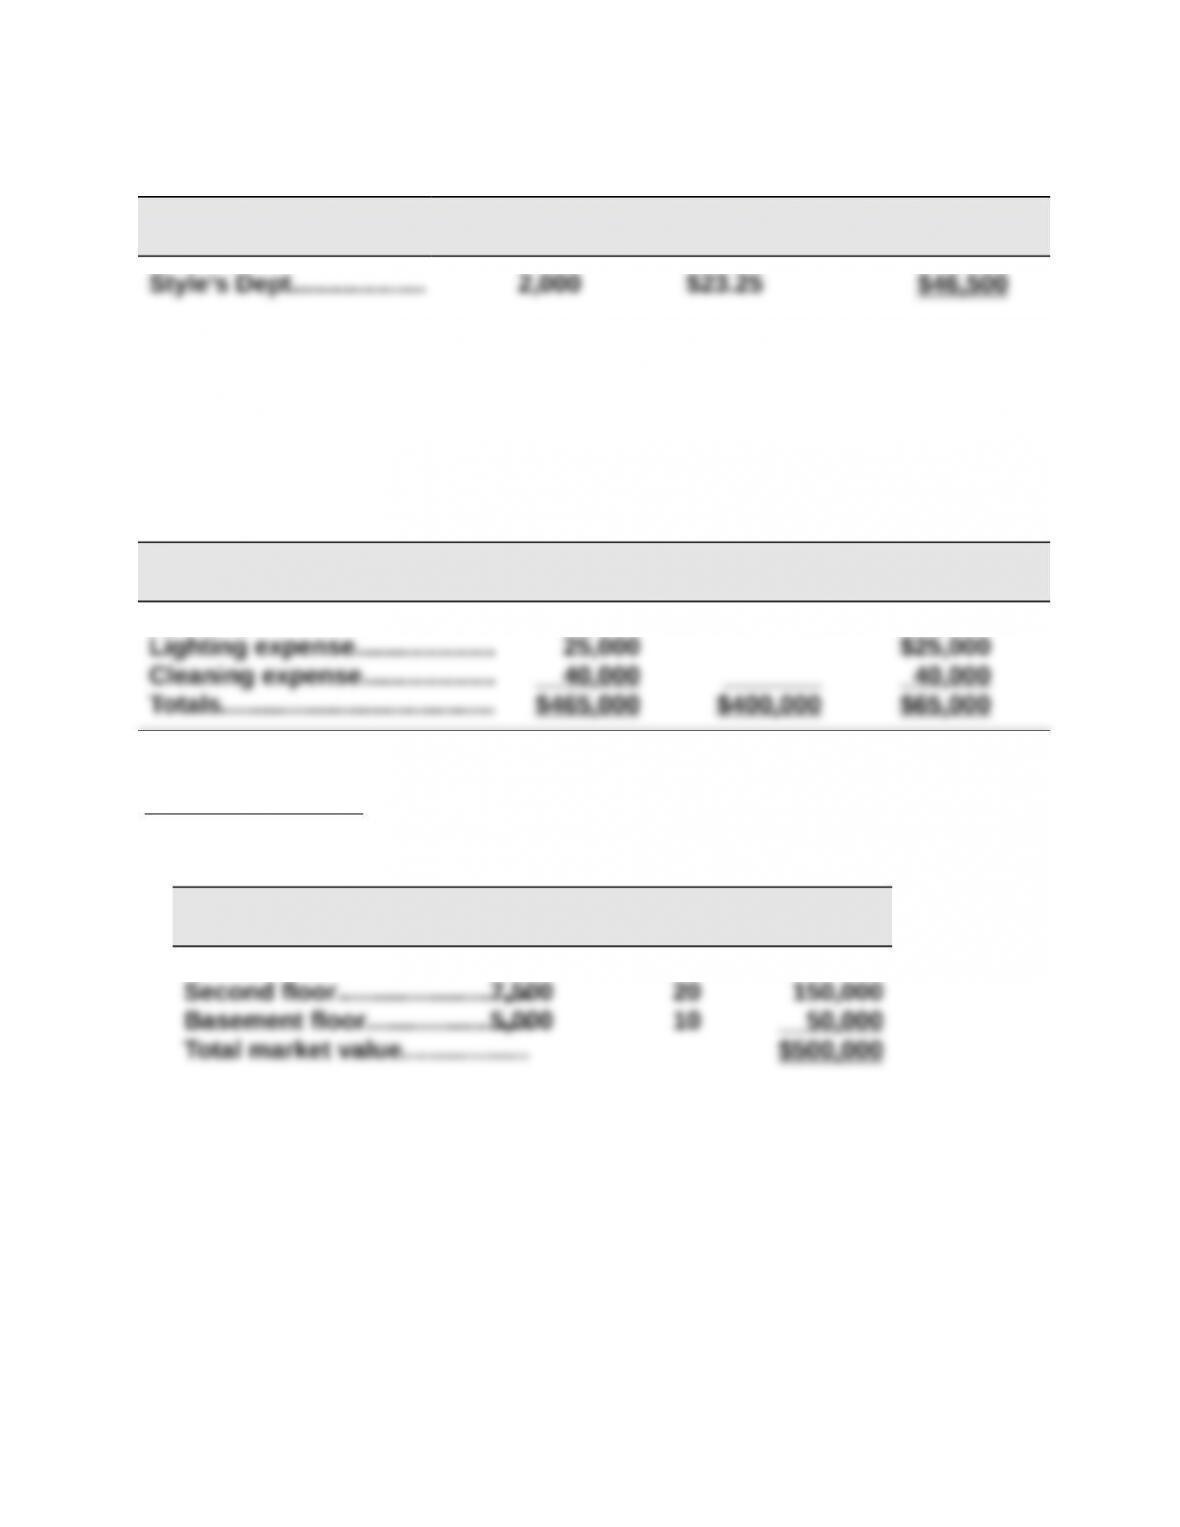
These costs are assigned to Style’s department as follows
Department Square
Footage
Rate Total
Part 2
Market rates are used to allocate occupancy costs for the building rent.
Lighting and cleaning costs are allocated to the departments on all three
floors at the average rate per square foot. Costs assigned to each class are:
Occupancy Costs
Total
Costs
Value-Based
Costs
Usage-Based
Costs
Building rent…………………….. $400,000 $400,000
Value-based costs are allocated in two steps
(i) Compute market value of each floor
Floor
Square
Footage
Value per
Sq. Ft. Total
First floor…………………………..7,500 $40 $300,000
Problem 24-2B (Continued)
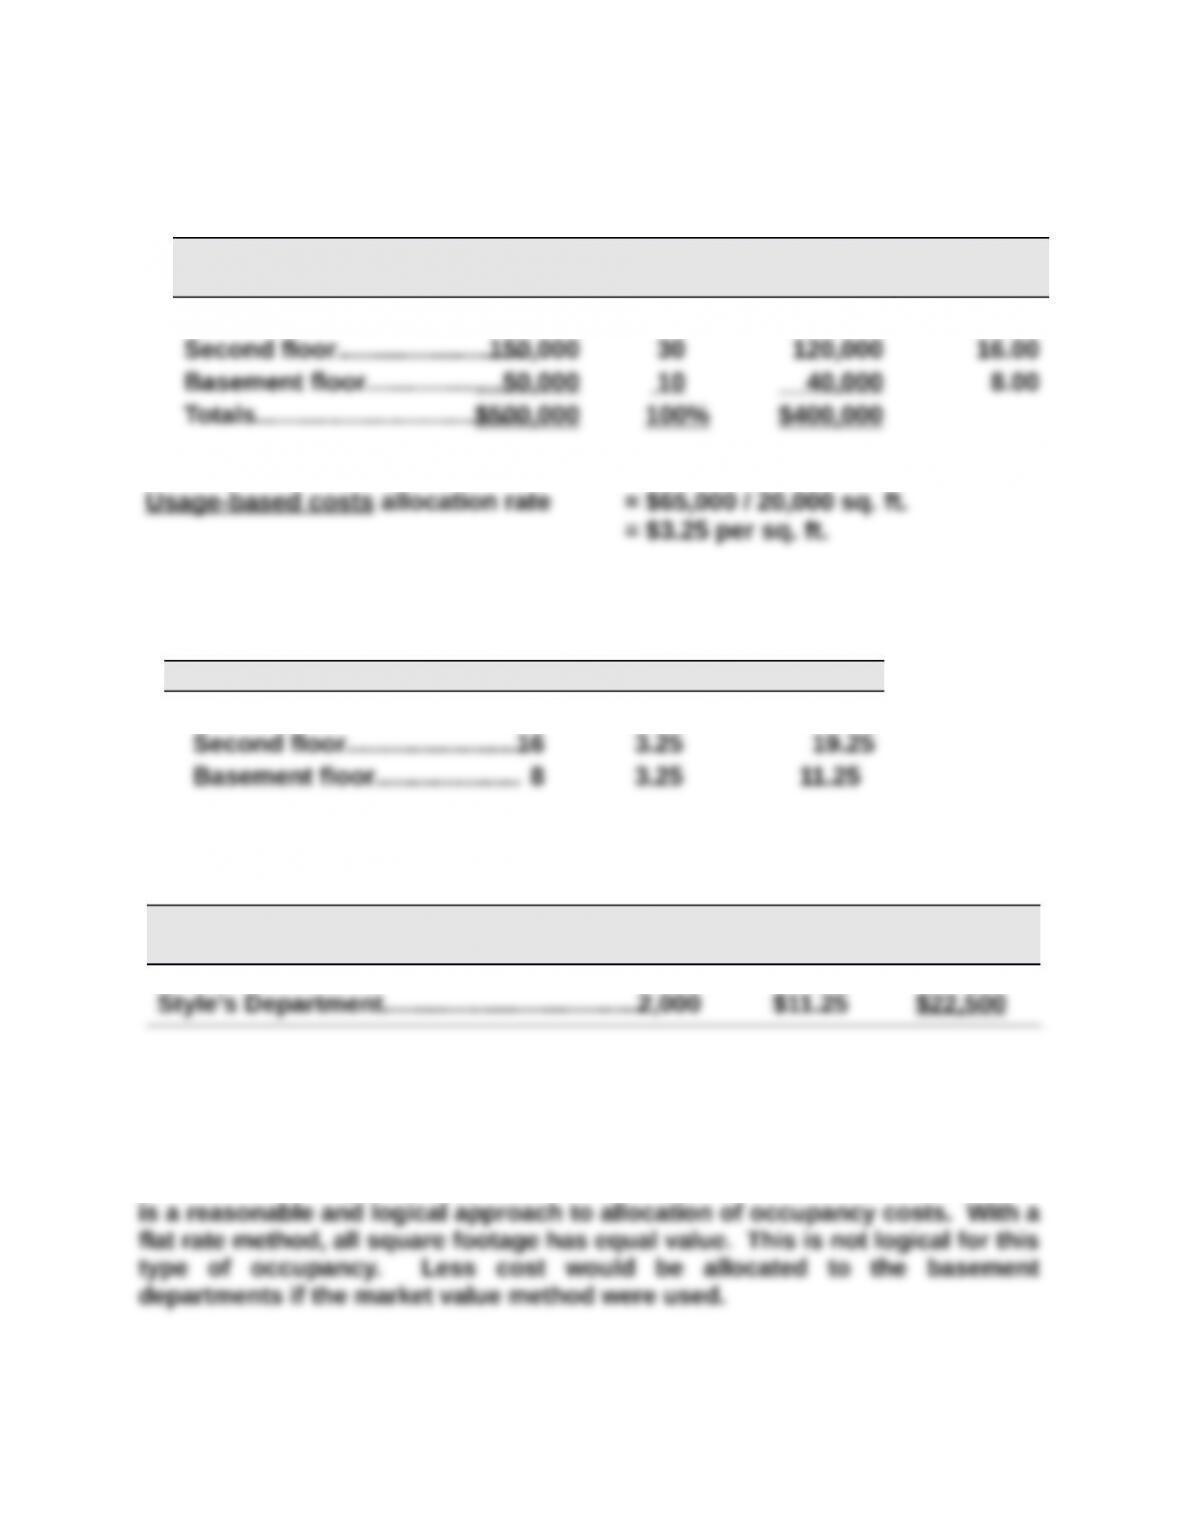
(ii) Allocate the $400,000 to each floor based on its percent of market value
Floor
Market
Value
% of
Total
Allocated
Cost
Cost per
Sq. Ft.
First floor…………………………..$300,000 60% $240,000 $32.00
Total allocation rates for the departments on all three floors are
Floor Value Usage Total
First floor………………………..$32 $3.25 $35.25
These rates are applied to allocate occupancy costs to Style’s department:
Department
Square
Footage Rate Total
Part 3
A basement manager would prefer the allocation based on market value. This
Problem 24-3B (70 minutes)
BONANZA ENTERTAINMENT
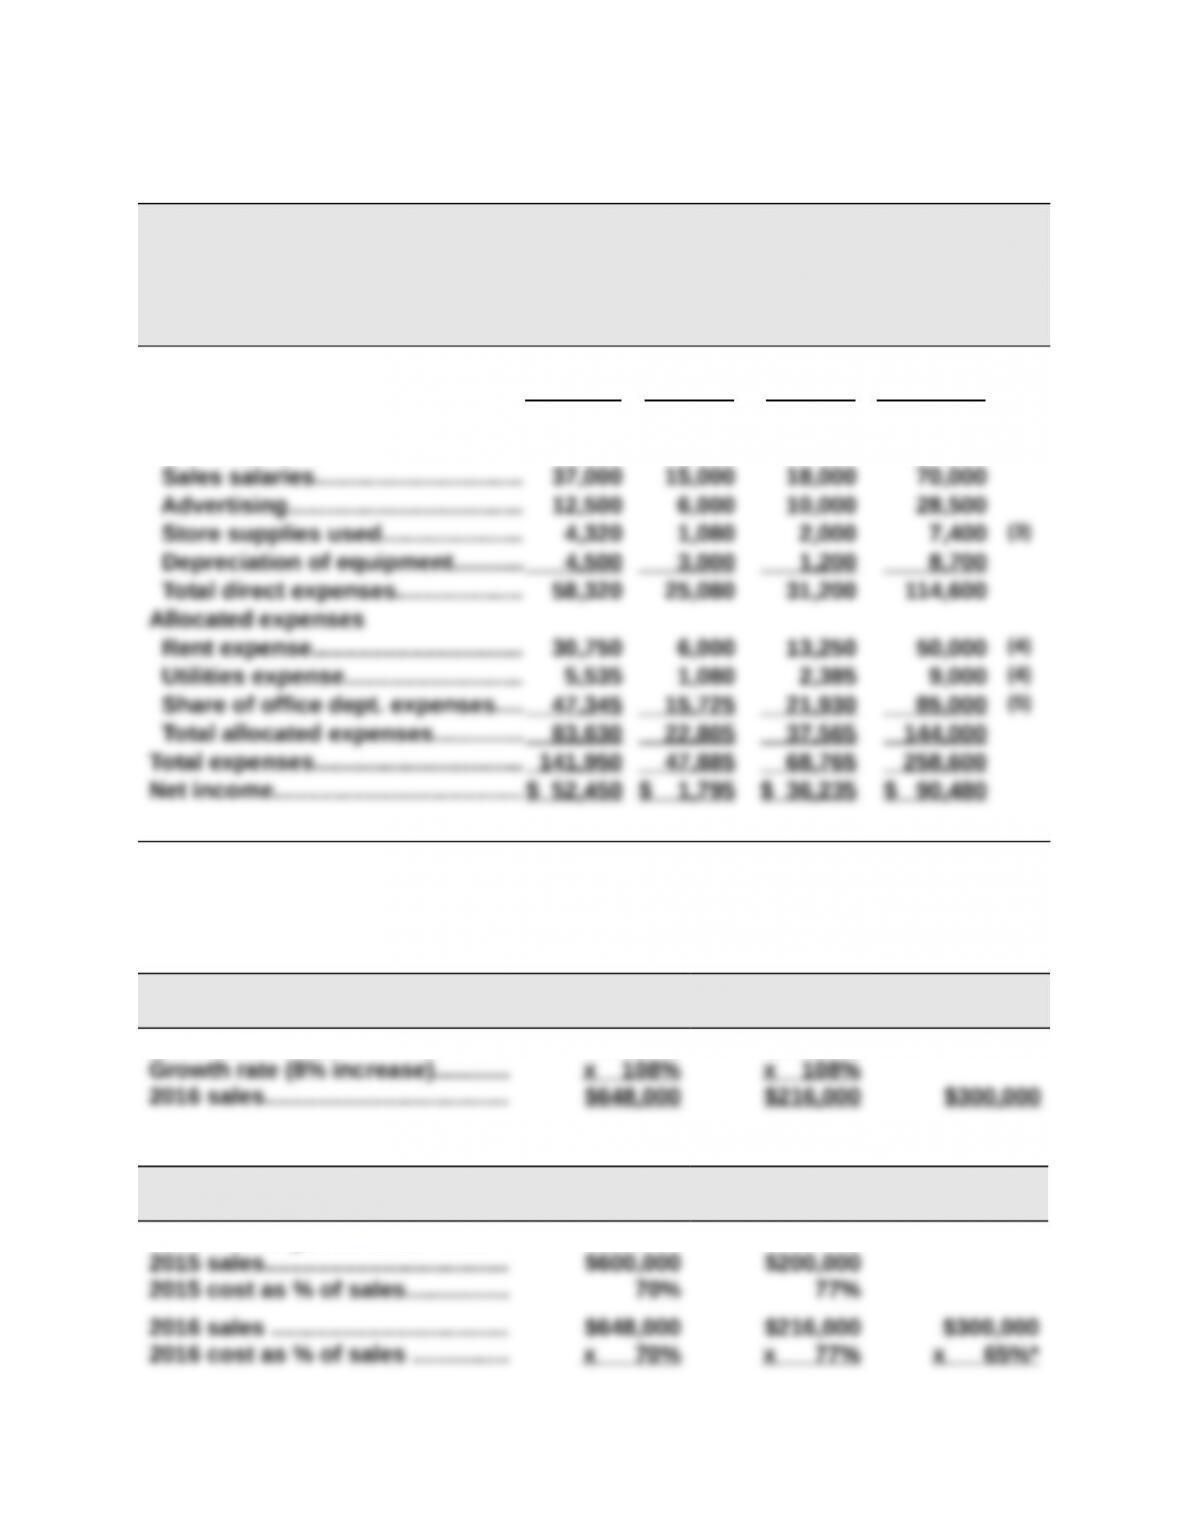
Forecasted Departmental Income Statements
For Year Ended December 31, 2016
Movies
Video
Games
Compact
Discs Combined
Sales……………………………………….. $648,000 $216,000 $300,000 $1,164,000 (1)
Cost of goods sold……………………. 453,600 166,320 195,000 814,920 (2)
Gross profit……………………………… 194,400 49,680 105,000 349,080
Direct expenses
Supporting Computations—coded (1) through (5) in statement above
Note 1 (Sales)
Movies
Video
Games
Compact
Discs
2015 sales………………………………. $600,000 $200,000
Note 2 (Cost of Goods Sold)
Movies
Video
Games
Compact
Discs
2015 cost of goods sold………….. $420,000 $154,000

* The 65% cost of goods sold percent is computed as 100% minus the predicted 35% gross margin.
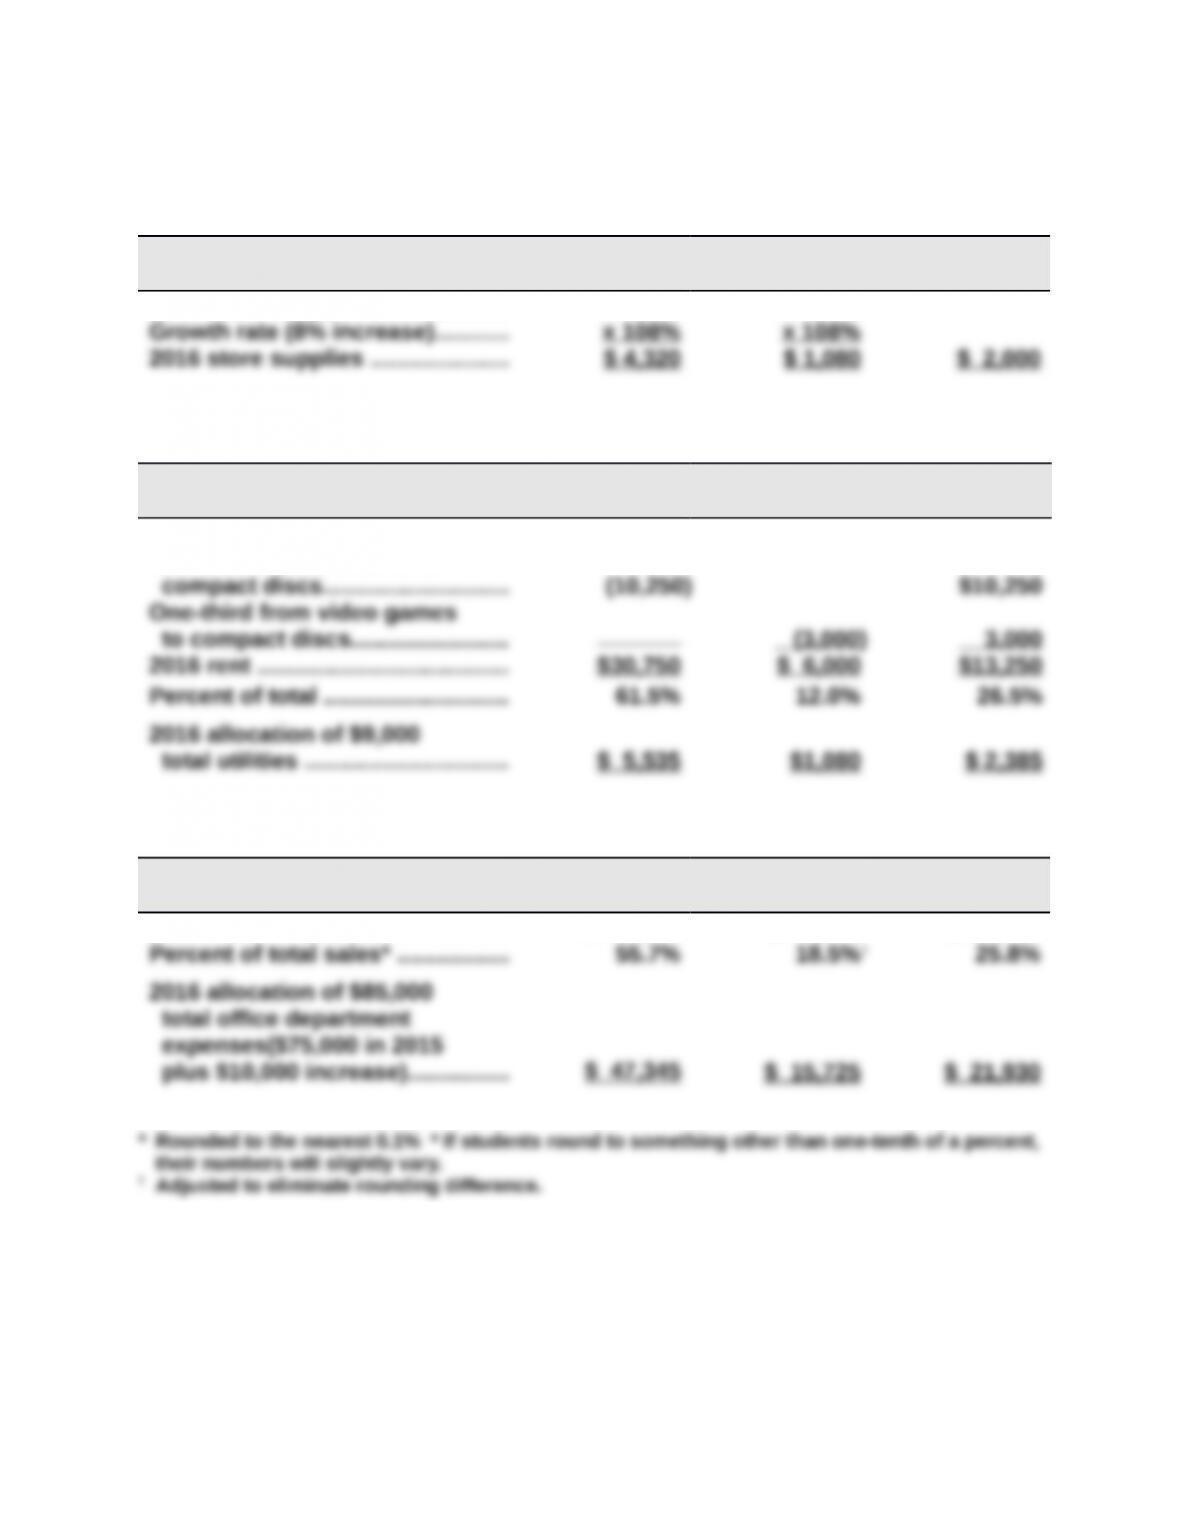
Problem 24-3B (Continued)
Note 3 (Store Supplies Used)
Movies
Video
Games
Compact
Discs
2015 store supplies used ………… $ 4,000 $ 1,000
Note 4 (Rent and Utilities)
Movies
Video
Games
Compact
Discs
2015 rent ……………………………….. $41,000 $ 9,000
One-fourth from movies to
Note 5 (Office Department Expenses)
Movies
Video
Games
Compact
Discs
2016 sales ……………………………… $648,000 $216,000 $300,000
Problem 24-4B (45 minutes)
Part 1
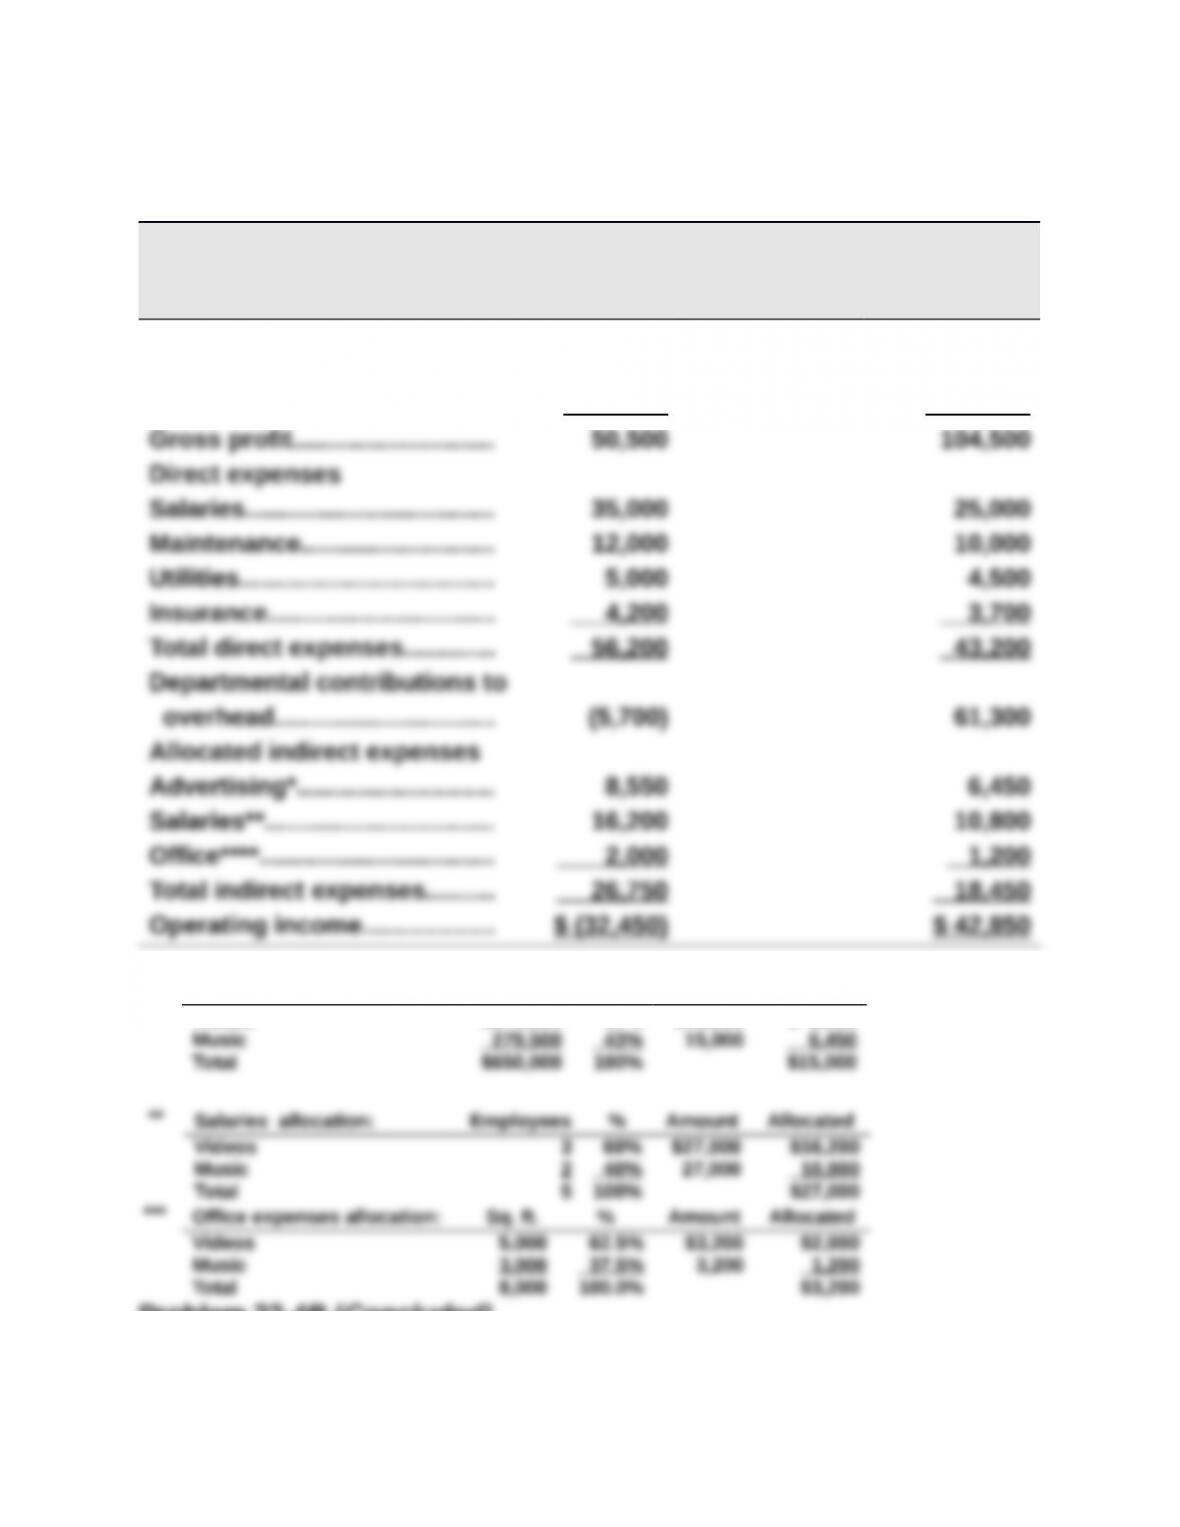
SADAR COMPANY
Departmental Contribution Statements
Videos Music
Sales………………………………… $370,500 $279,500
Cost of goods sold……………. 320,000 175,000
*Advertising allocation: Sales % Amount Allocated
Videos $370,500 57% $15,000 $ 8,550
Problem 22-4B (Concluded)

Part 2
The videos department has both a negative contribution to overhead and a negative departmental net
income. It is not even covering its own direct costs, and is therefore not contributing anything to
overhead. Before deciding whether to eliminate the video department, Sadar should consider whether any
of the direct expenses can be reduced or if the revenues can be increased. Sadar should also consider
cannot be increased, and music sales are not affected, Sadar should consider eliminating the video
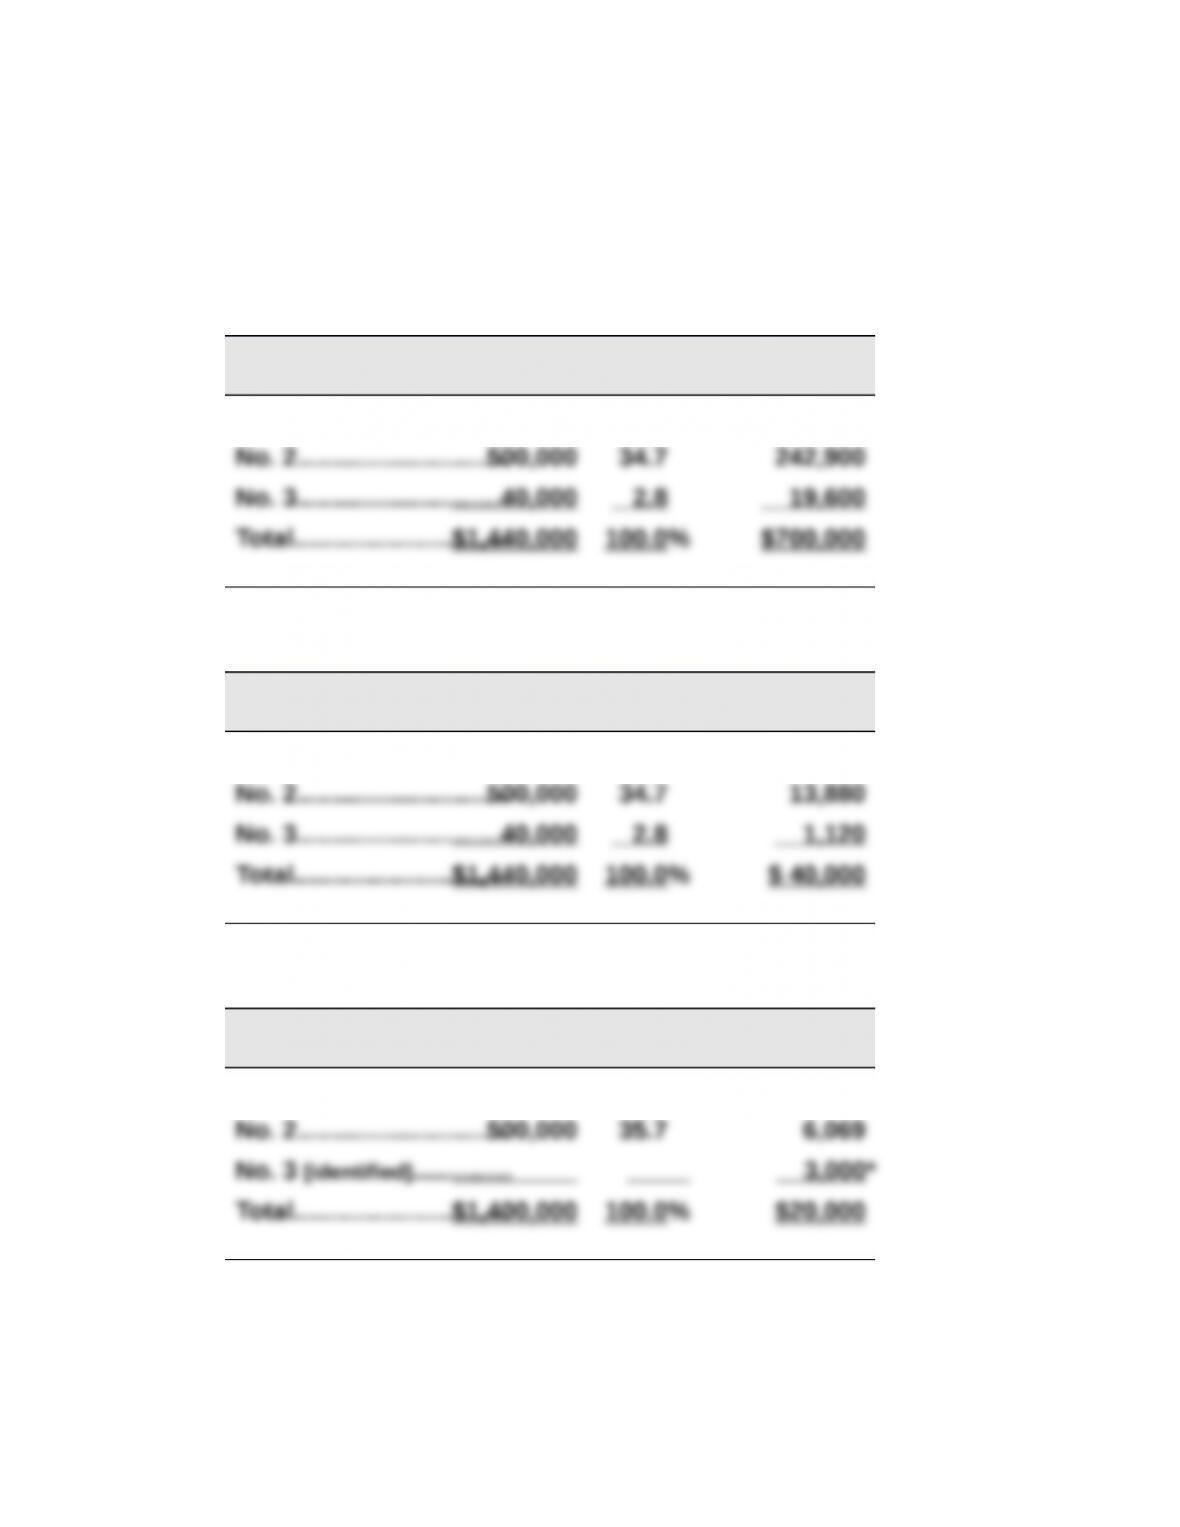
Harvesting, sorting, and grading: $40,000
Grade
Sales
Value
Percent
of Total
Allocated
Cost
No. 1…………………………$ 900,000 62.5% $ 25,000
Delivery: $17,000 to Grade Nos. 1 & 2
Grade
Sales
Value
Percent
of Total
Allocated
Cost
No. 1…………………………$ 900,000 64.3% $10,931
* No. 3 Grade delivery costs are separately identified by the company.
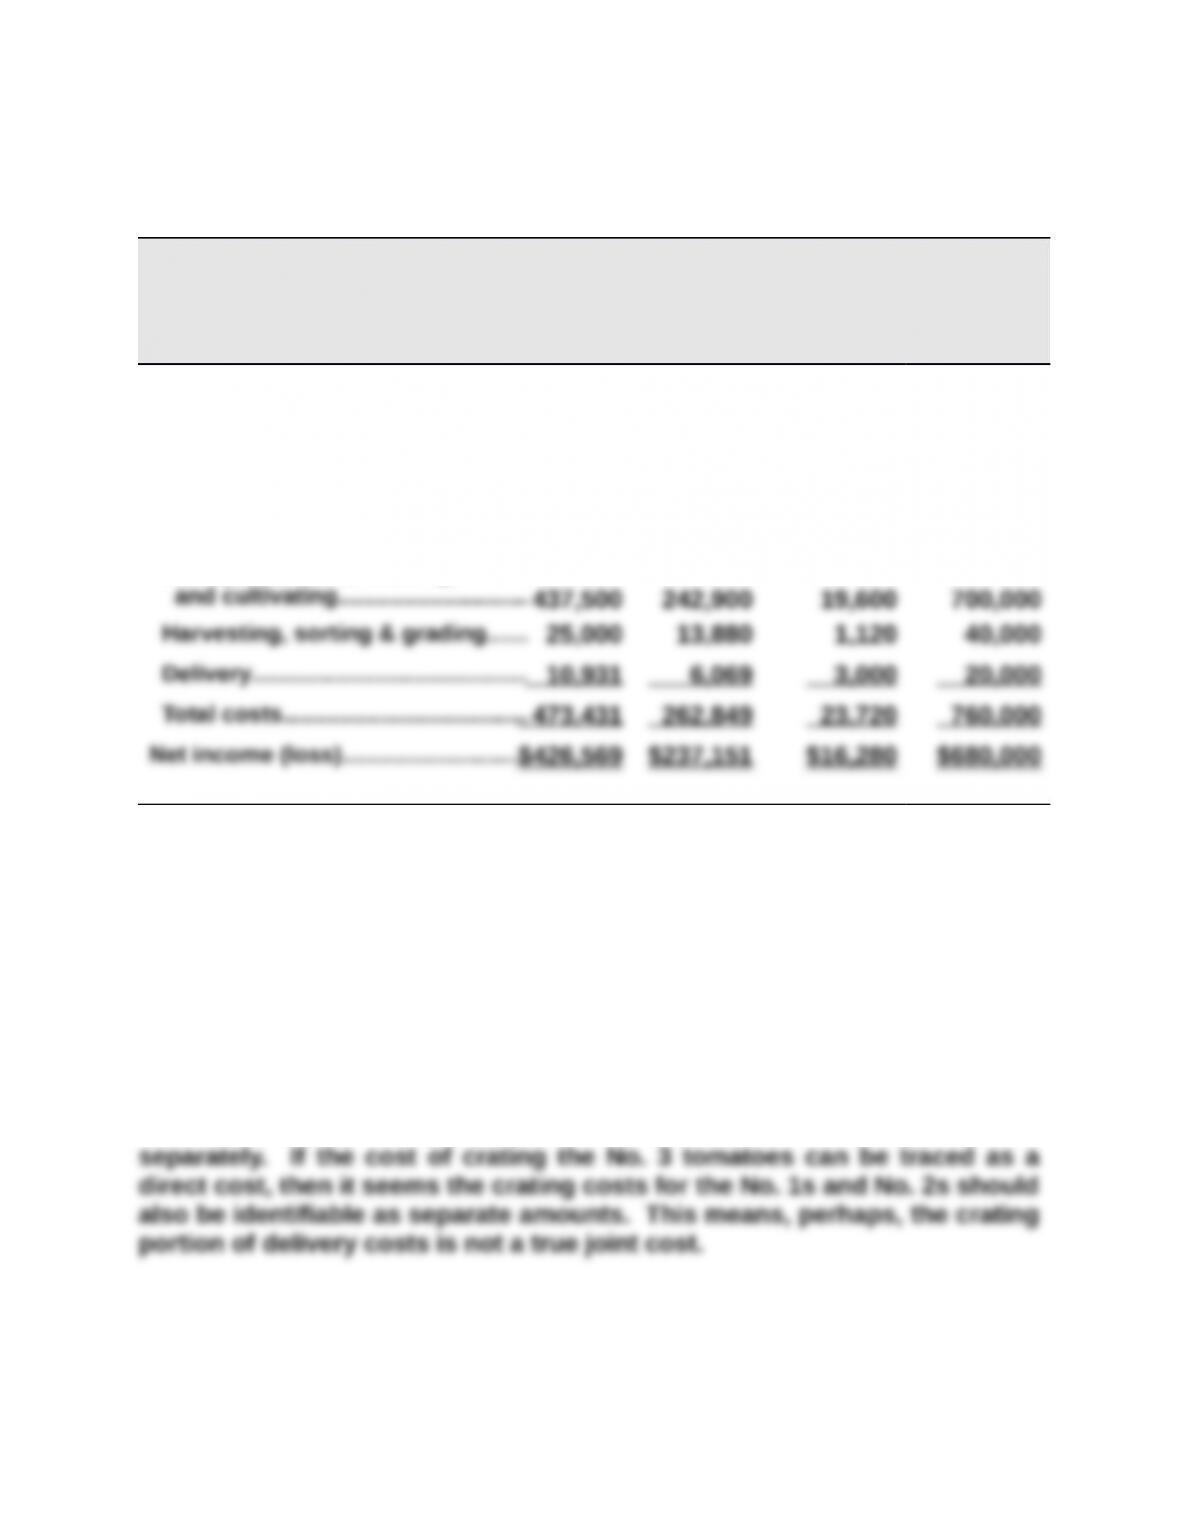
Problem 24-5B (Continued)
Part 2
RITA AND RICK REDDING
Income Statement
For Year Ended December 31, 2015
No. 1 No. 2 No. 3 Combined
Sales (by grade)
No. 1: 500,000 lbs. @ $1.80………..
$900,000
No. 2: 400,000 lbs. @ $1.25……….. $500,000
No. 3: 100,000 lbs. @ $0.40……….. $40,000
Total sales……………………………….. $1,440,000
Costs
Land preparation, seeding,
Part 3
Delivery costs include both crating and hauling costs. The Reddings are able to identify the portion of the
cost directly related to the No. 3 tomatoes, presumably because the No. 3s are going to a different
destination than the No. 1 and No. 2 tomatoes. If the No. 1s and No. 2s are going to the same place,
then the hauling portion of the delivery cost may truly be a joint cost, at least for the No. 1 and No. 2
tomatoes.
However, since the No. 1 and No. 2 tomatoes are different grades and are
sold for different prices per pound, it seems safe to assume they are crated