Chapter 24 – Performance Measurement and Responsibility Accounting
Exercise 24-21 (20 minutes)
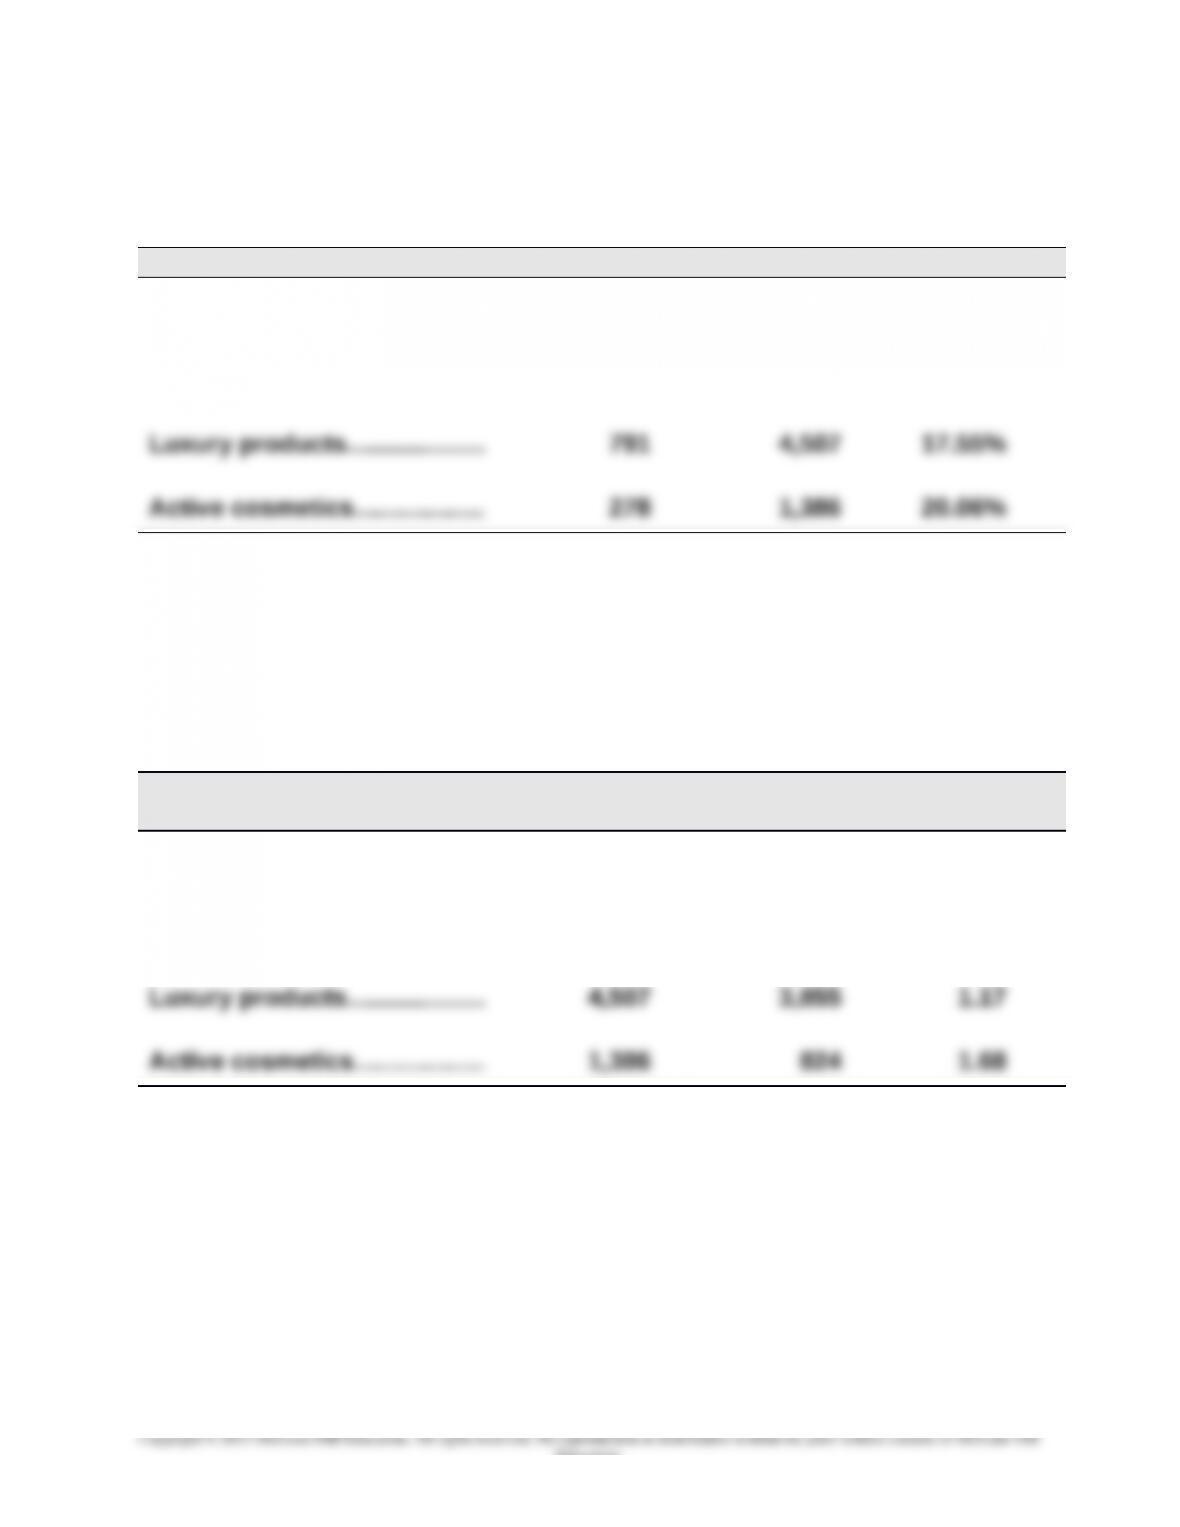
(1) Profit margin = Income/Sales
Investment center Income* Sales* Profit margin
Professional products..…..... € 552 €2,717 20.32%
Consumer products………….. 1,765 9,530 18.52%
*In € millions
The professional products department has the highest profit margin.
(2) Investment turnover = Sales/Average invested assets
Investment center
Sales*
Avg. assets* Investment
turnover
Professional products..…..... €2,717 €2,570 1.06
Consumer products………….. 9,530 5,745 1.66
*In € millions. Avg. assets = Beginning assets plus ending assets, divided by two.
Note: Profit margin and investment turnover amounts are rounded to two decimal places.
The Active cosmetics department has the highest investment turnover.
PROBLEM SET A
Problem 24-1A (50 minutes)
Part 1
a.
24-1425
Education.
Chapter 24 – Performance Measurement and Responsibility Accounting
Responsibility Accounting Performance Report
Dept. Manager, Camper Department
For the Year
Budgeted Actual Over (Under)
Amount Amount Budget
Controllable Costs
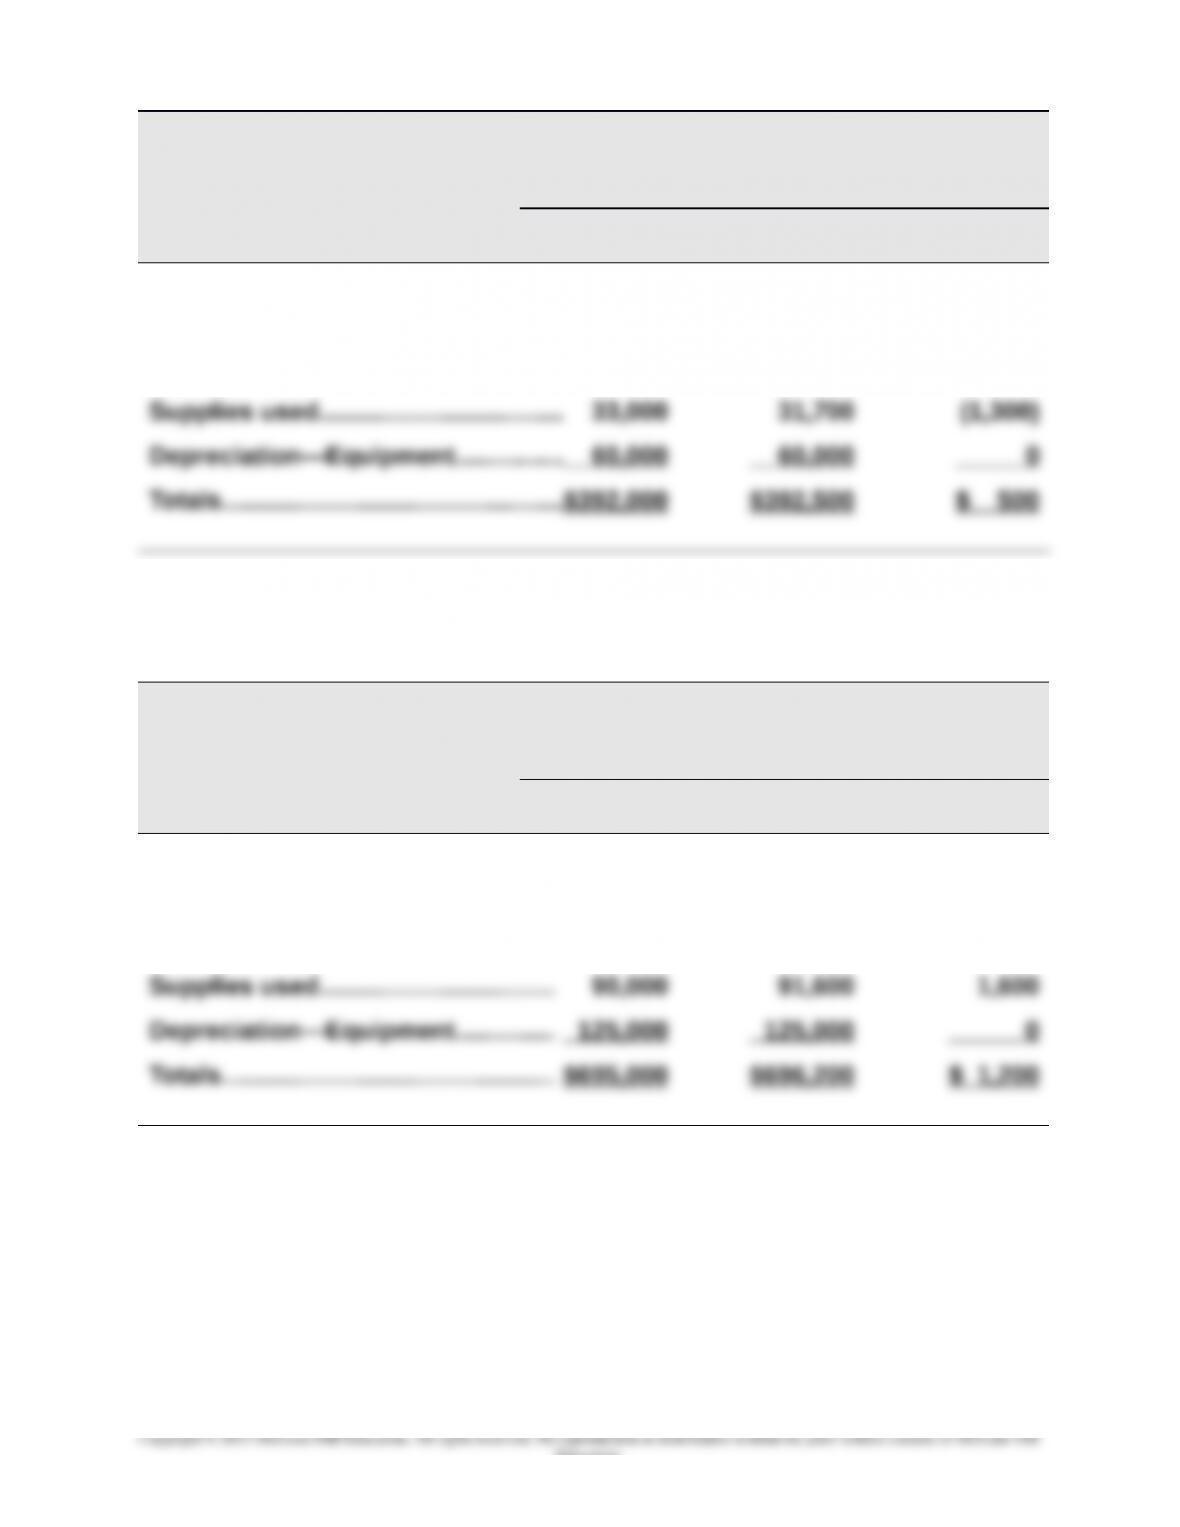
Raw materials……………………………..$195,000 $194,200 $ (800)
Employee wages………………………… 104,000 106,600 2,600
b.
Responsibility Accounting Performance Report
Dept. Manager, Trailer Department
For the Year
Budgeted Actual Over (Under)
Amount Amount Budget
Controllable Costs
Raw materials………………………..….. $275,000 $273,200 $(1,800)
Employee wages……………..………… 205,000 206,400 1,400
24-1426
Education.
Chapter 24 – Performance Measurement and Responsibility Accounting
Problem 24-1A (Continued)
c.
Responsibility Accounting Performance Report
Plant Manager, Indiana Plant
For the Year
Budgeted Actual Over (Under)
Amount Amount Budget
Controllable Costs
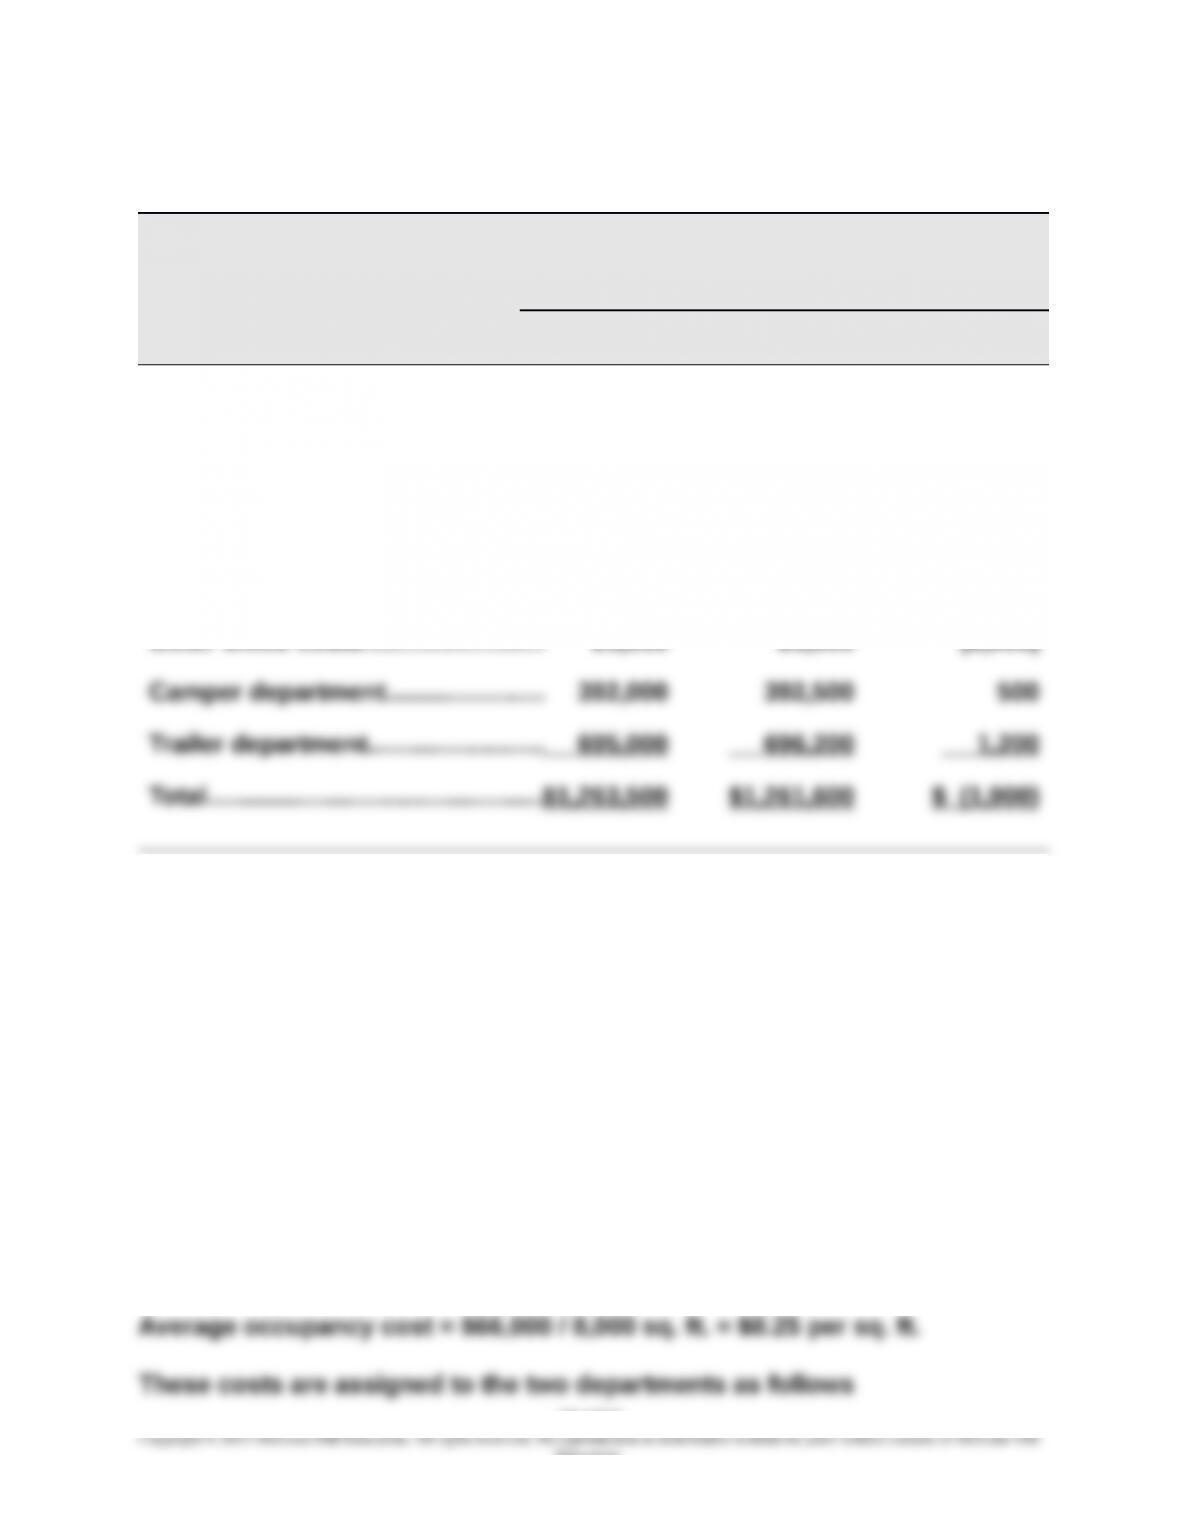
Dept. manager salaries….…..........$ 95,000 $ 97,500 $ 2,500
Utilities…………………………………….. 9,000 8,300 (700)
Building rent….………………………... 15,000 14,000 (1,000)
Other office salaries…..…………….. 32,500 30,100 (2,400)
Other office costs…………………….. 25,000 23,000 (2,000)
Part 2
The plant manager did a better job of controlling costs and meeting the
budget. She came in under budget for the plant even though she paid the
department managers more than budgeted and had to absorb the amounts
over budget in their departments. This is because she spent less than the
budget amount on utilities, building rent, other office salaries, and other
office costs. Each of the department managers came in over budget.
Problem 24-2A (60 minutes)
Part 1
24-1427
Education.
Chapter 24 – Performance Measurement and Responsibility Accounting
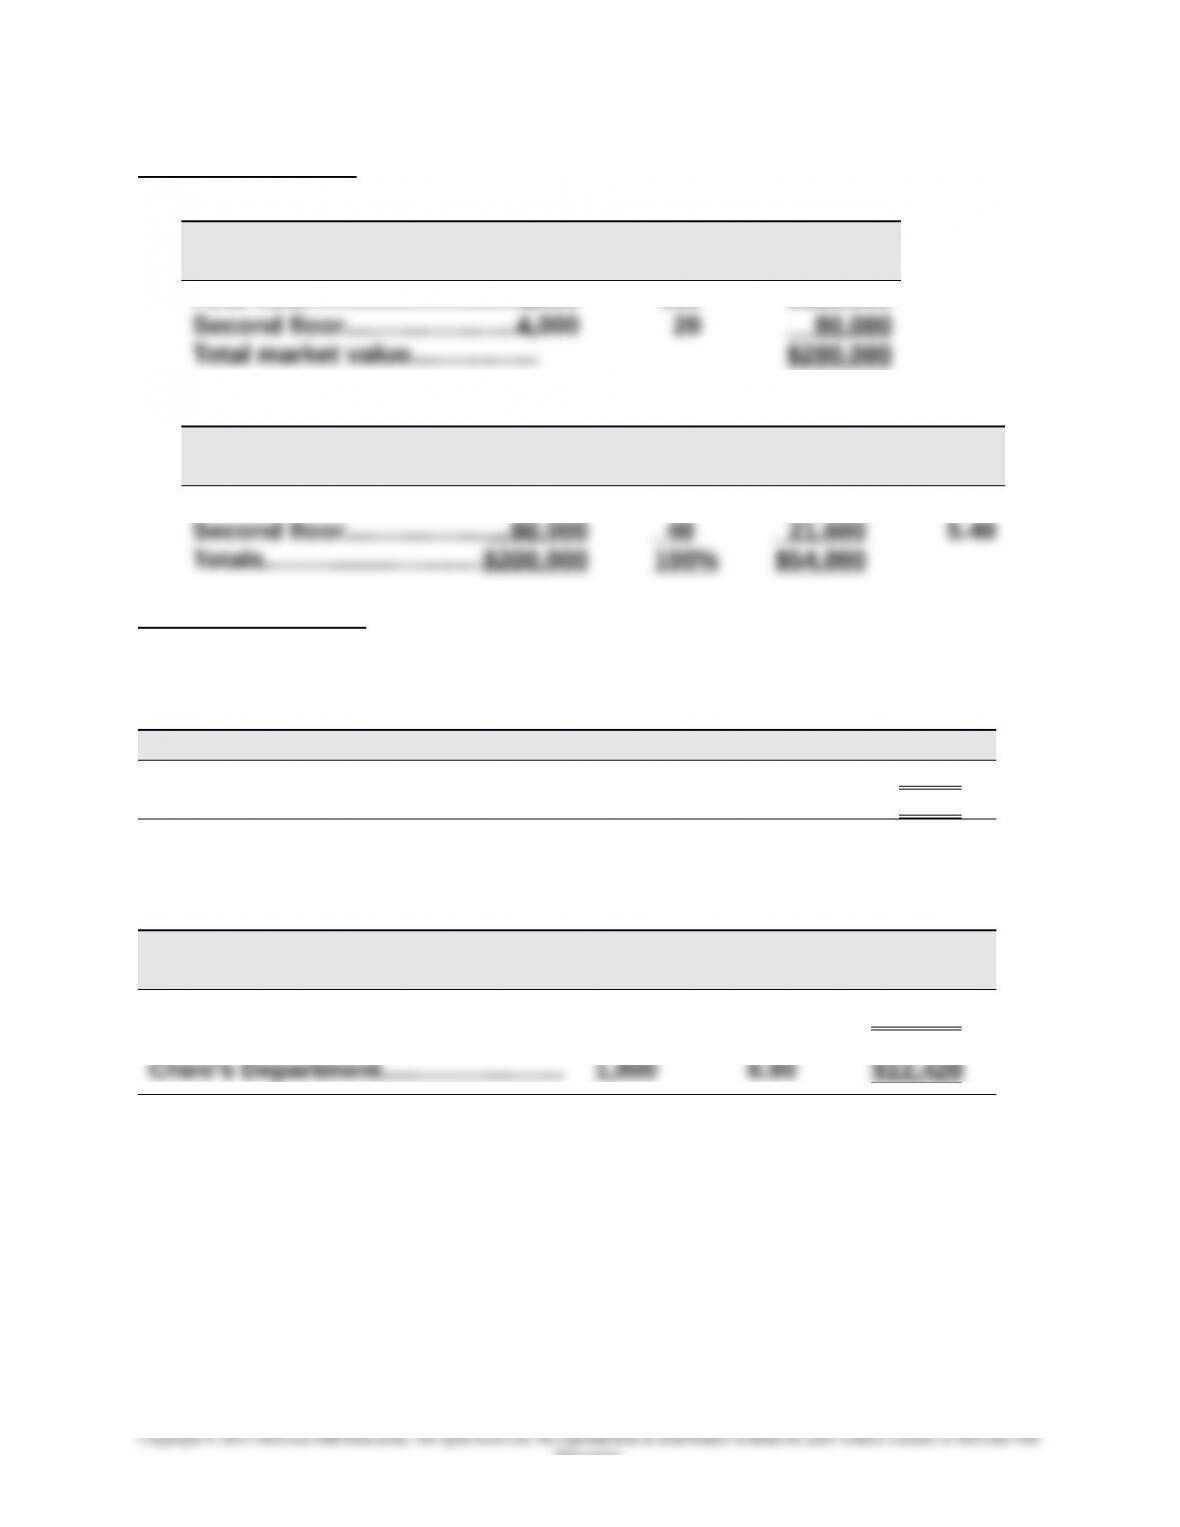
Department Square Footage Rate Total
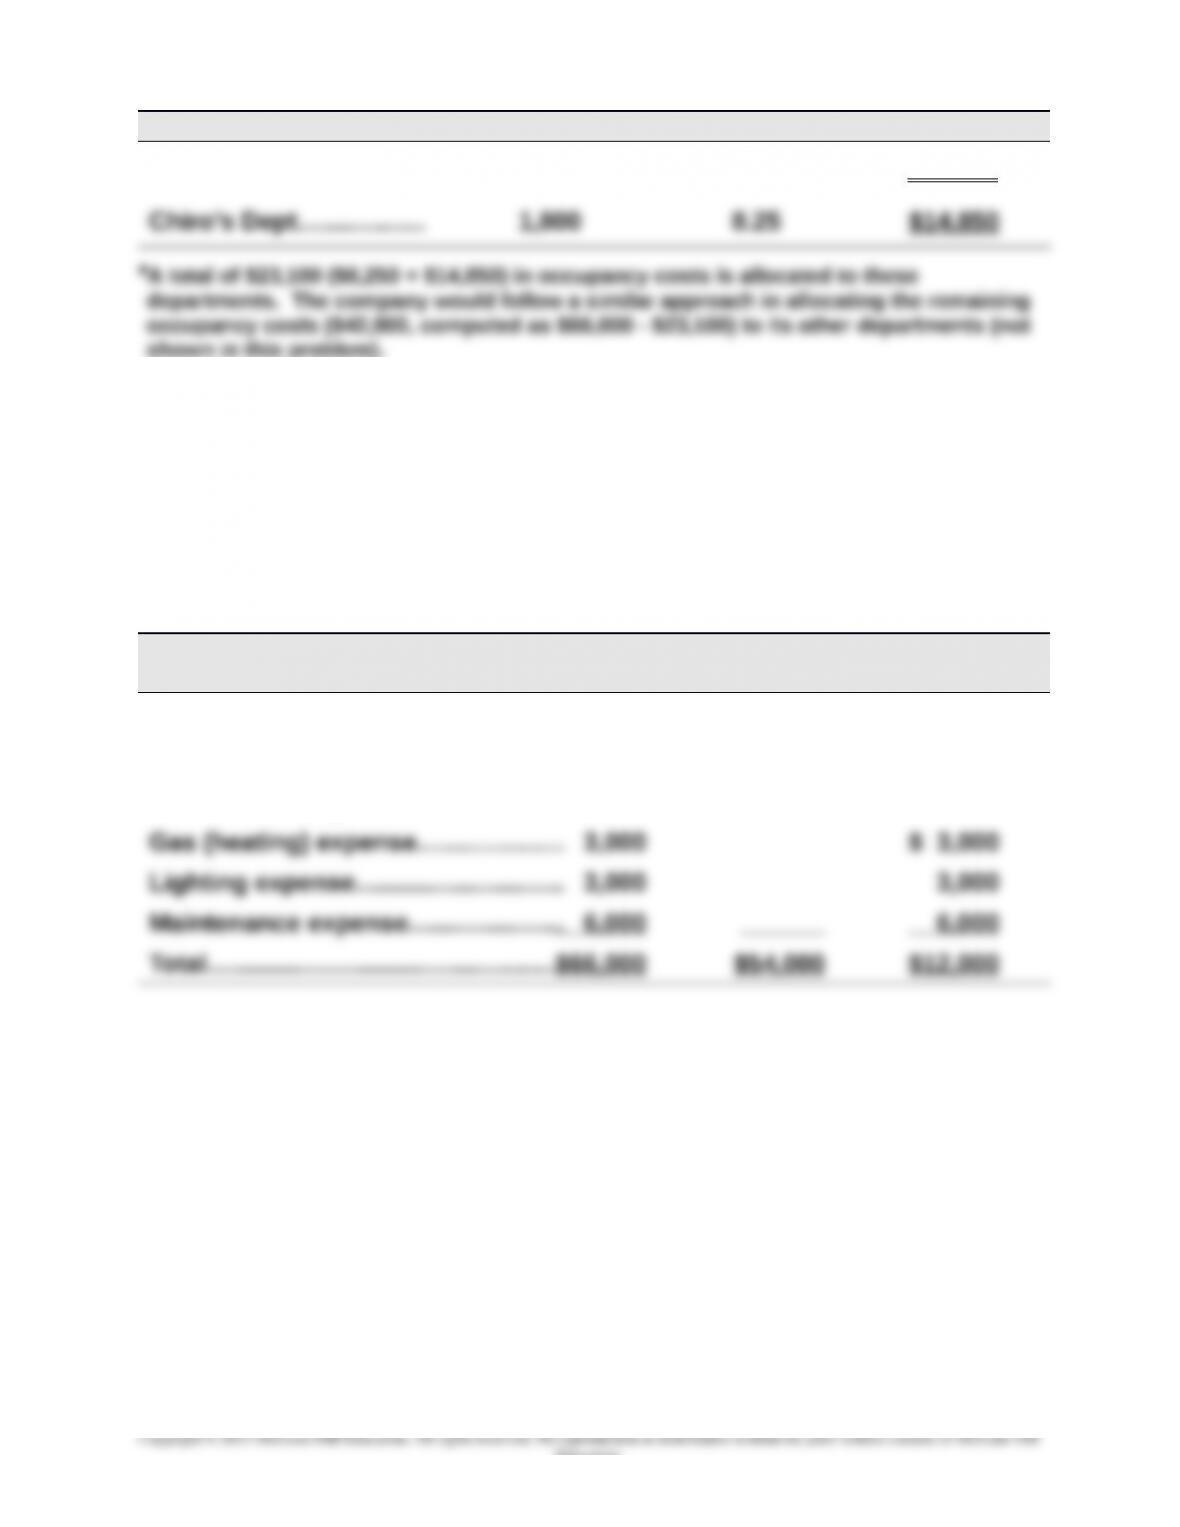
Linder’s Dept…............. 1,000 $8.25 $ 8,250
Part 2
Market rates are used to allocate occupancy costs for depreciation,
interest, and taxes. Heating, lighting, and maintenance costs are allocated
to the departments on both floors at the average rate per square foot.
These costs are separately assigned to each class as follows:
Total
Costs
Value-Based
Costs
Usage-Based
Costs
Depreciation—Building………………..$18,000 $18,000
Interest—Building mortgage..…...... 27,000 27,000
Taxes—Building and land………….... 9,000 9,000
24-1428
Education.
Chapter 24 – Performance Measurement and Responsibility Accounting
Problem 24-2A (Continued)
Value-based costs are allocated to departments in two steps
(i) Compute market value of each floor
Floor
Square
Footage
Value per
Sq. Ft. Total
First floor………………………..….4,000 $30 $120,000
(ii) Allocate $54,000 to each floor based on its percent of market value
Floor
Market
Value
% of
Total
Allocated
Cost
Cost per
Sq. Ft.
First floor………………………..….$120,000 60% $32,400 $8.10
Usage-based costs allocation rate = $12,000 / 8,000 sq. ft.
= $1.50 per sq. ft.
We can then compute total allocation rates for the floors
Floor Value Usage Total
First floor…………………………… $8.10 $1.50 $9.60
Second floor….……………........ 5.40 1.50 $6.90
These rates are applied to allocate occupancy costs to departments
Department
Square
Footage Rate Total
Linder’s Department….……………….. 1,000 $9.60 $ 9,600
Chiro’s Department…………………….. 1,800 6.90 $12,420
Part 3
A second-floor manager would prefer allocation based on market value. This is a
reasonable and logical approach to allocation of occupancy costs. The current
method implies all square footage has equal value. This is not logical for this
type of occupancy. It also means the second-floor space would be allocated a
larger portion of costs under the current method, but less using an allocation
based on market value.
Problem 24-3A (70 minutes)
24-1429
Education.
Chapter 24 – Performance Measurement and Responsibility Accounting
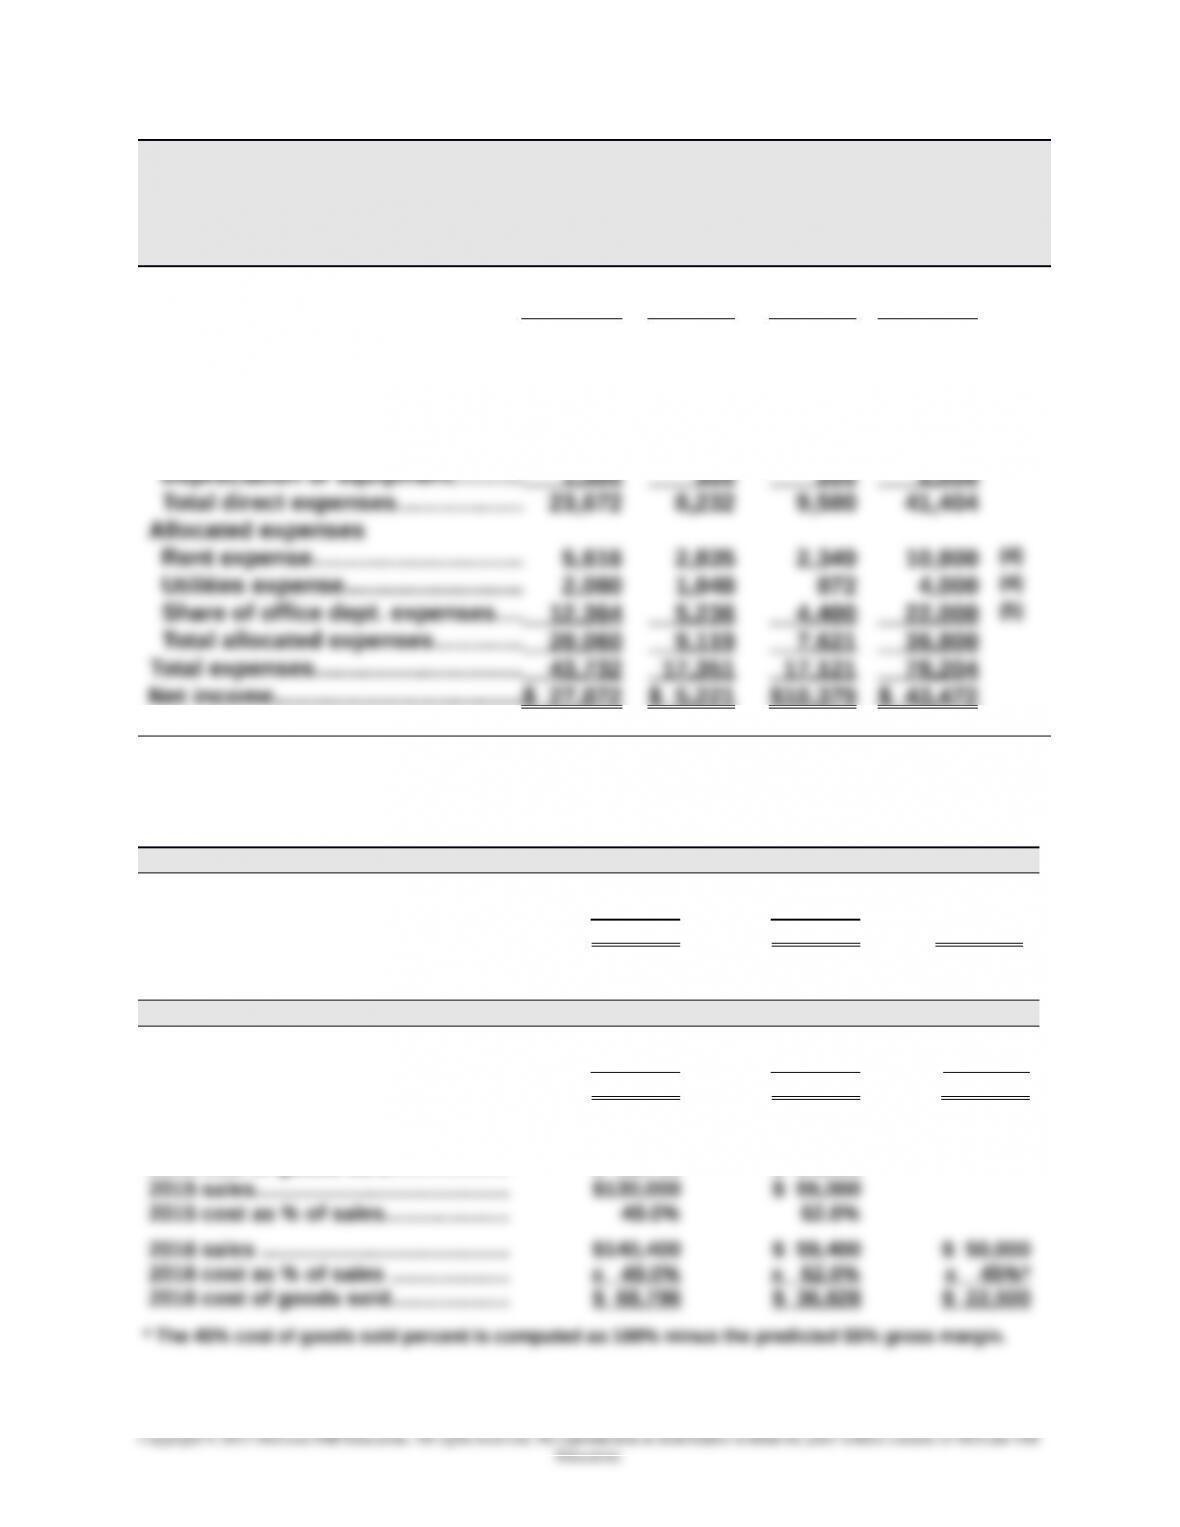
Williams Company
Forecasted Departmental Income Statements
For Year Ended December 31, 2016
Clock Mirror Paintings Combined
Sales…..………………………………..…...$140,400 $59,400 $50,000 $249,800 (1)
Cost of goods sold……..….….......... 68,796 36,828 22,500 128,124 (2)
Gross profit………..………………..….... 71,604 22,572 27,500 121,676
Direct expenses
Sales salaries………………………….. 20,000 7,000 8,000 35,000
Advertising………..………………..…… 1,200 500 800 2,500
Store supplies used…………………. 972 432 500 1,904 (3)
Supporting Computations—coded (1) through (5) in statement above
Note 1 (Sales)
Clock Mirror Paintings
2015 sales…………………..................... $130,000 $ 55,000
Growth rate (8% increase)................ x 108% x 108%
2016 sales…………………..................... $140,400 $ 59,400 $ 50,000
Note 2 (Cost of Goods Sold)
Clock Mirror Paintings
2015 cost of goods sold................... $ 63,700 $ 34,100 $ 50,000
Growth rate (8% increase)................ x 108% x 108% x 45%*
2016 cost of goods sold................... $ 68,796 $ 36,828 $ 22,500
ALTERNATIVELY
2015 cost of goods sold................... $ 63,700 $ 34,100
24-1430
Chapter 24 – Performance Measurement and Responsibility Accounting
Problem 24-3A (Continued)
Note 3 (Store Supplies Used)
Clock Mirror Paintings
2015 store supplies used …….............. $ 900 $ 400
Growth rate (8% increase)…………….…. x 108% x 108%
2016 store supplies ……….……..….…..… $ 972 $ 432 $ 500
Note 4 (Rent and Utilities)
Clock Mirror Paintings
2015 rent …….………………………………….. $ 7,020 $ 3,780
One-fifth from clock to paintings……… (1,404) $ 1,404
One-fourth from mirror to
paintings……..…………………………………. ______ (945) 945
†Adjusted to eliminate rounding difference.
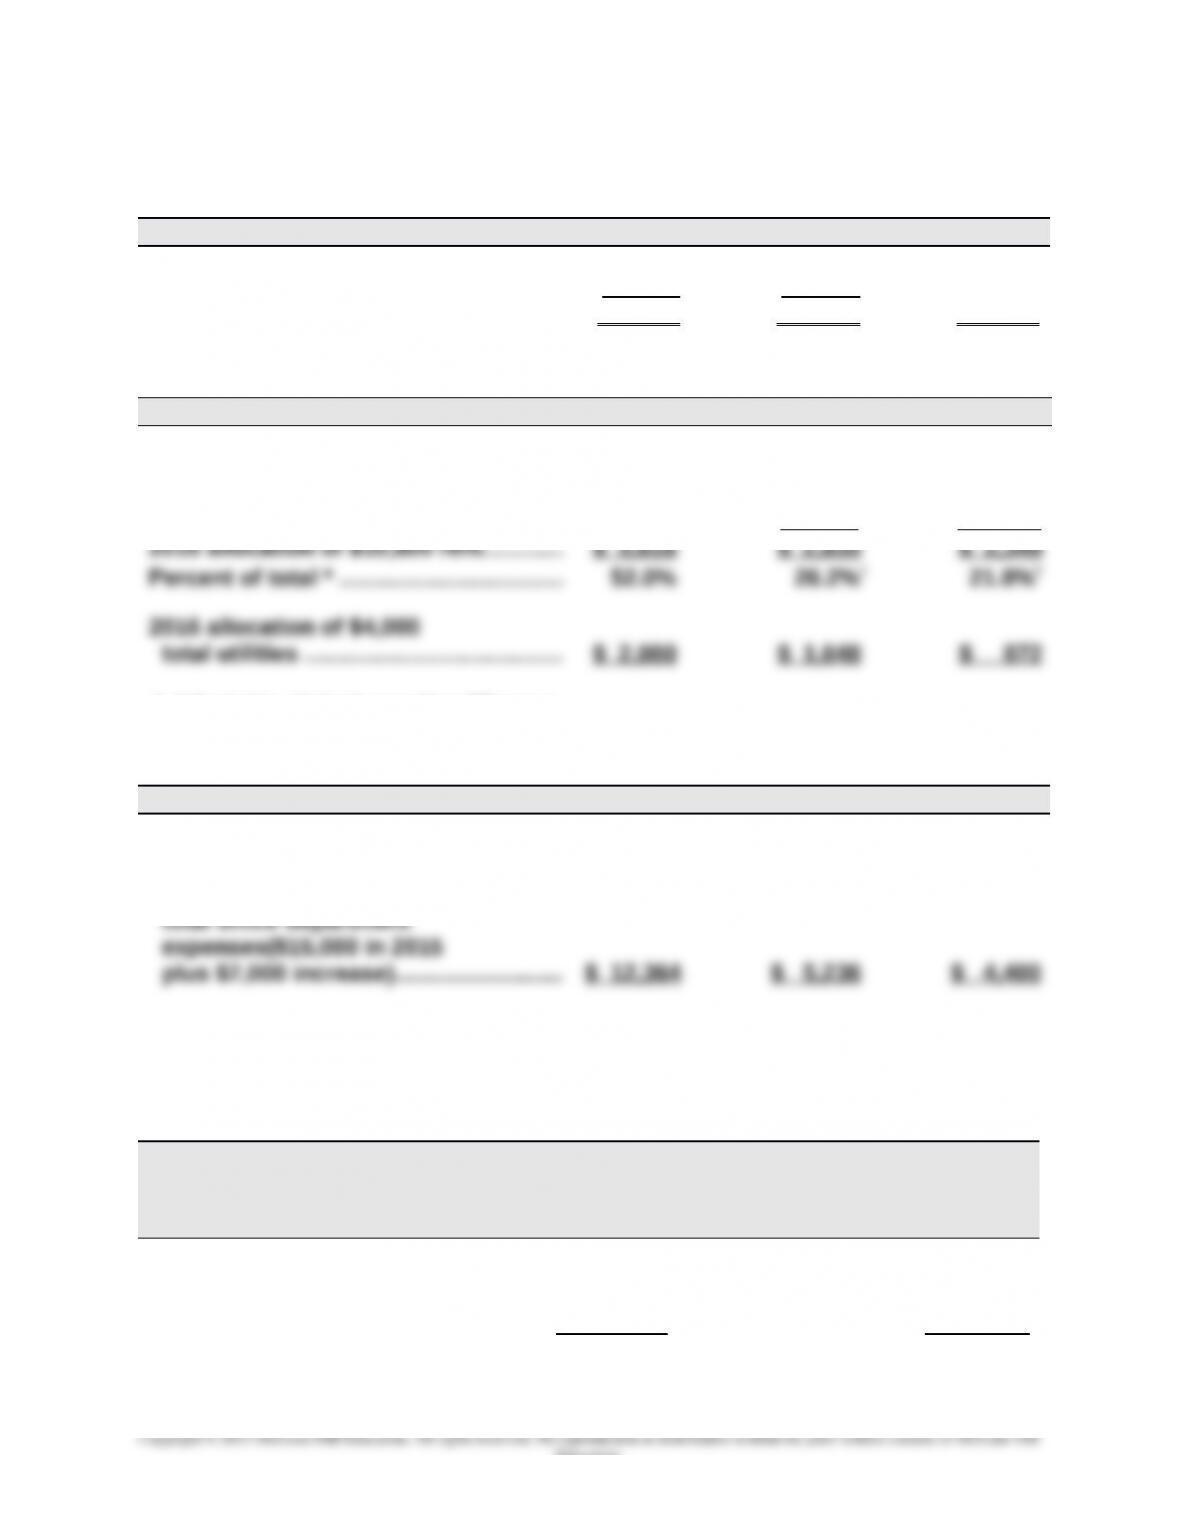
Note 5 (Office Department Expenses)
Clock Mirror Paintings
2015 sales …………..…..….…..….…..….…. $140,400 $ 59,400 $ 50,000
Percent of total sales *………..…………… 56.2% 23.8% 20.0%
2016 allocation of $22,000
* Instructor note: If students round to something other than one-tenth of a percent, their
numbers will slightly vary.
Problem 22-4A (45 minutes)
Part 1
VORTEX COMPANY
Departmental Contribution Statements
Dept. A Dept. B
Sales…………………..…………….. $800,000 $450,000
Cost of goods sold……..……… 497,000 291,000
Gross profit……………….………. 303,000 159,000
24-1431
Education.
Chapter 24 – Performance Measurement and Responsibility Accounting
Direct expenses
Total direct expenses.………… 197,000 129,000
Departmental contributions to
overhead………………………....
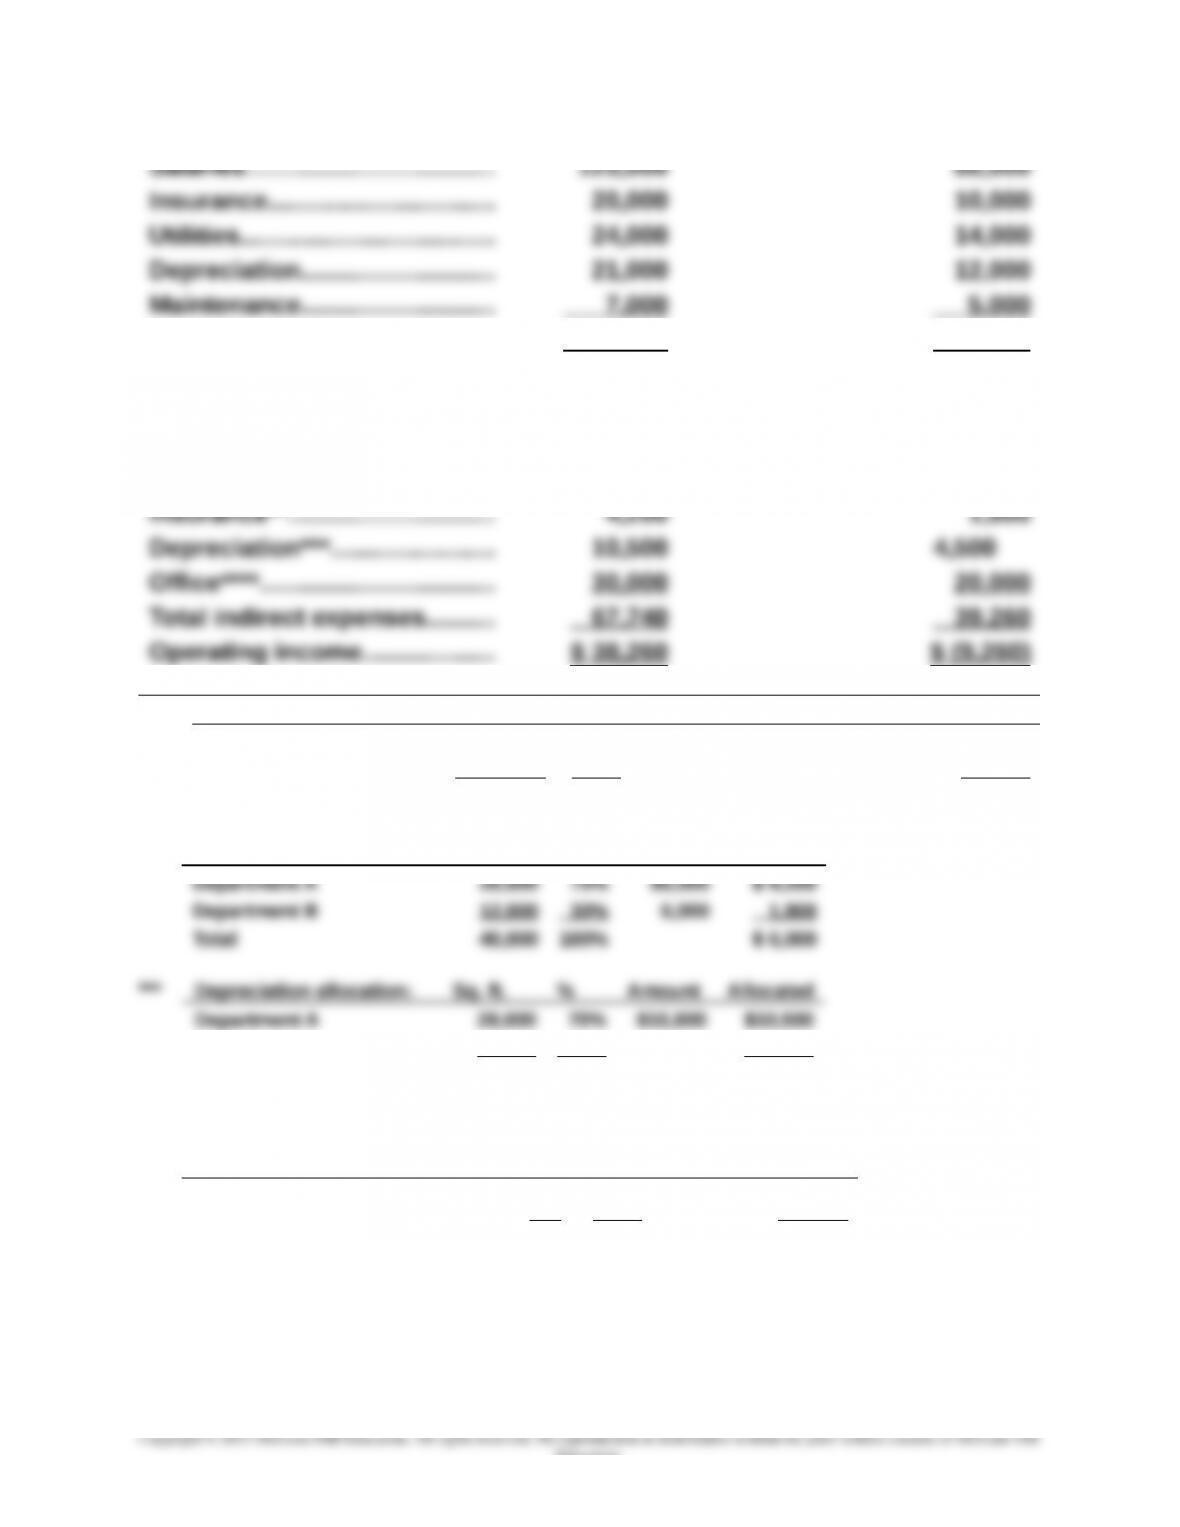
Allocated indirect expenses
106,000 30,000
Salaries*……….…………………… 23,040 12,960
*Salaries allocation: Sales % Amount Allocated
Department A $ 800,000 64% $36,000 $23,040
Department B 450,000 36% 36,000 12,960
Total $1,250,000 100% $36,000
** Insurance allocation: Sq. ft. % Amount Allocated
Department B 12,000 30% 15,000 4,500
Total 40,000 100% $15,000
Problem 22-4A (Concluded)
**** Office expense allocation: Employees % Amount Allocated
Department A 75 60% $50,000 $30,000
Department B 50 40% 50,000 20,000
Total 125 100% $50,000
Part 2
Although Department B has a negative departmental income, it is
24-1432
Education.
Chapter 24 – Performance Measurement and Responsibility Accounting
contributing $30,000 to overhead. If none of the indirect expenses can be
reduced by eliminating Department B, then eliminating it would not be a
good idea. Overall company income will be reduced by $30,000. It is
24-1433