Problem 24-1A (Continued)
c.
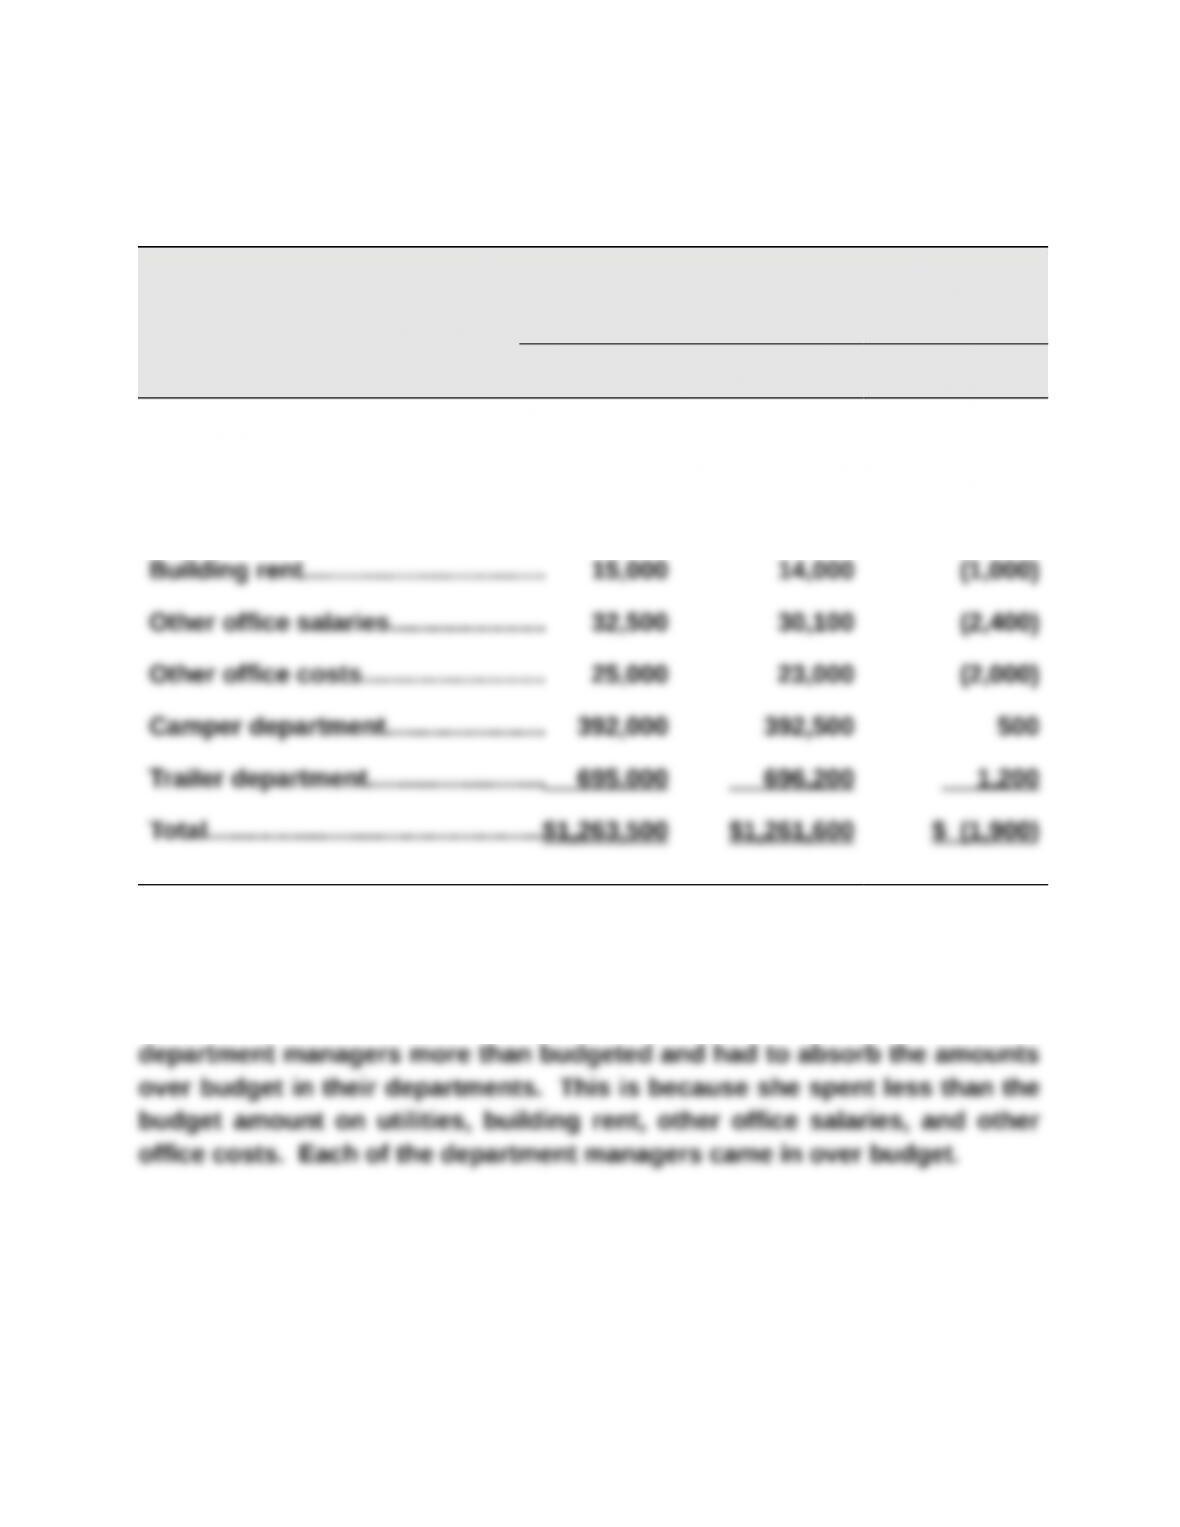
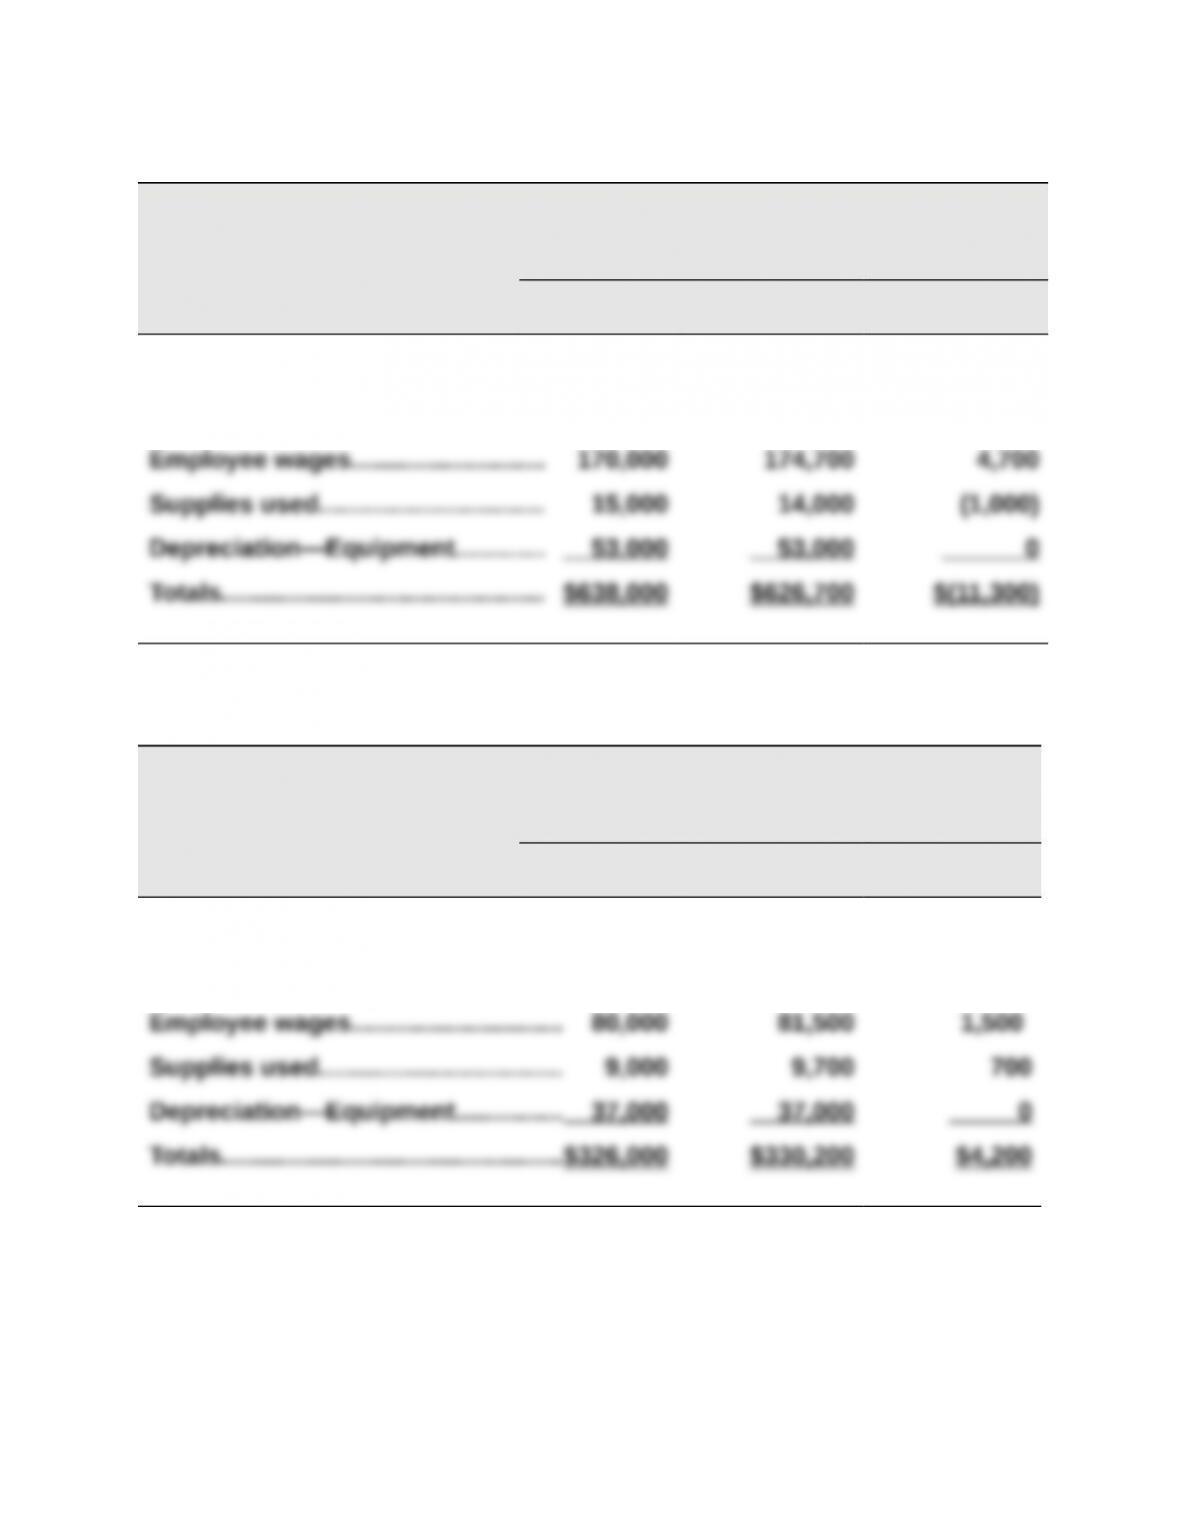
Responsibility Accounting Performance Report
Plant Manager, Indiana Plant
For the Year
Budgeted Actual Over (Under)
Amount Amount Budget
Controllable Costs
Dept. manager salaries……………..$ 95,000 $ 97,500 $ 2,500
Utilities……………………………………. 9,000 8,300 (700)
Part 2
The plant manager did a better job of controlling costs and meeting the
budget. She came in under budget for the plant even though she paid the
Problem 24-2A (60 minutes)
Part 1
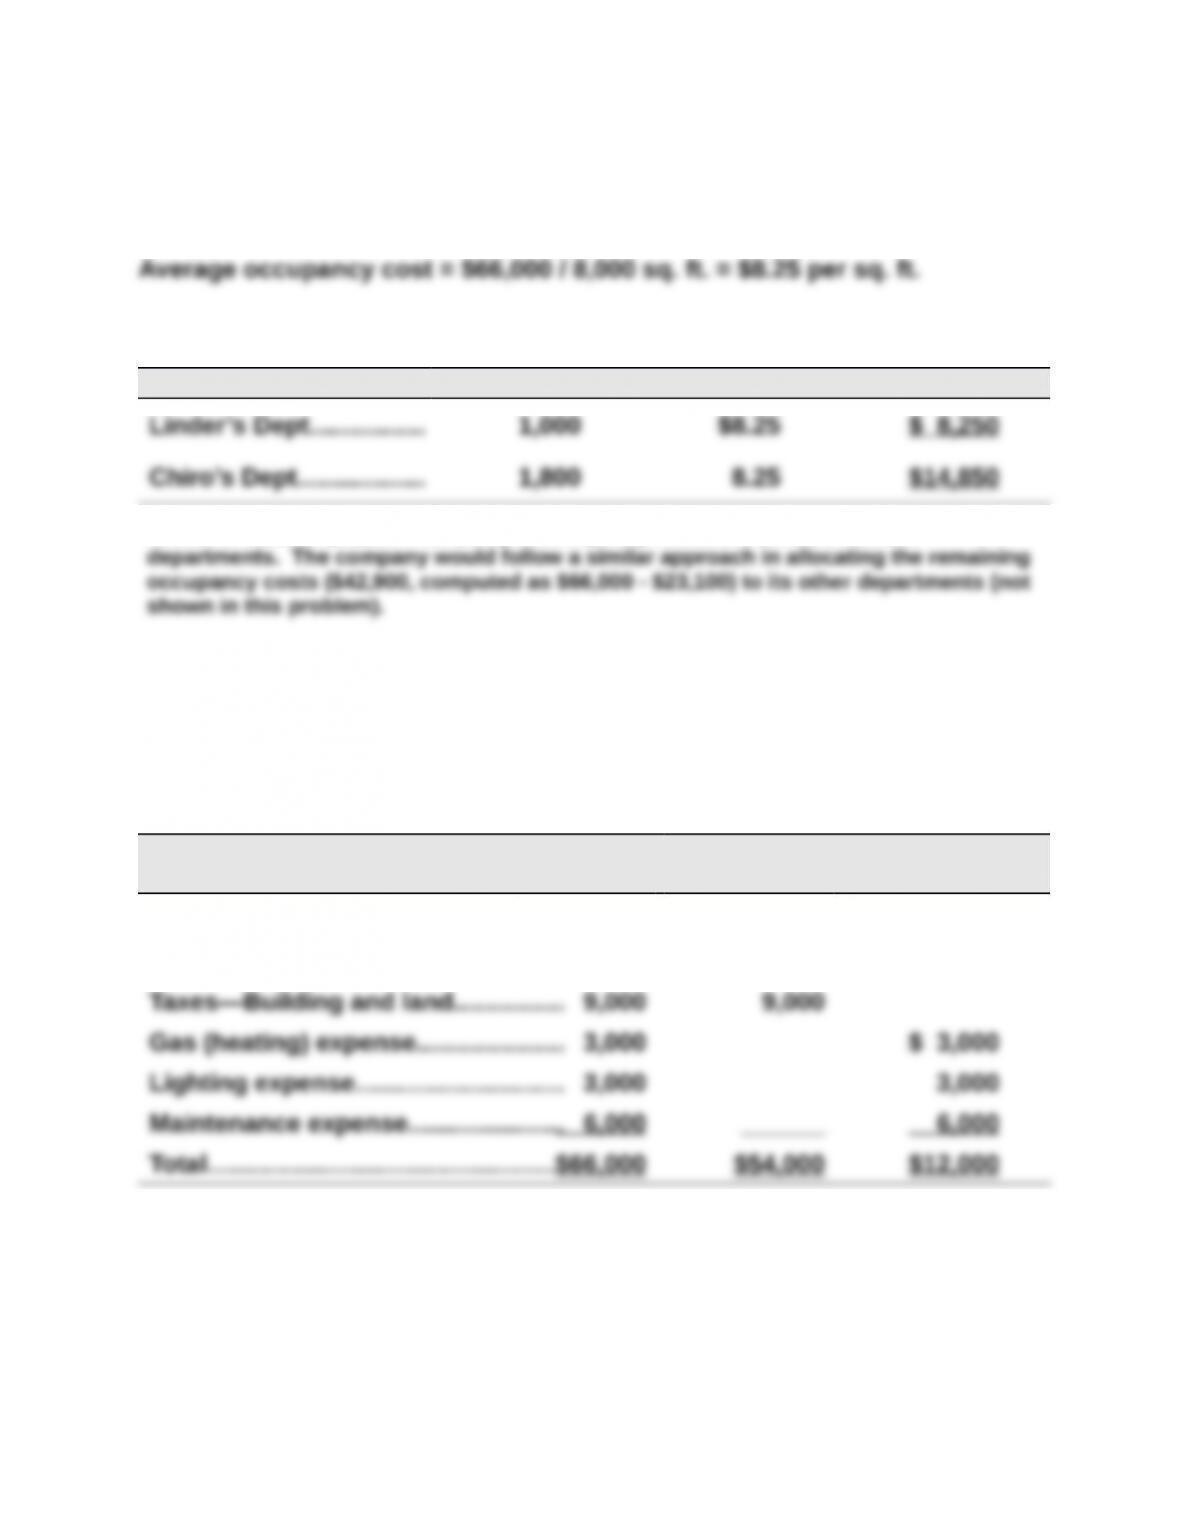
These costs are assigned to the two departments as follows
Department Square Footage Rate Total
*A total of $23,100 ($8,250 + $14,850) in occupancy costs is allocated to these
Part 2
Market rates are used to allocate occupancy costs for depreciation, interest, and taxes. Heating, lighting,
and maintenance costs are allocated to the departments on both floors at the average rate per square
foot. These costs are separately assigned to each class as follows:
Total
Costs
Value-Based
Costs
Usage-Based
Costs
Depreciation—Building……………….$18,000 $18,000
Interest—Building mortgage……….. 27,000 27,000
Problem 24-2A (Continued)
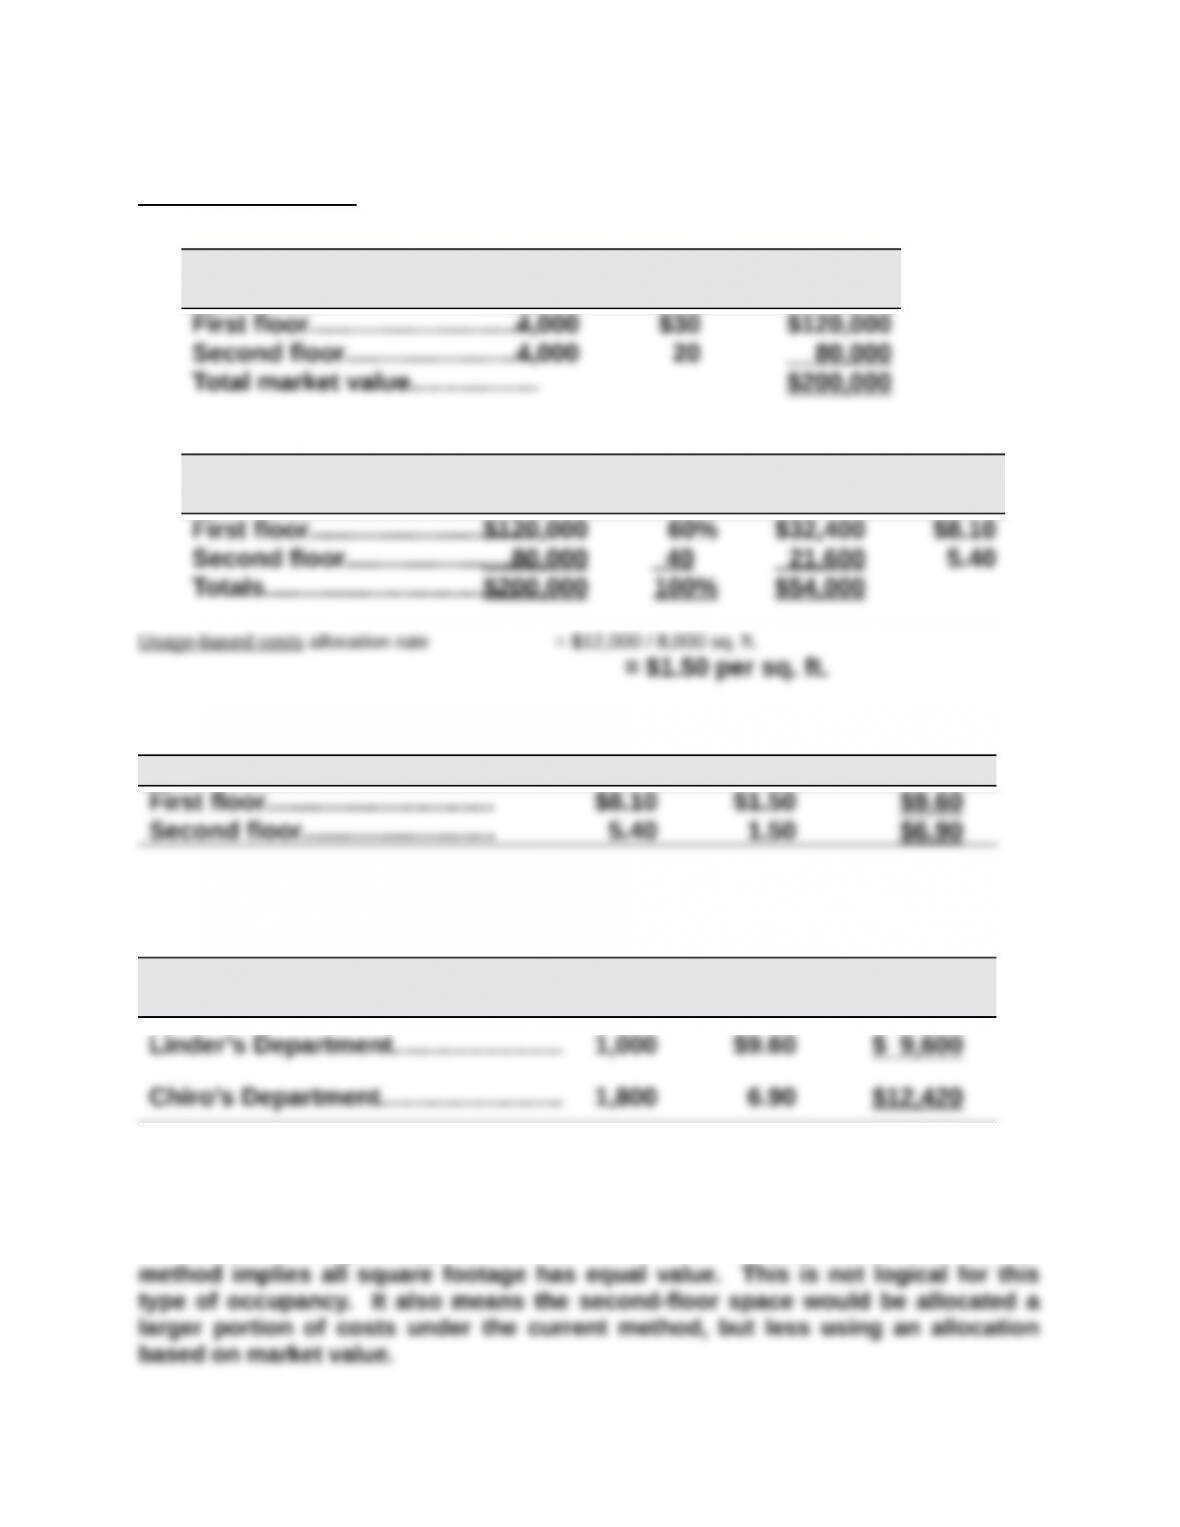
Value-based costs are allocated to departments in two steps
(i) Compute market value of each floor
Floor
Square
Footage
Value per
Sq. Ft. Total
(ii) Allocate $54,000 to each floor based on its percent of market value
Floor
Market
Value
% of
Total
Allocated
Cost
Cost per
Sq. Ft.
We can then compute total allocation rates for the floors
Floor Value Usage Total
These rates are applied to allocate occupancy costs to departments
Department
Square
Footage Rate Total
Part 3
A second-floor manager would prefer allocation based on market value. This is a
reasonable and logical approach to allocation of occupancy costs. The current
Problem 24-3A (70 minutes)
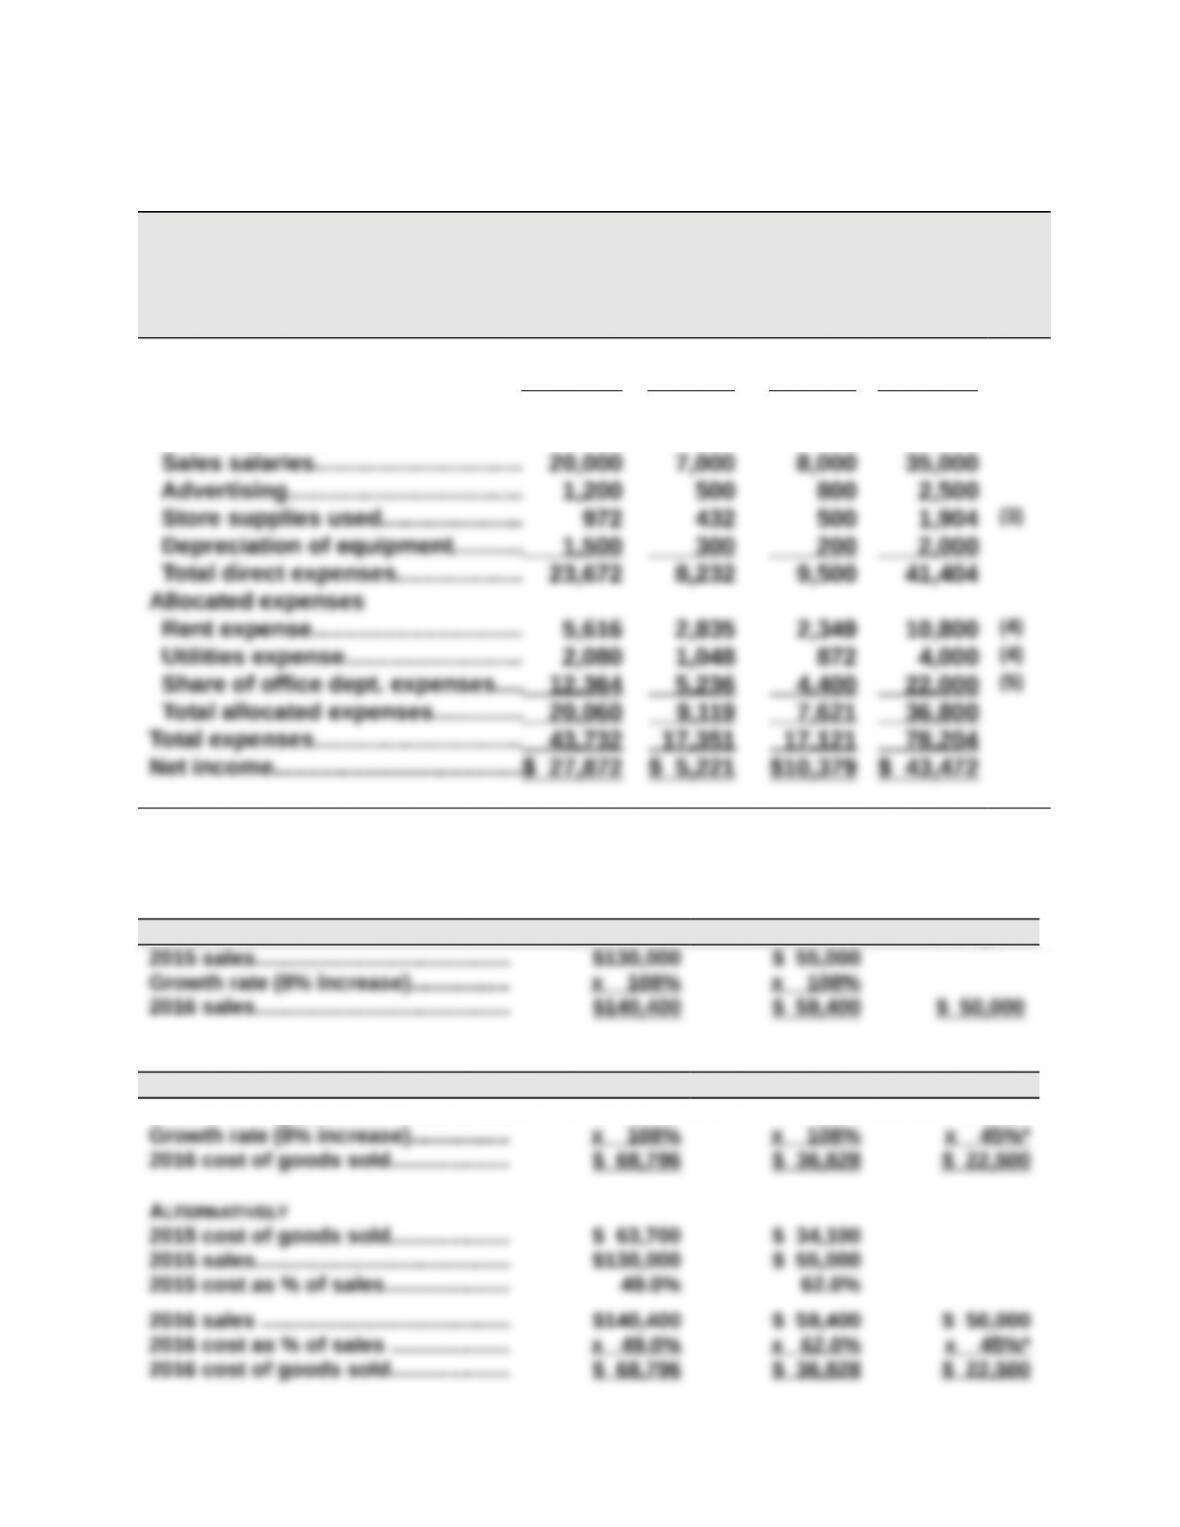
Williams Company
Forecasted Departmental Income Statements
For Year Ended December 31, 2016
Clock Mirror Paintings Combined
Sales………………………………………..$140,400 $59,400 $50,000 $249,800 (1)
Cost of goods sold……………………. 68,796 36,828 22,500 128,124 (2)
Gross profit……………………………… 71,604 22,572 27,500 121,676
Direct expenses
Supporting Computations—coded (1) through (5) in statement above
Note 1 (Sales)
Clock Mirror Paintings
Note 2 (Cost of Goods Sold)
Clock Mirror Paintings
2015 cost of goods sold……………….. $ 63,700 $ 34,100 $ 50,000
* The 45% cost of goods sold percent is computed as 100% minus the predicted 55% gross margin.
Problem 24-3A (Continued)
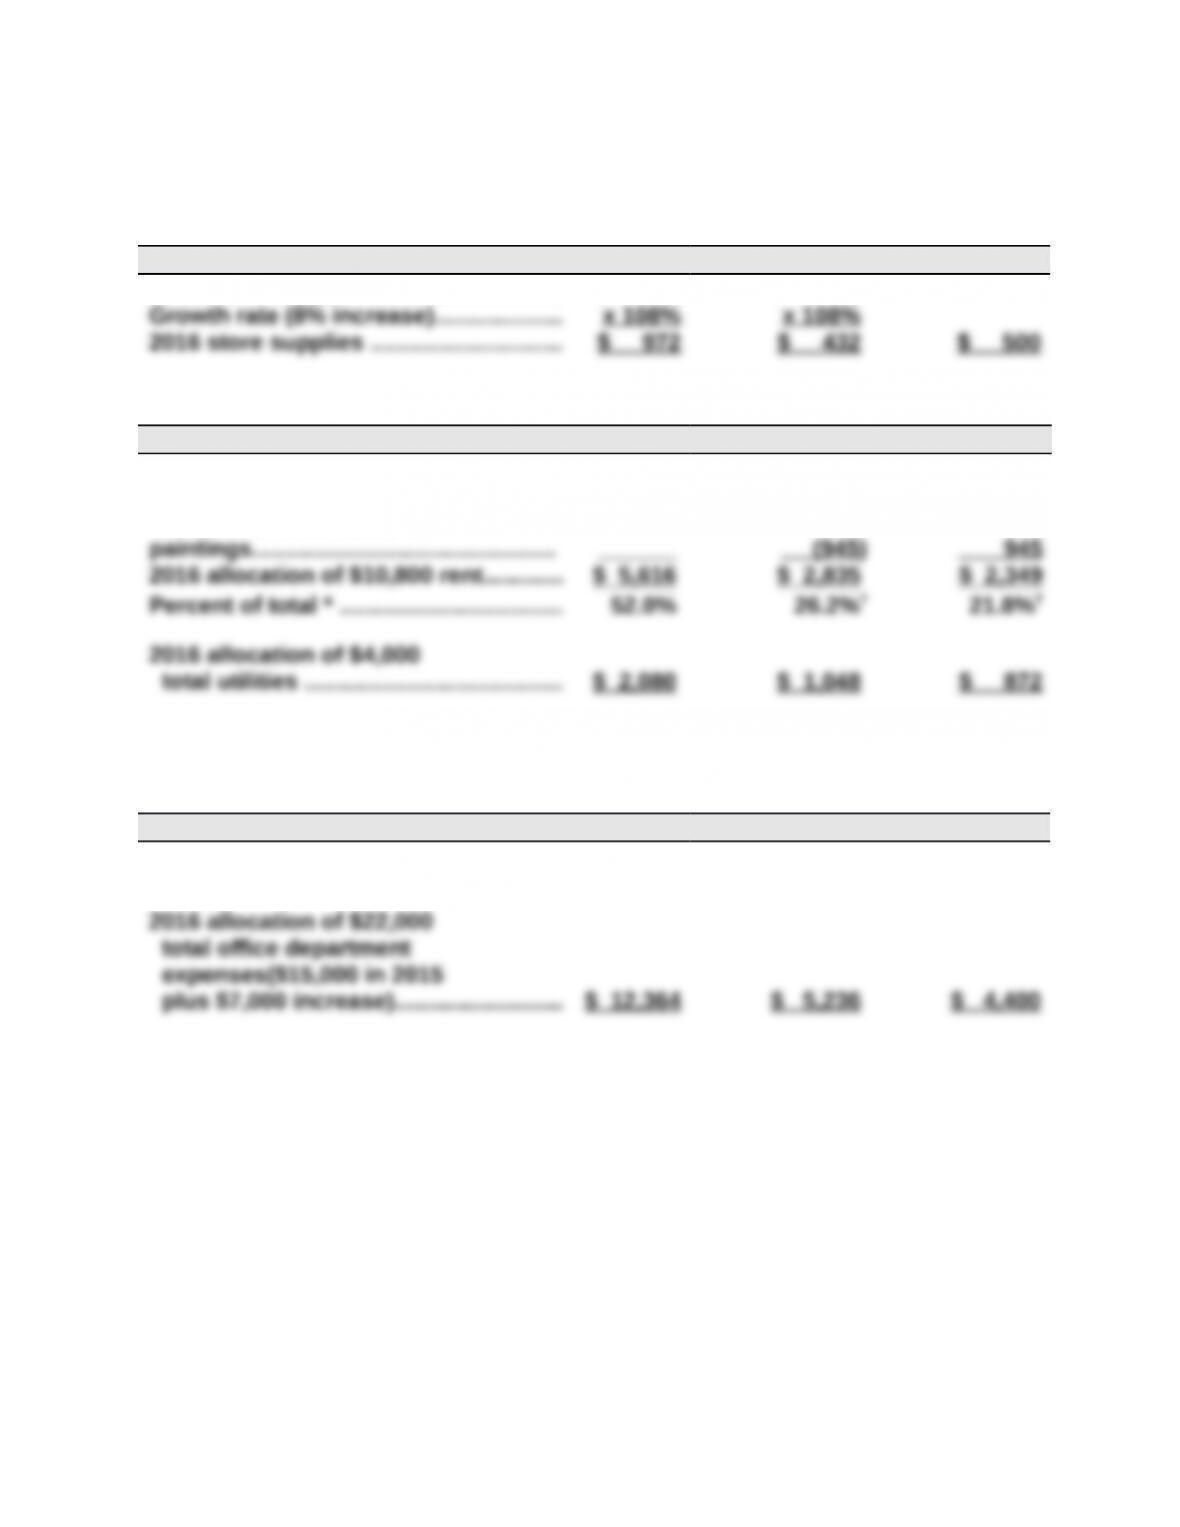
Note 3 (Store Supplies Used)
Clock Mirror Paintings
2015 store supplies used ……………….. $ 900 $ 400
Note 4 (Rent and Utilities)
Clock Mirror Paintings
2015 rent ………………………………………. $ 7,020 $ 3,780
One-fifth from clock to paintings…….. (1,404) $ 1,404
One-fourth from mirror to
†Adjusted to eliminate rounding difference.
Note 5 (Office Department Expenses)
Clock Mirror Paintings
2015 sales …………………………………….. $140,400 $ 59,400 $ 50,000
Percent of total sales *……………………. 56.2% 23.8% 20.0%
* Instructor note: If students round to something other than one-tenth of a percent, their
numbers will slightly vary.
Problem 22-4A (45 minutes)
Part 1
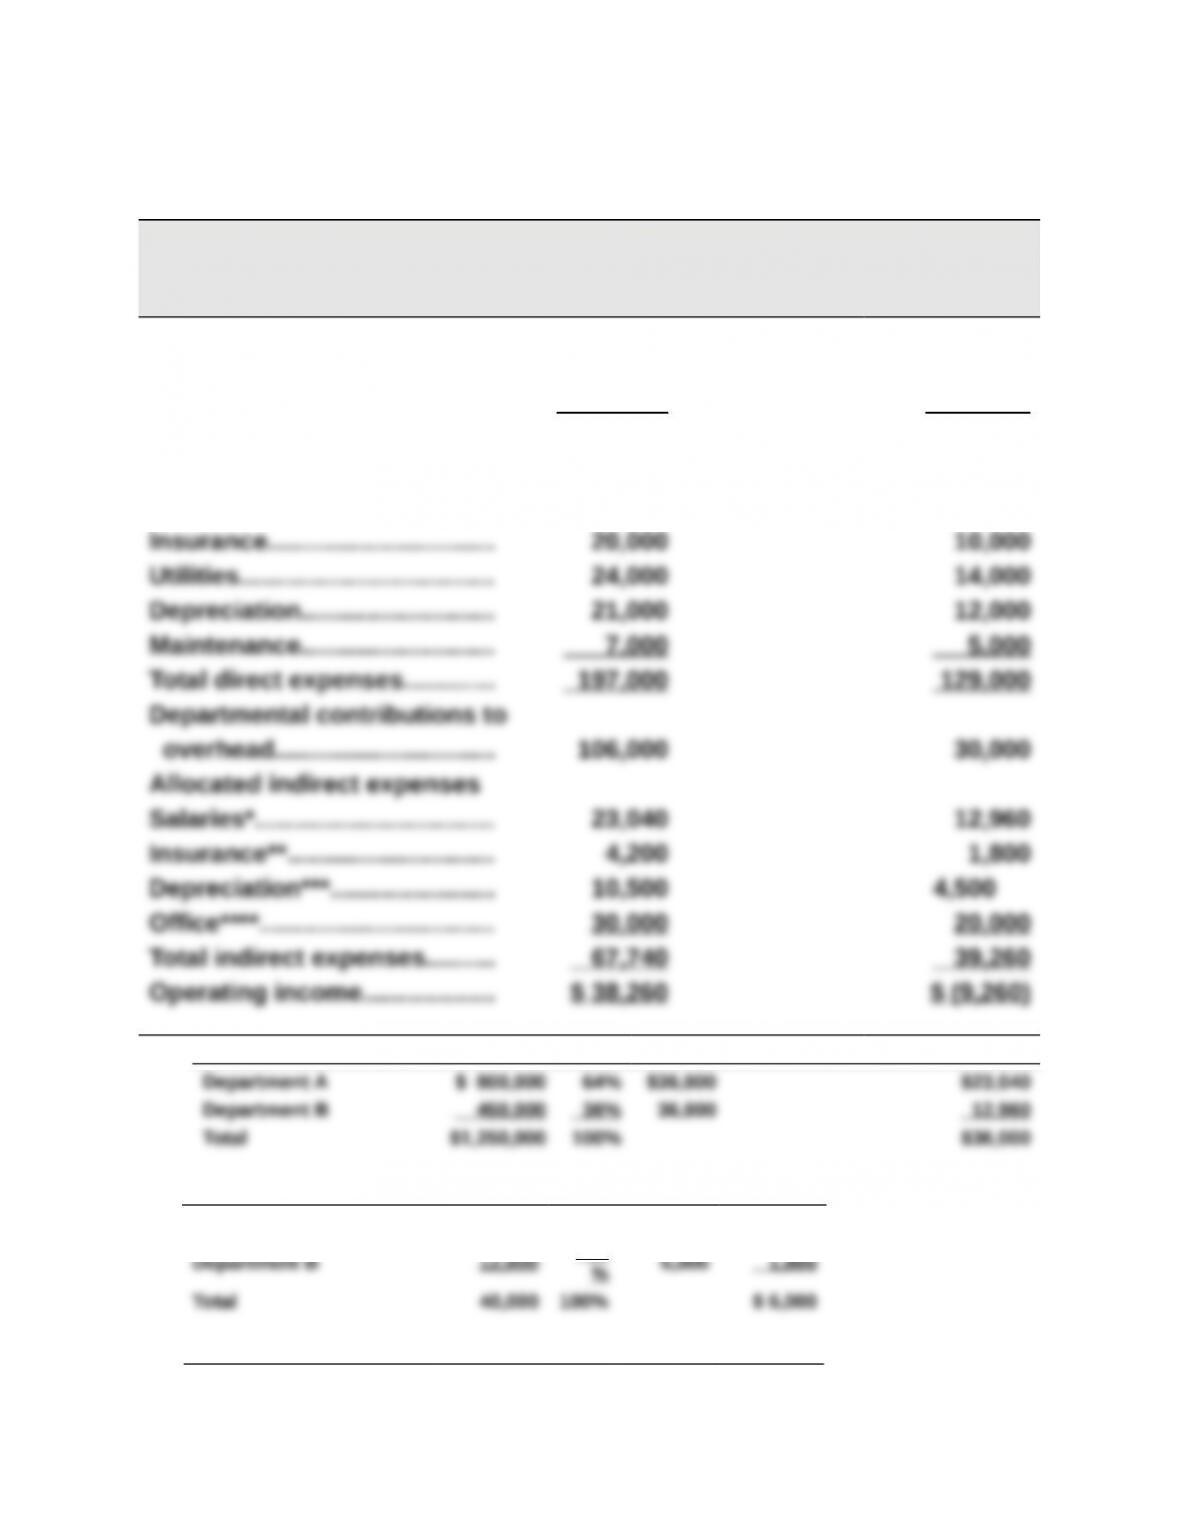
VORTEX COMPANY
Departmental Contribution Statements
Dept. A Dept. B
Sales………………………………… $800,000 $450,000
Cost of goods sold……………. 497,000 291,000
Gross profit………………………. 303,000 159,000
Direct expenses
Salaries…………………………….. 125,000 88,000
*Salaries allocation: Sales % Amount Allocated
** Insurance allocation: Sq. ft. % Amount Allocated
Department A 28,000 70% $6,000 $ 4,200
Department B 12,000 30
*** Depreciation allocation: Sq. ft. % Amount Allocated
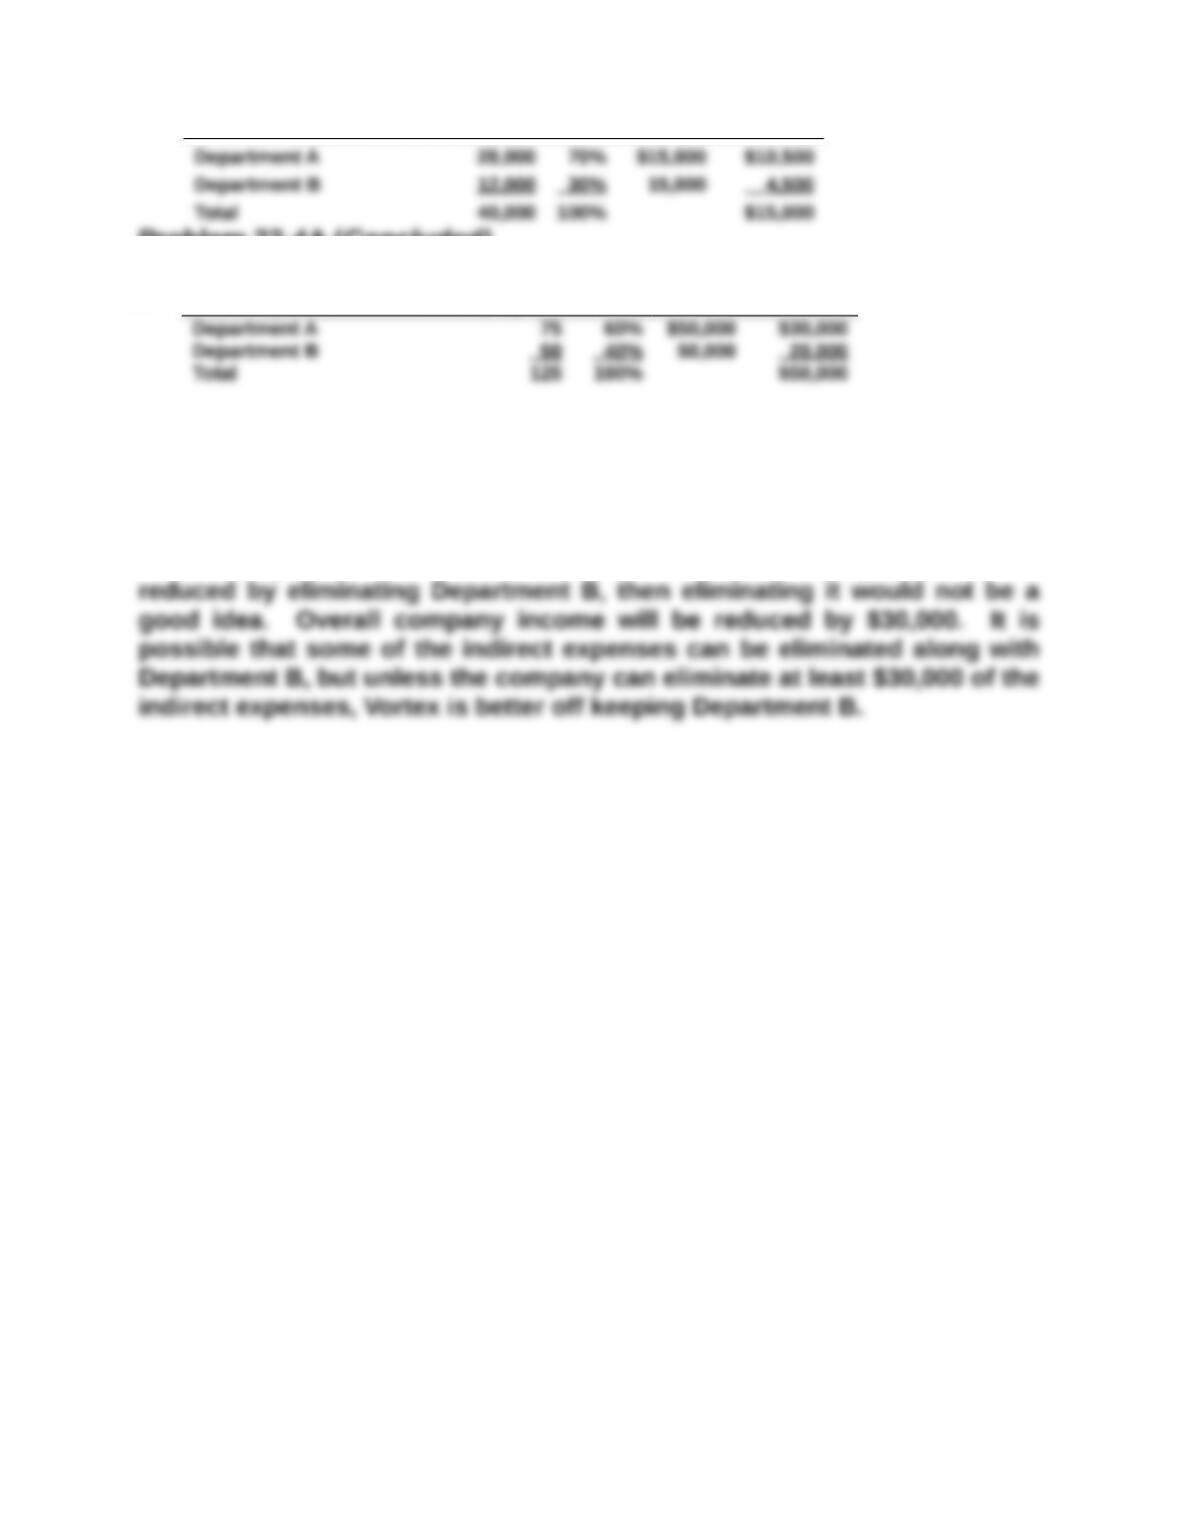
Problem 22-4A (Concluded)
**** Office expense allocation: Employees % Amount Allocated
Part 2
Although Department B has a negative departmental income, it is
contributing $30,000 to overhead. If none of the indirect expenses can be
P
Problem 24-5AB (60 minutes)
Part 1
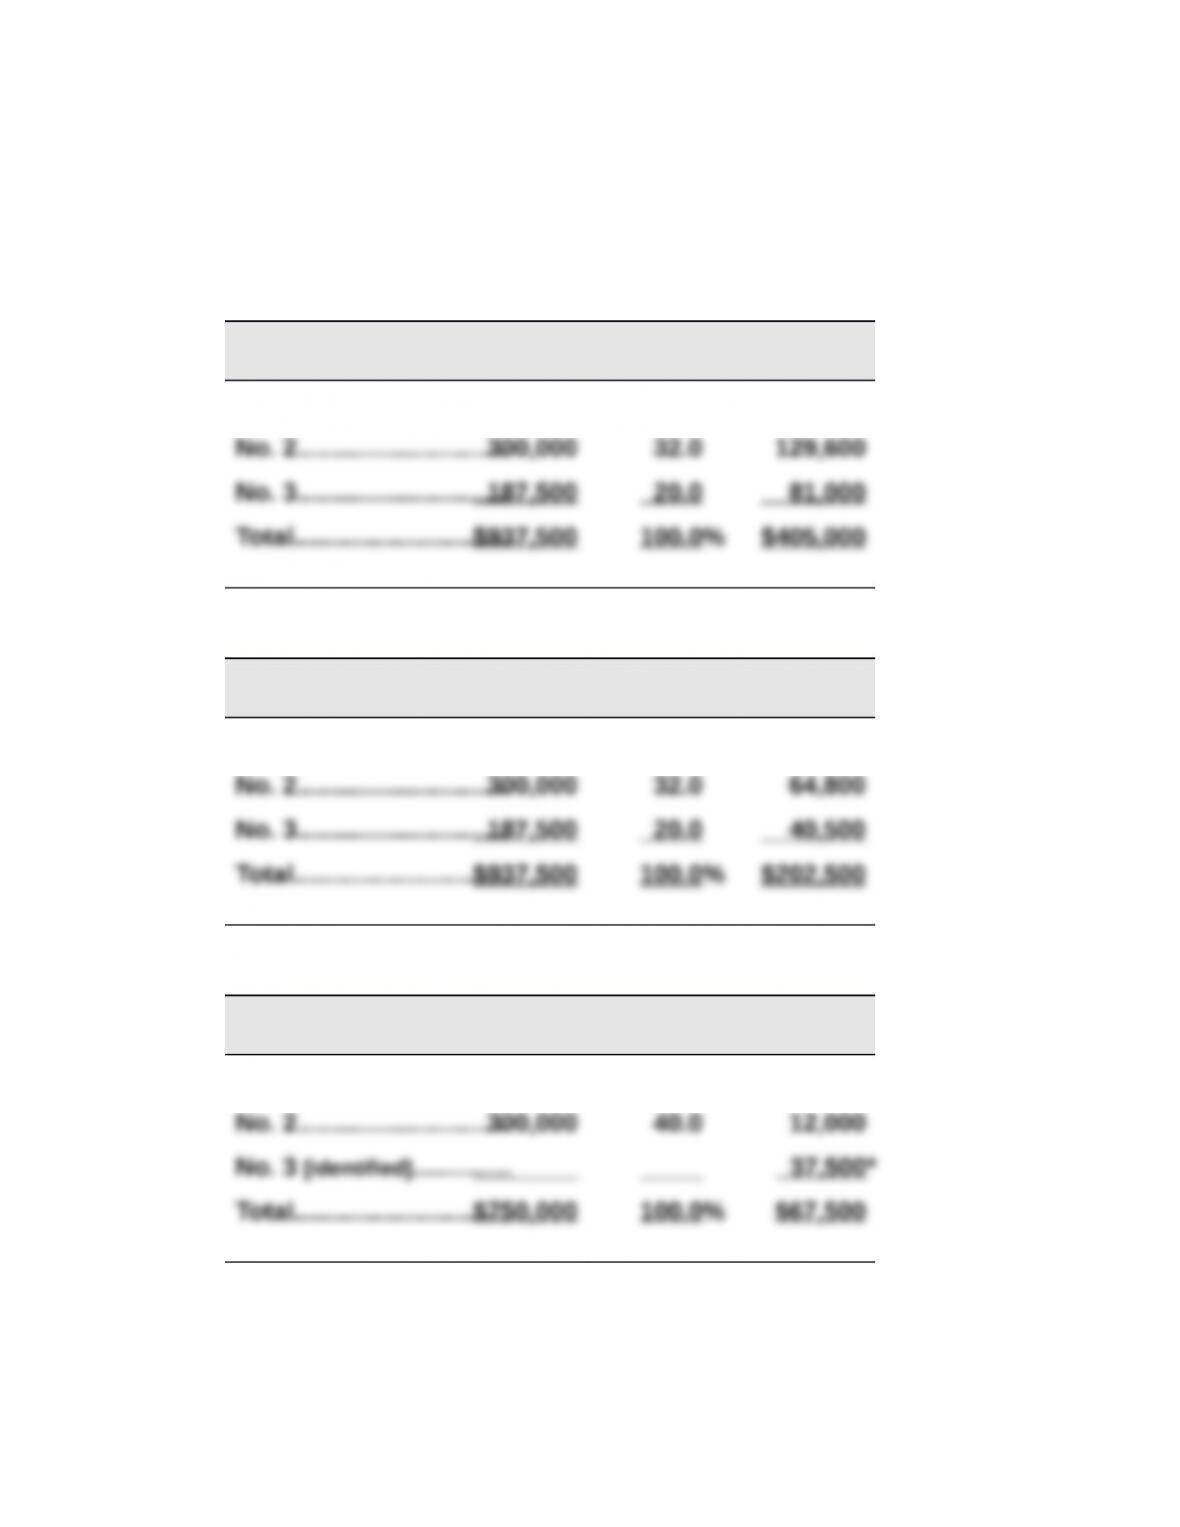
Allocations of joint costs on the basis of sales values
Tree pruning and care: $405,000
Grade
Sales
Value
Percent
of Total
Allocated
Cost
No. 1…………………………$450,000 48.0% $194,400
Picking, sorting, and grading: $202,500
Grade
Sales
Value
Percent
of Total
Allocated
Cost
No. 1…………………………$450,000 48.0% $ 97,200
Delivery: $30,000 to Grade Nos. 1 & 2
Grade
Sales
Value
Percent
of Total
Allocated
Cost
No. 1…………………………$450,000 60.0% $18,000
* If students did not round percents to one-tenth, their answers will vary
slightly from those reported here.
**The No. 3 Grade delivery costs are given in the problem description.
Problem 24-5AB (Continued)
Part 2
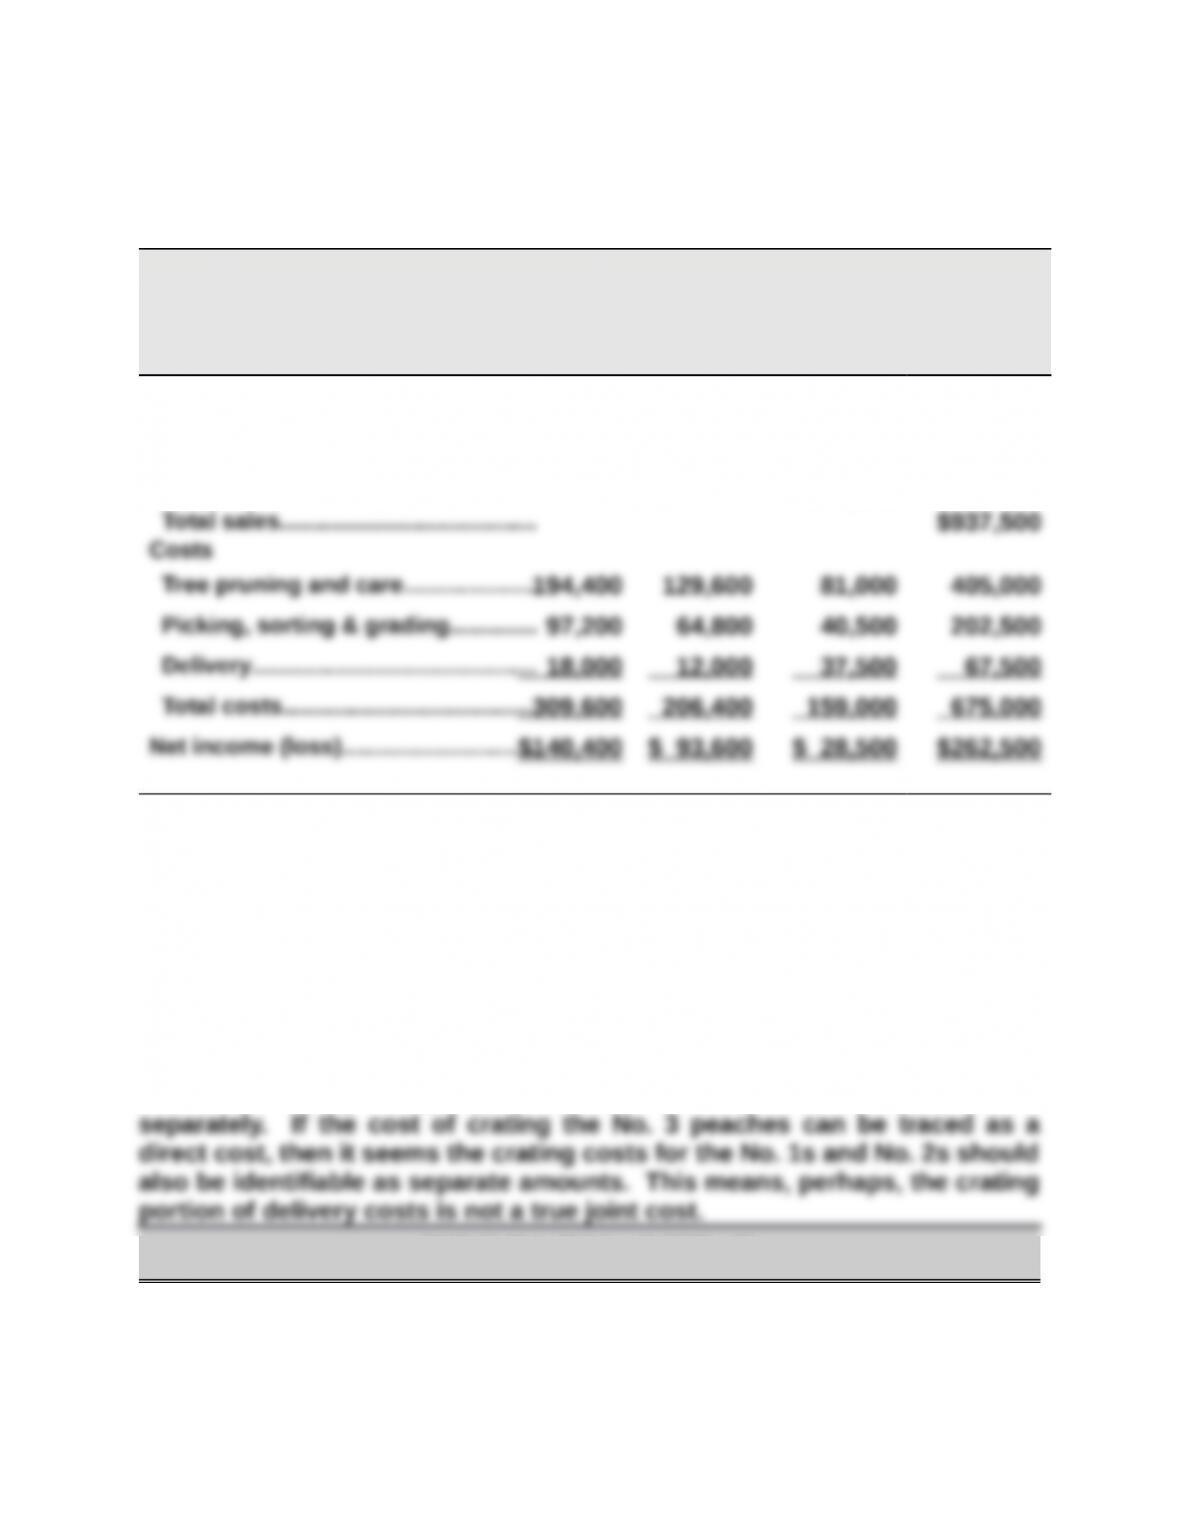
GEORGIA ORCHARDS
Income Statement
For Year Ended December 31, 2015
No. 1 No. 2 No. 3 Combined
Sales (by grade)
No. 1: 300,000 lbs. @ $1.50…………
$450,000
No. 2: 300,000 lbs. @ $1.00………… $300,000
No. 3: 750,000 lbs. @ $0.25………… $187,500
Part 3
Delivery costs include both crating and hauling costs. Georgia is able to identify the portion of the cost
directly related to the No. 3 peaches, presumably because the No. 3s are going to a different destination
than the No. 1 and No. 2 peaches. If the No. 1s and No. 2s are going to the same place, then the hauling
portion of the delivery cost may truly be a joint cost, at least for the No. 1 and No. 2 peaches.
However, since the No. 1 and No. 2 peaches are different grades and are
sold for different prices per pound, it seems safe to assume they are crated
PROBLEM SET B
Problem 24-1B (50 minutes)
Part 1
a.
Responsibility Accounting Performance Report
Dept. Manager, Refrigerator Department
For the Month of April
Budgeted Actual Over (Under)
Amount Amount Budget
Controllable Costs
Raw materials………………………….. $400,000 $385,000 $(15,000)
b.
Responsibility Accounting Performance Report
Dept. Manager, Dishwasher Department
For the Month of April
Budgeted Actual Over (Under)
Amount Amount Budget
Controllable Costs
Raw materials…………………………….$200,000 $202,000 $ 2,000