Problem 21-4B (75 minutes)
Part 1 Instructor note: Use the equation in Exhibit 21.12
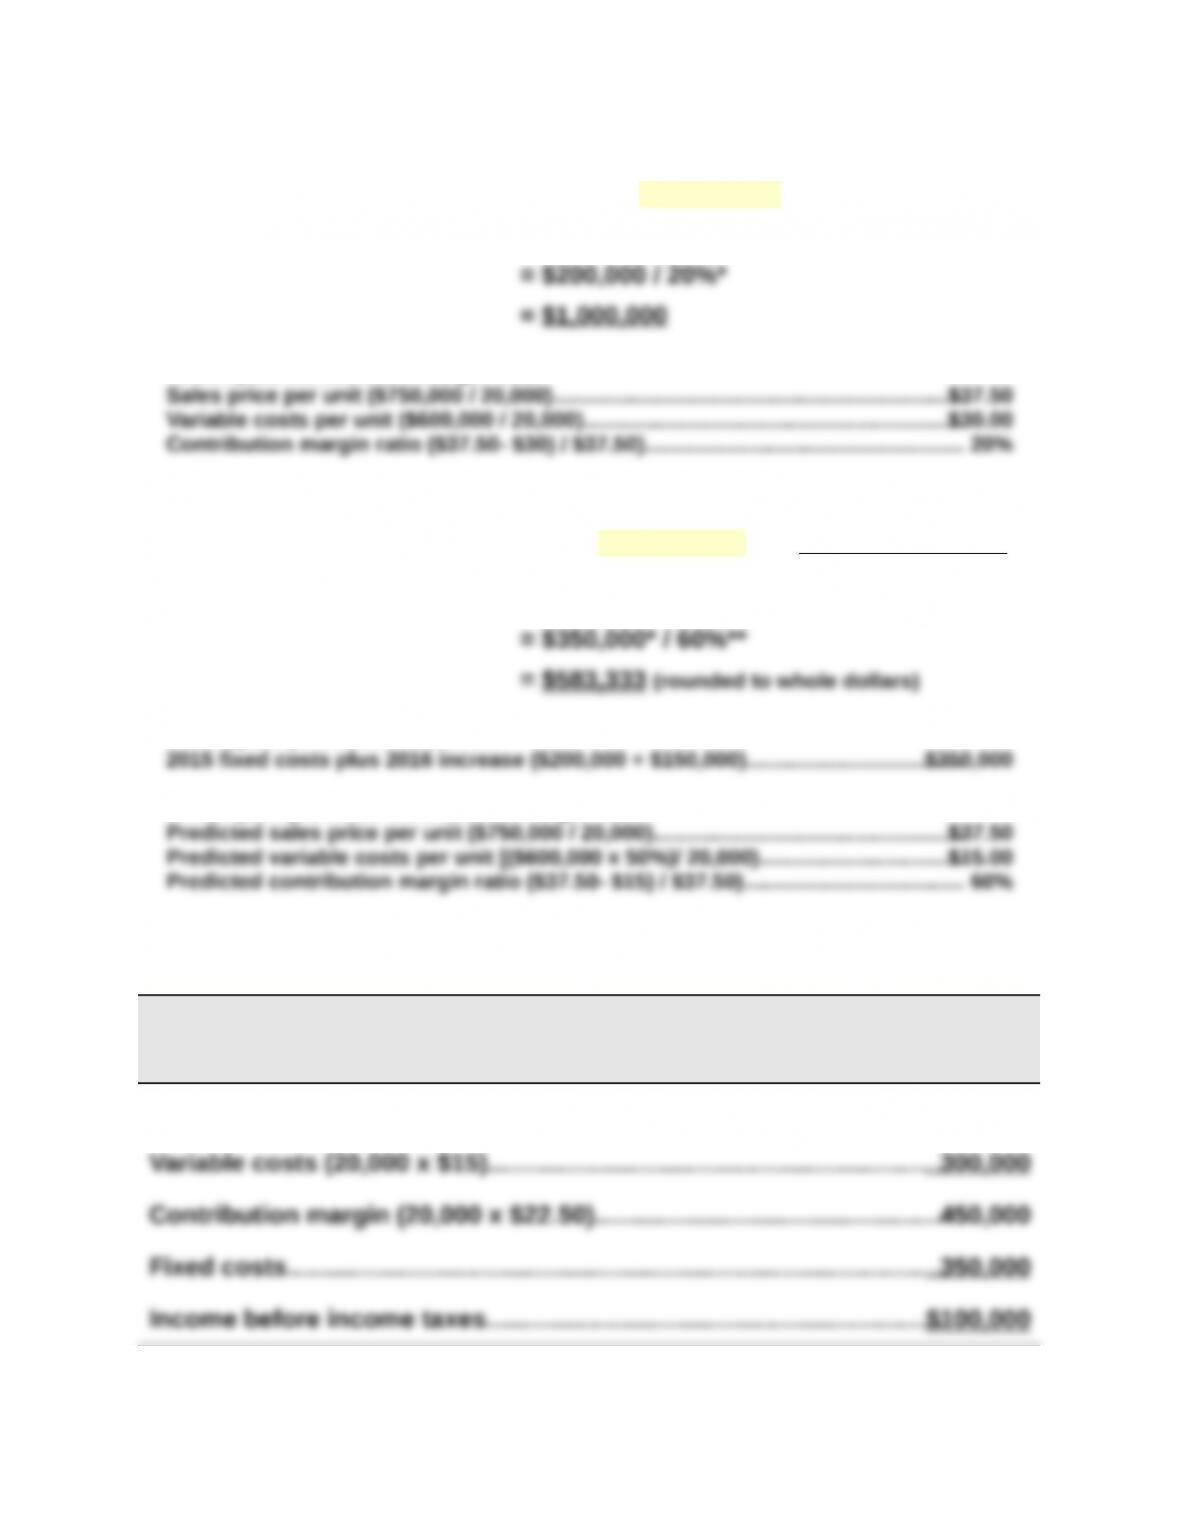
2015 break-even in dollar sales = Fixed costs / Contribution margin ratio
*To compute contribution margin ratio
Part 2 Instructor note: Use equation in Exhibit 21.12 with predicted numbers
2016 break-even in dollar sales = Fixed costs / Contribution margin ratio
*To compute predicted fixed costs
**To compute predicted contribution margin ratio
Part 3
RIVERA COMPANY
Forecasted Contribution Margin Income Statement
For Year Ended December 31, 2016
Sales (20,000 x $37.50)……………………………………………………………….$750,000
Problem 21-4B (Continued)
Part 4 Instructor note: Use equations in Exhibit 21.22 and 21.23 with predicted
numbers
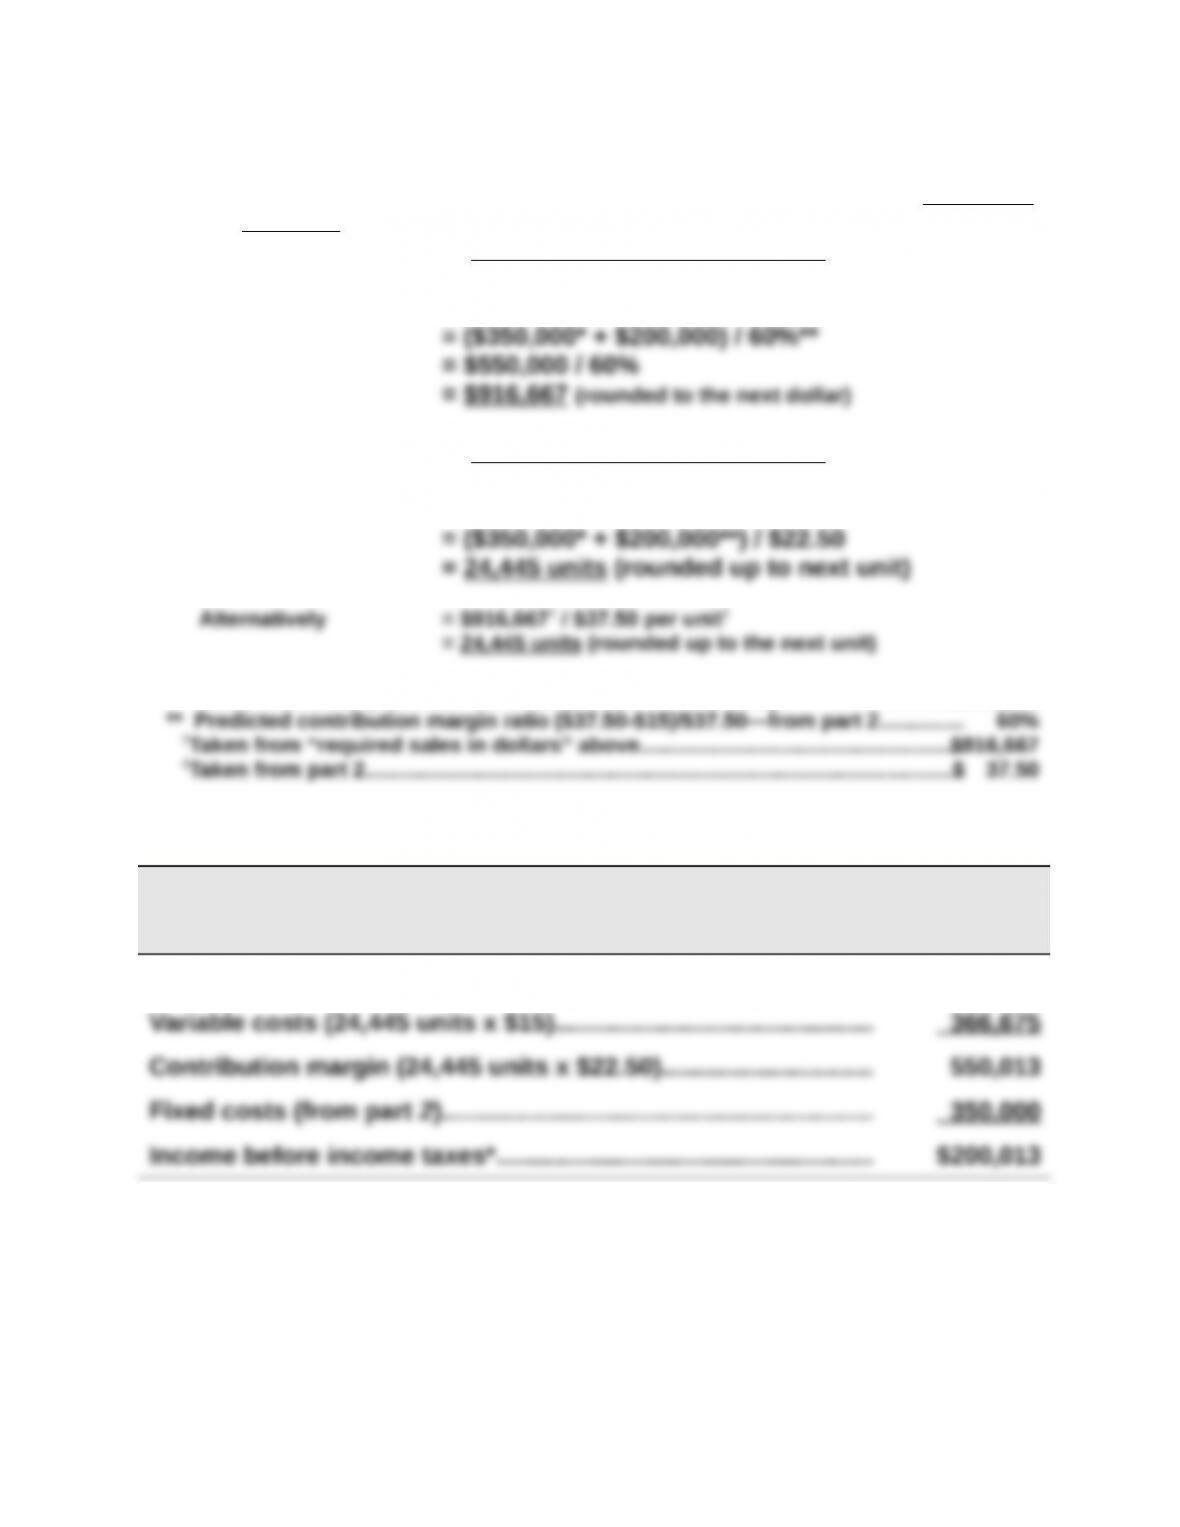
(Fixed costs + Pretax income)
Required sales in dollars = Contribution margin ratio
(Fixed costs + Pretax income)
Required sales in units = Contribution margin per unit
* 2015 fixed costs plus 2016 increase ($200,000 + $150,000)…………………………..$350,000
Part 5
RIVERA COMPANY
Forecasted Contribution Margin Income Statement
For Year Ended December 31, 2016
Sales (24,445 units x $37.50)……………………………………………… $916,688
*Slightly greater than the targeted $200,000 pretax income due to rounding of units from
part 4.
Problem 21-5B (65 minutes)
Part 1 Instructor note: Use the equation in Exhibit 21.12
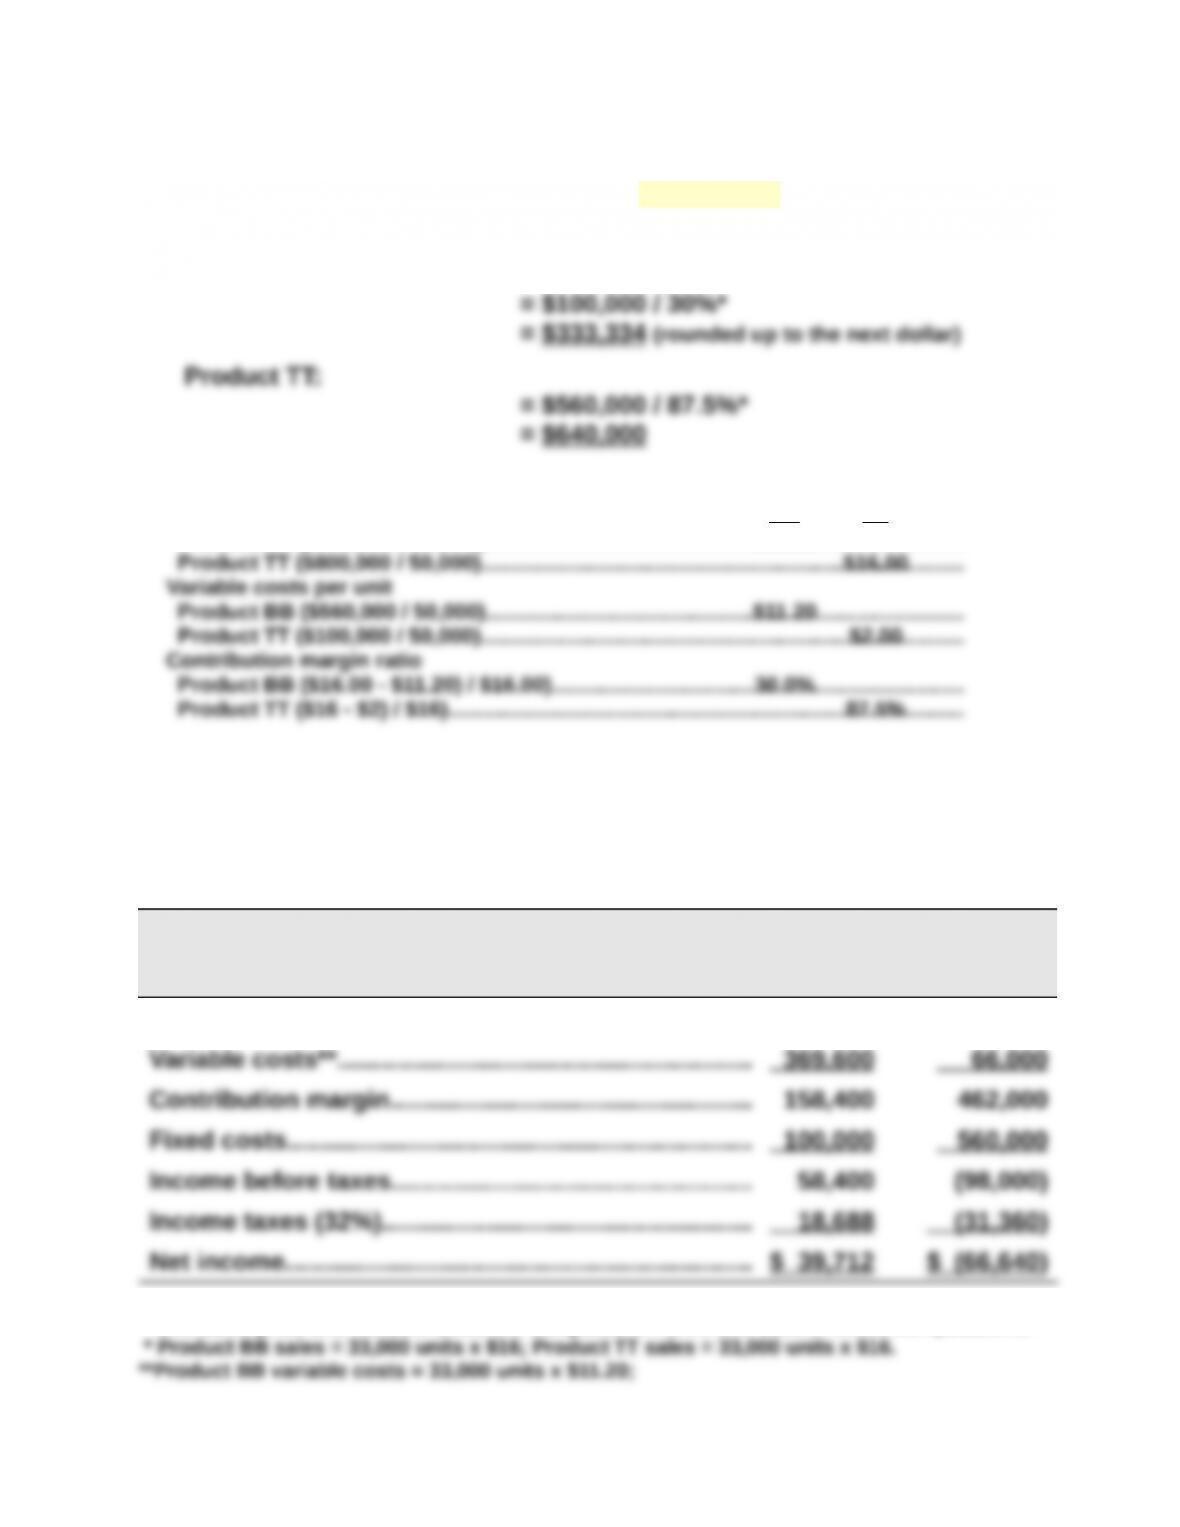
Break-even in dollar sales = Fixed costs / Contribution margin ratio
Product BB:
*To compute contribution margin ratio
Sales price per unit
Product BB ($800,000 / 50,000)……………………………………………………………………….
BB
$16.00
TT
Part 2
Forecasted contribution margin income statements for each product
assuming sales decline to 33,000 units with no change in unit sales price
STAM CO.
Forecasted Contribution Margin Income Statement
Product BB Product TT
Sales*……………………………………………………………….. $528,000 $ 528,000
Unit sales price and variable costs are computed in Part 1 and used in these computations:
Product TT variable costs = 33,000 units x $2.
Problem 21-5B (Continued)
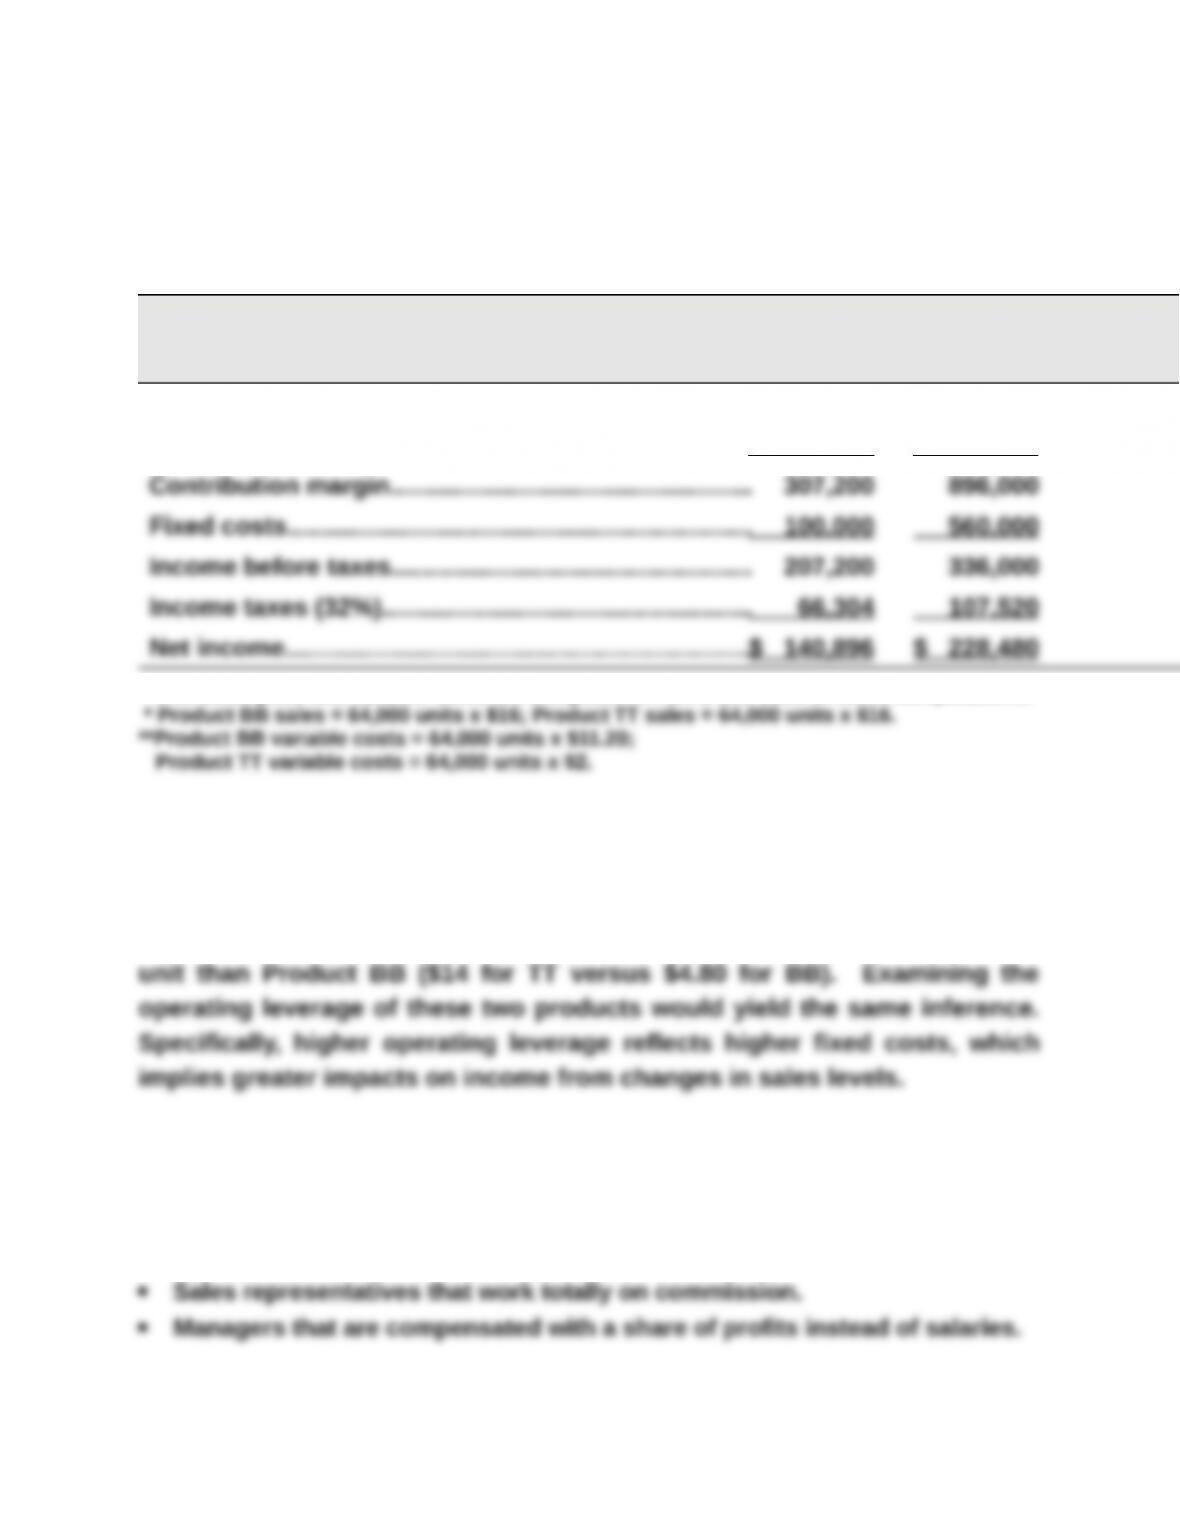
Forecasted contribution margin income statements for each product
assuming sales increase to 64,000 units with no change in unit sales price:
STAM CO.
Forecasted Contribution Margin Income Statement
Product BB Product TT
Sales*………………………………………………………………..$1,024,000 $1,024,000
Variable costs**…………………………………………………. 716,800 128,000
Unit sales price and variable costs are computed in Part 1 and used in these computations:
Part 4
If sales were to greatly increase, Product TT would experience the greater
increase in income because it would gain more contribution margin per
Part 5
Factors that could cause Product BB to have lower fixed costs include:
Labor arrangement that pays workers for units produced.
In contrast, the fixed costs for Product TT could be higher because of:
Problem 21-6B (45 minutes)
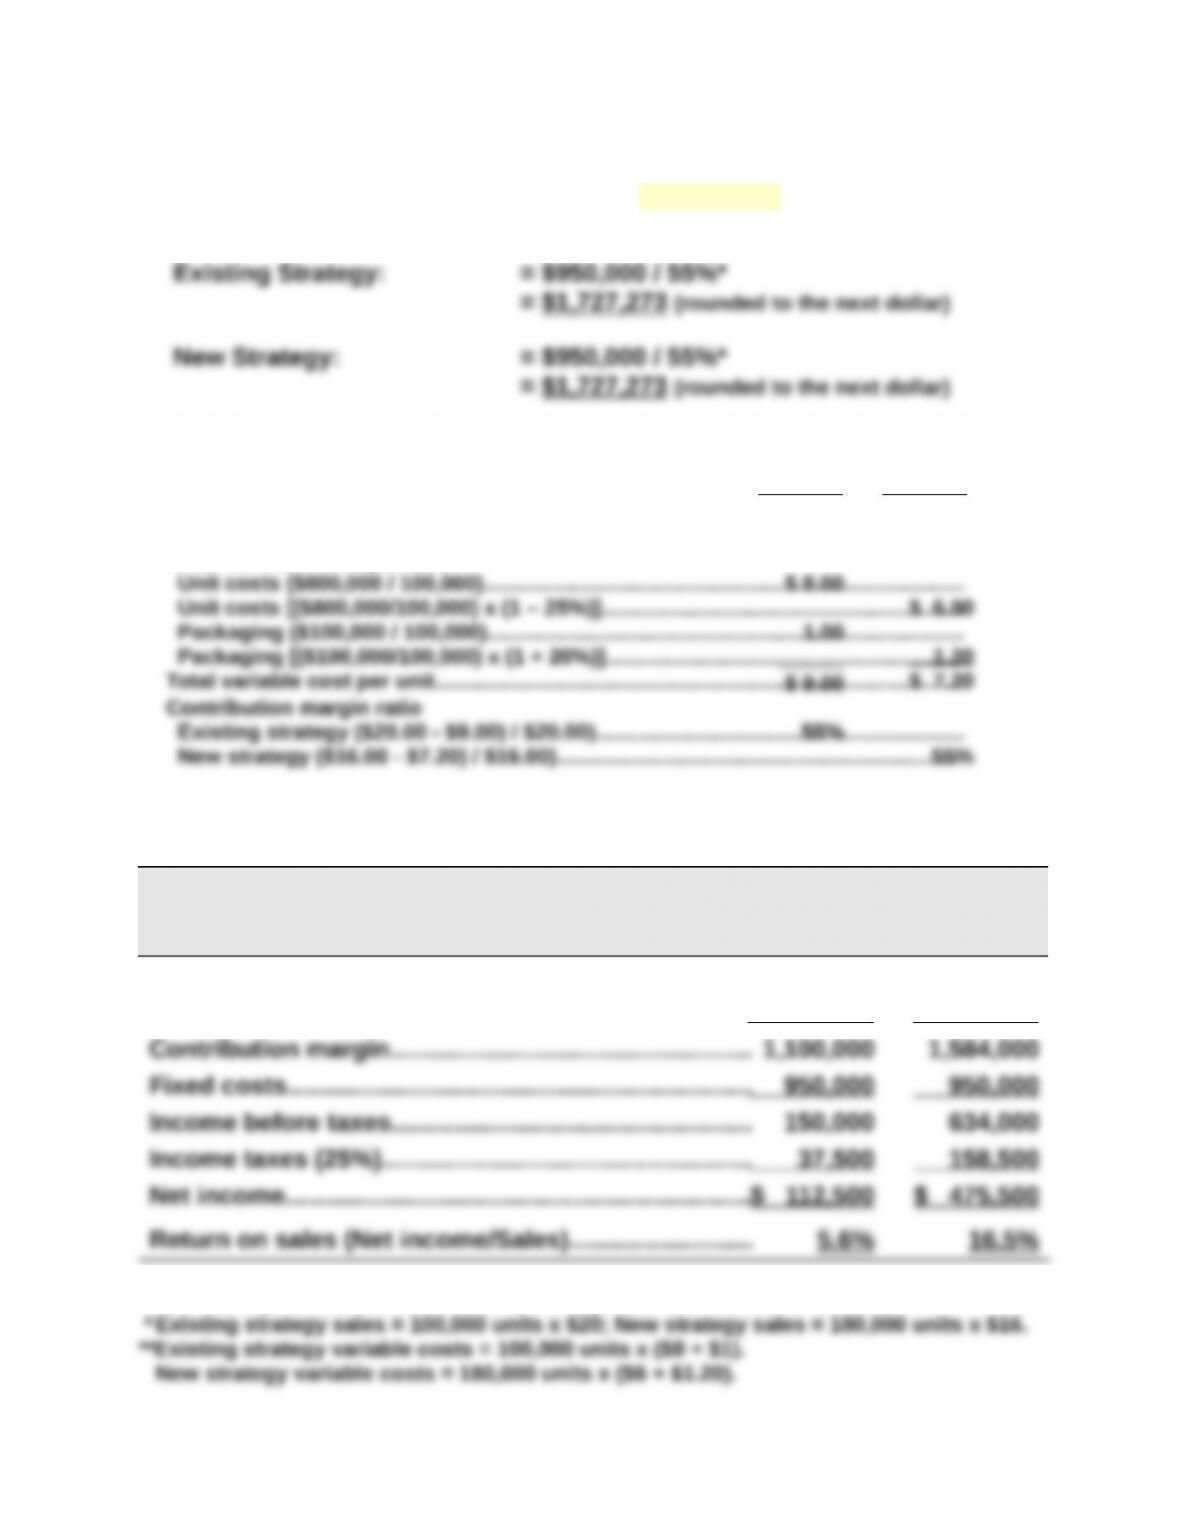
Part 1 Instructor note: Use the equation in Exhibit 21.12
Break-even in dollar sales = Fixed costs / Contribution margin ratio
*To compute contribution margin ratio
Sales price per unit
Existing strategy…………………………………………………………………………………………….
New strategy [$20.00 x (1 – 20%)]……………………………………………………………………
Existing
Strategy
$20.00
New
Strategy
$16.00
Total variable costs per unit
Part 2
BEST COMPANY
Forecasted Contribution Margin Income Statement
Existing Strategy New Strategy
Sales*………………………………………………………………..$2,000,000 $2,880,000
Variable costs**…………………………………………………. 900,000 1,296,000
Unit sales price and variable costs are computed in Part 1 and used here:
Problem 21-7B (50 minutes)
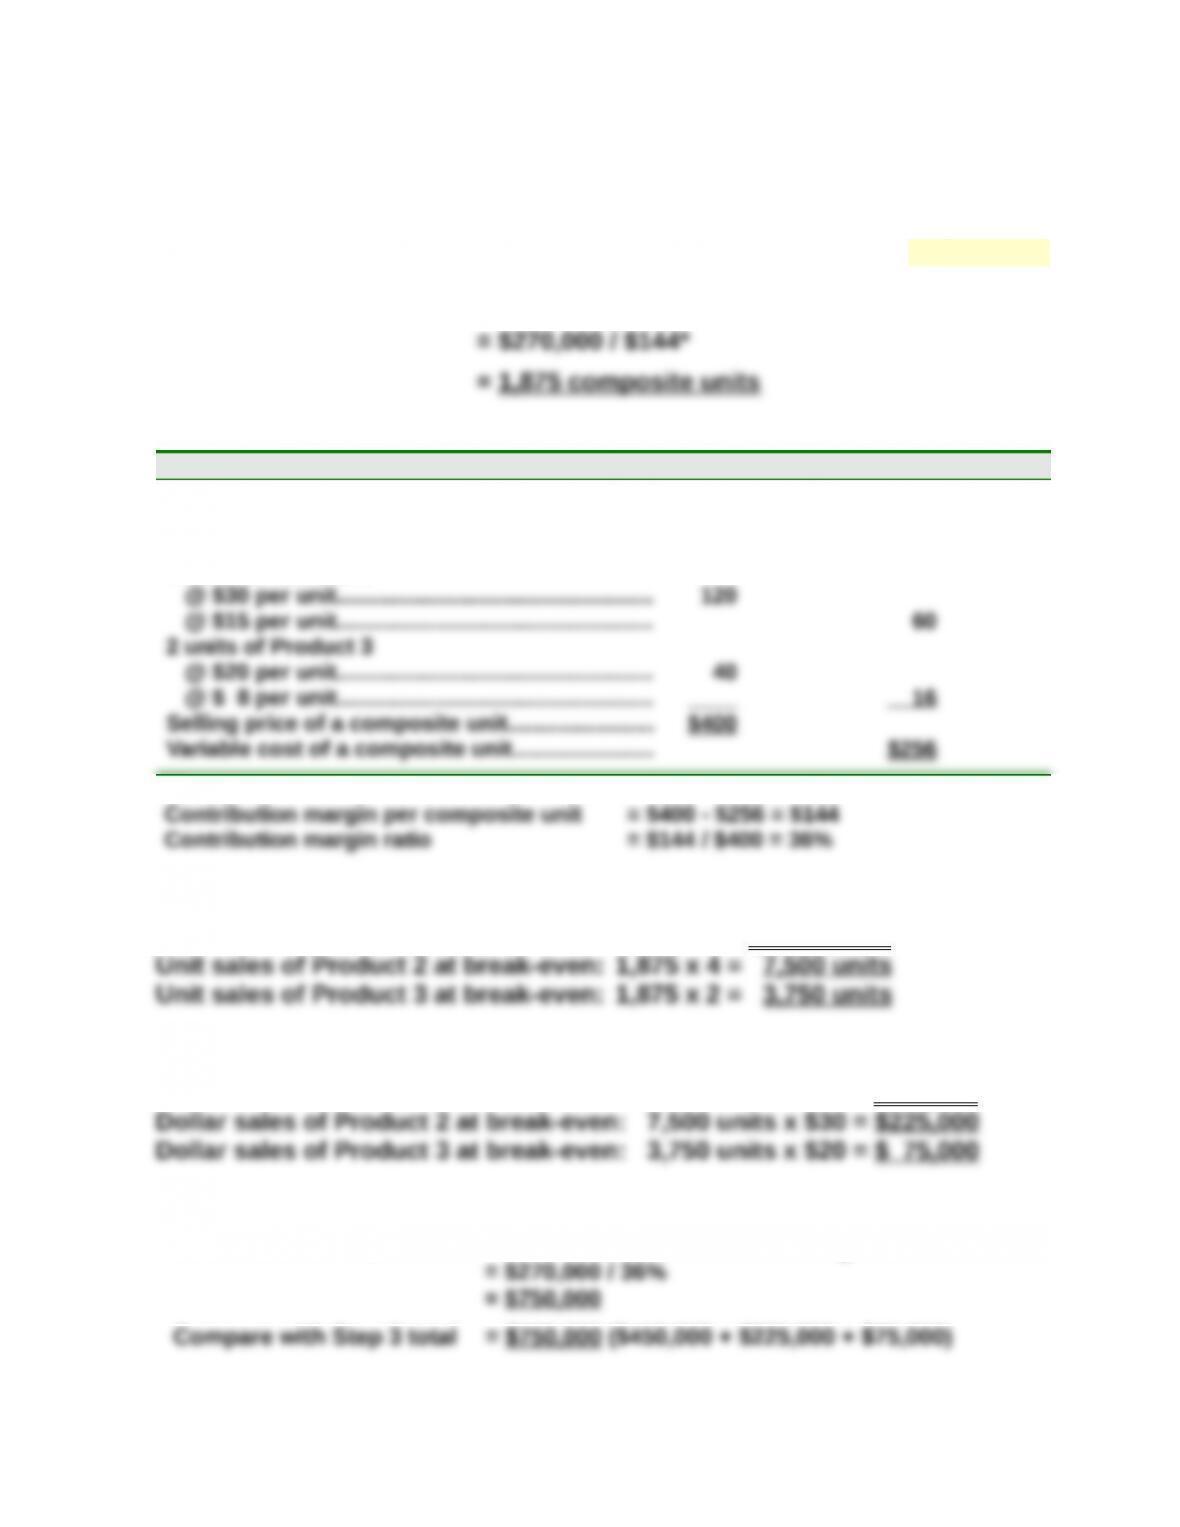
Part 1 BREAK–EVEN ANALYSIS ASSUMING USE OF SAME MATERIALS
Step 1: Compute break-even in composite units—Use equation in Exhibit 21.29
Break-even in composite units = Fixed costs/Contribution margin per composite unit
* To compute the contribution margin per composite unit
Unit Sales Price Unit Variable Costs
6 units of Product 1
@ $40 per unit……………………………………………
@ $30 per unit……………………………………………
$240
$180
4 units of Product 2
Thus:
Step 2: Compute break-even in individual product unit sales
Unit sales of Product 1 at break-even: 1,875 x 6 = 11,250 units
Step 3: Compute break-even in individual product dollar sales
Dollar sales of Product 1 at break-even: 11,250 units x $40 = $450,000
Crossfoot Step 3 total with that from formula:
Break-even in dollar sales = Fixed costs / Contribution margin ratio
Problem 21-7B (Continued)
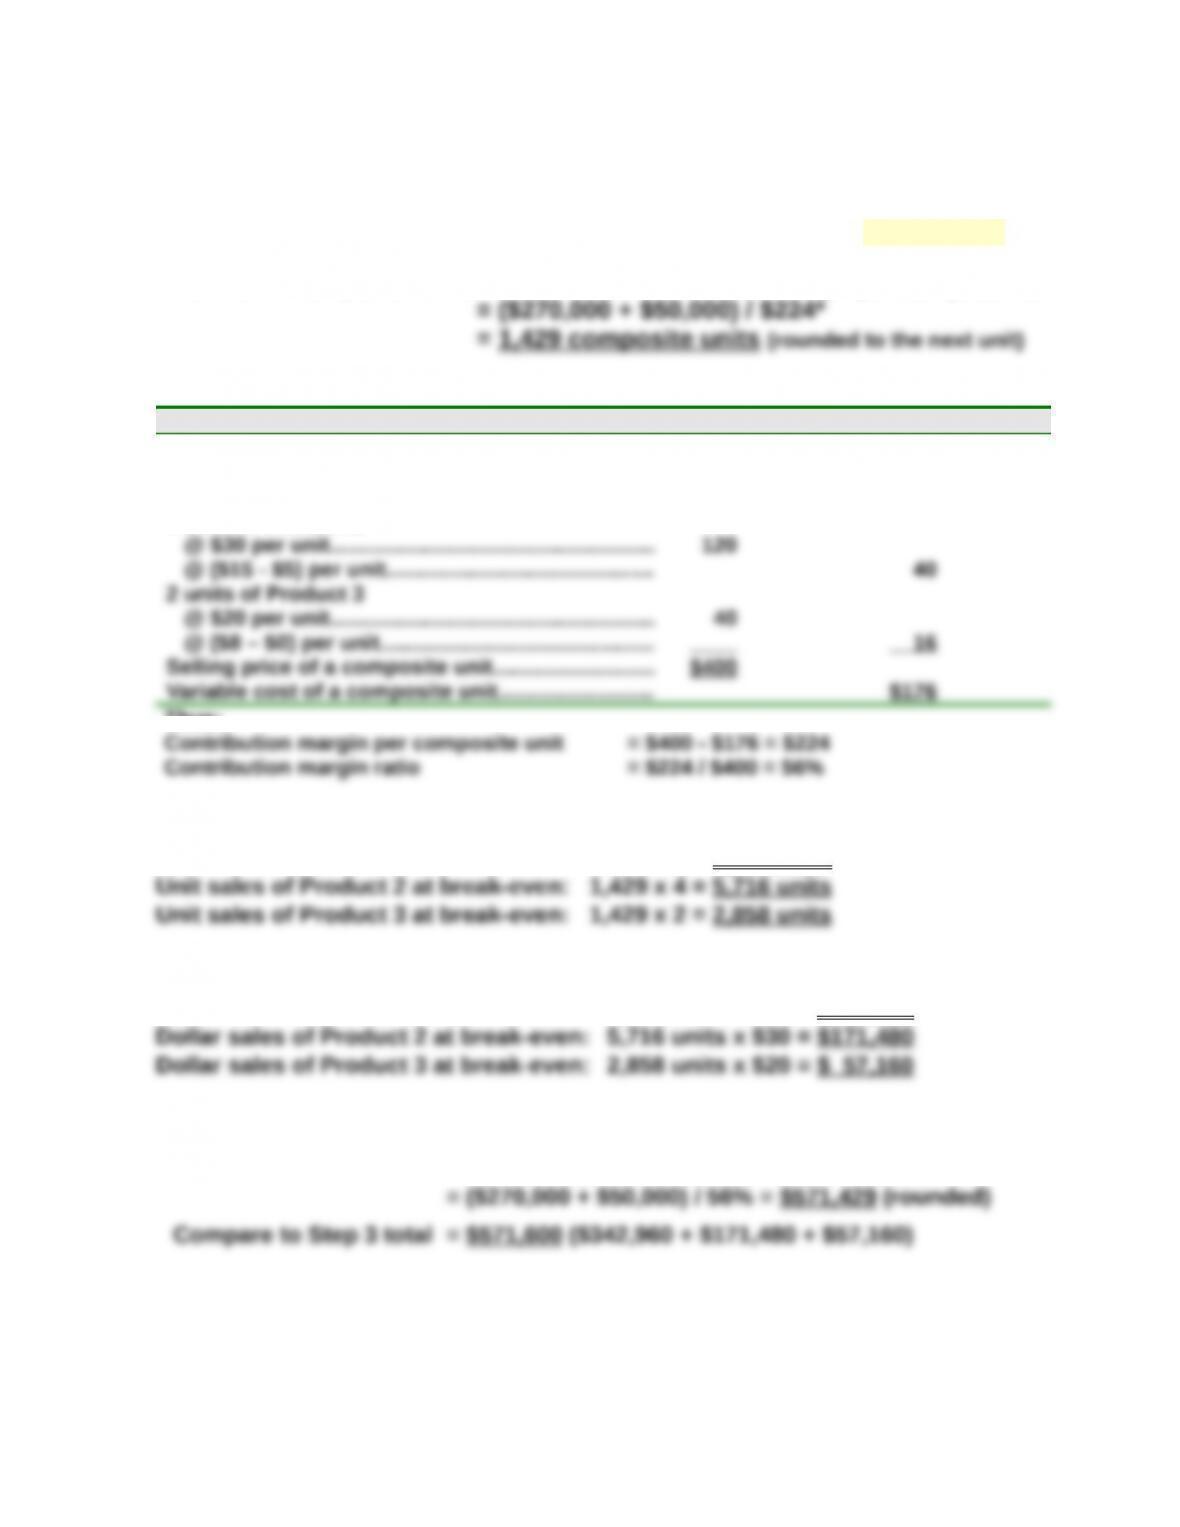
Part 2 BREAK–EVEN ANALYSIS ASSUMING USE OF NEW MATERIALS
Step 1: Compute break-even in composite units—Use equation in Exhibit 21.29
Break-even in composite units = Fixed costs/Contribution margin per composite unit
*To compute the contribution margin per composite unit
Unit Sales Price Unit Variable Costs
6 units of Product 1
@ $40 per unit………………………………………………..
@ ($30 – $10) per unit……………………………………..
$240
$120
4 units of Product 2
Thus:
Step 2: Compute break-even in individual product unit sales
Unit sales of Product 1 at break-even: 1,429 x 6 = 8,574 units
Step 3: Compute break-even in individual product dollar sales
Dollar sales of Product 1 at break-even: 8,574 units x $40 = $342,960
Crossfoot Step 3 total with that from formula ($171 of rounding differences):
Break-even in $ sales = Fixed costs / Contribution margin ratio
Part 3
When a business invests in fixed assets, as in this case, there is an increase
in its risk level (more fixed costs must be recovered). However, investments