
Chapter 21 – Cost-Volume-Profit Analysis
Problem 21-7A (50 minutes)
Part 1 BREAK–EVEN ANALYSIS ASSUMING USE OF SAME MATERIALS
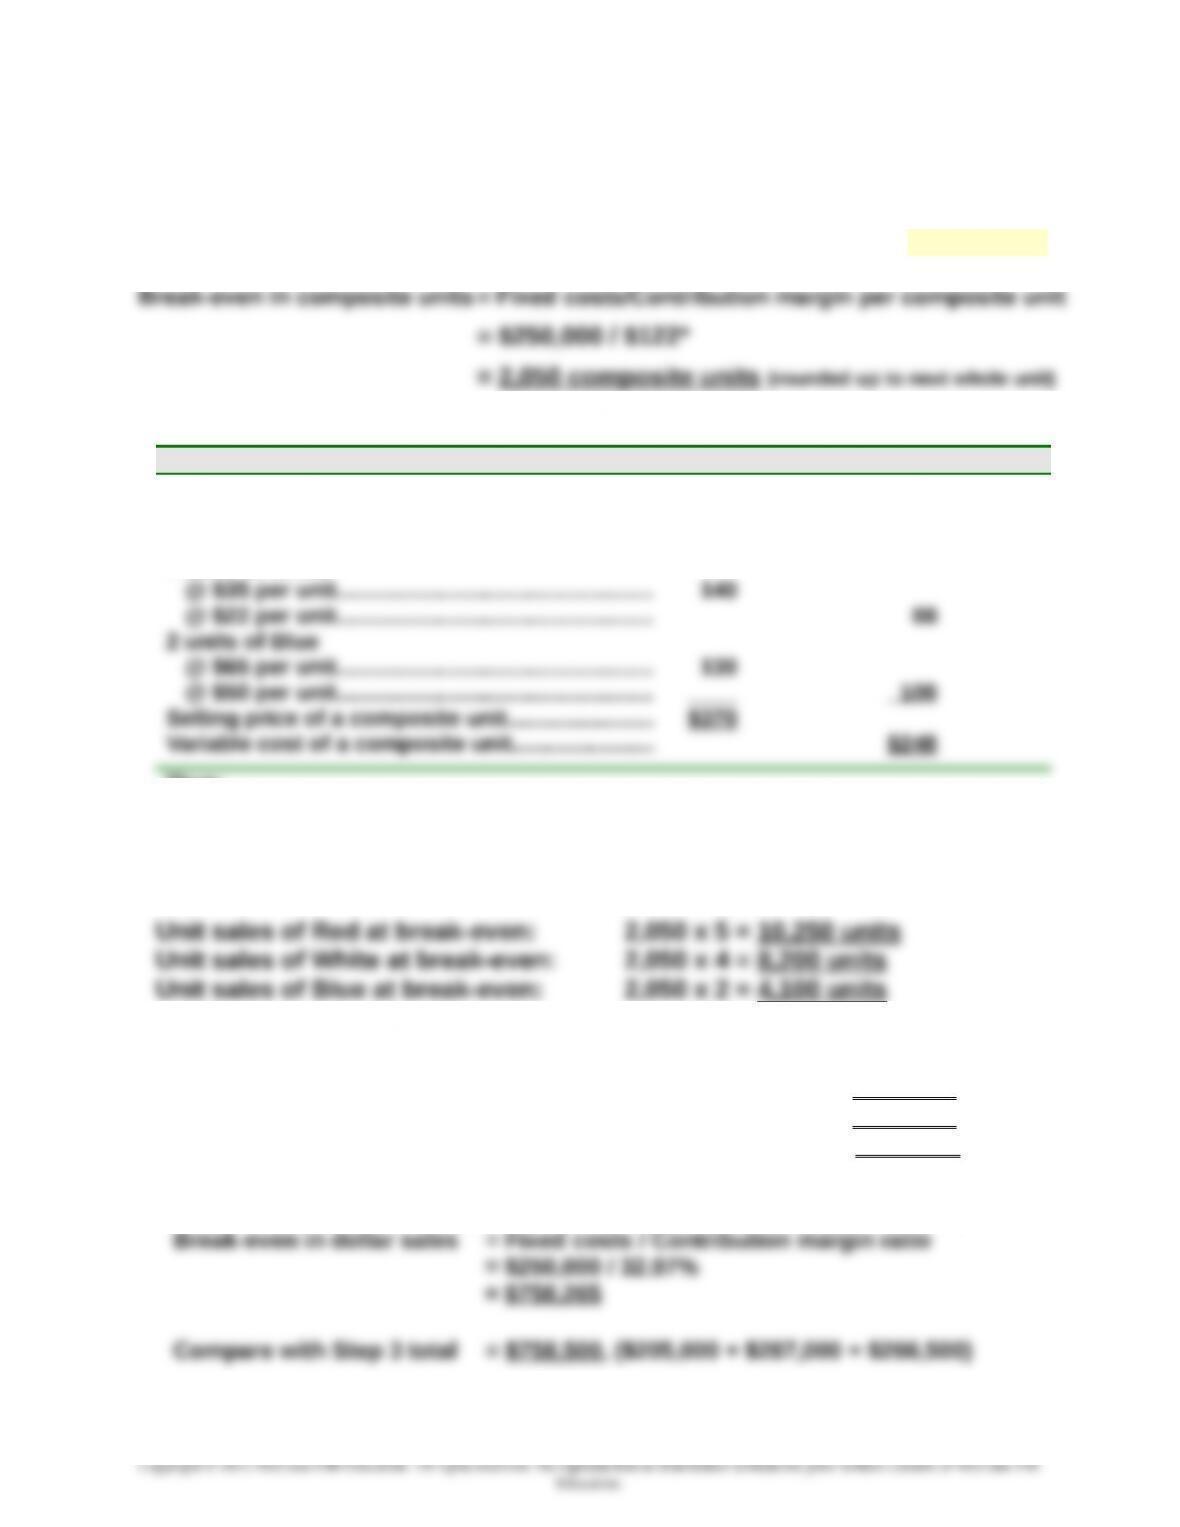
Step 1: Compute break-even in composite units—Use equation in Exhibit 21.29
*To compute the contribution margin per composite unit
Unit Sales Price Unit Variable Costs
5 units of Red
@ $20 per unit……………………………..…..…..…...
@ $12 per unit……………………………..…..…..…...
$100
$ 60
4 units of White
Thus:
Contribution margin per composite unit = $370 – $248 = $122
Contribution margin ratio (rounded) = $122 / $370 = 32.97%
Step 2: Compute break-even in individual product unit sales
Step 3: Compute break-even in individual product dollar sales
Dollar sales of Red at break-even: 10,250 units x $20 = $205,000
Dollar sales of White at break-even: 8,200 units x $35 = $287,000
Dollar sales of Blue at break-even: 4,100 units x $65 = $266,500
Crossfoot Step 3 total with that from formula ($235 rounding difference):
21-1209

Chapter 21 – Cost-Volume-Profit Analysis
Problem 21-7A (Continued)
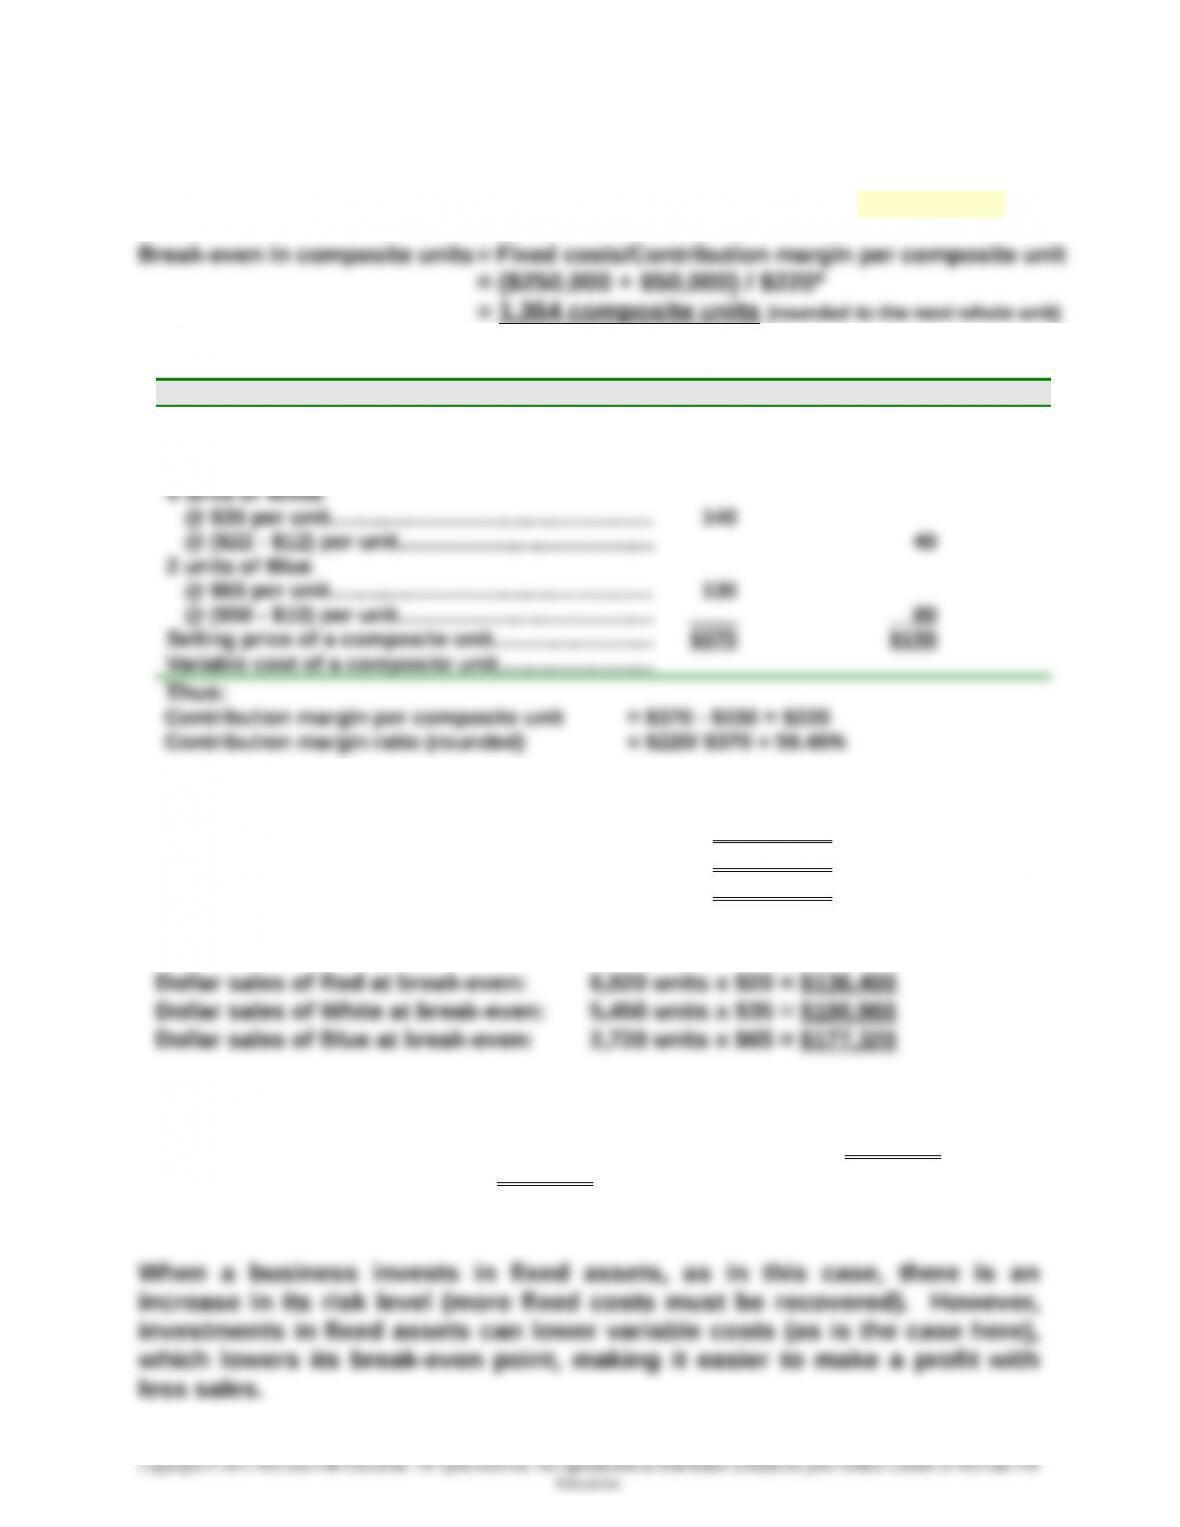
Part 2 BREAK–EVEN ANALYSIS ASSUMING USE OF NEW MATERIALS
Step 1: Compute break-even in composite units—Use equation in Exhibit 21.29
*To compute the contribution margin per composite unit
Unit Sales Price Unit Variable Costs
5 units of Red
@ $20 per unit……………………………………..……....
@ ($12 – $6) per unit….………...............................
$100
$ 30
Step 2: Compute break-even in individual product unit sales
Unit sales of Red at break-even: 1,364 x 5 = 6,820 units
Unit sales of White at break-even: 1,364 x 4 = 5,456 units
Unit sales of Blue at break-even: 1,364 x 2 = 2,728 units
Step 3: Compute break-even in individual product dollar sales
Crossfoot Step 3 total with that from formula ($139 rounding difference):
Break-even in dollar sales = Fixed costs / Contribution margin ratio
= ($250,000 + $50,000) / 59.46% = $504,541 (rounded)
Compare with Step 3 total = $504,680 ($136,400 + $190,960 + $177,320)
Part 3
21-1210

Chapter 21 – Cost-Volume-Profit Analysis
PROBLEM SET B
Problem 21-1B (25 minutes)
Parts 1 and 2
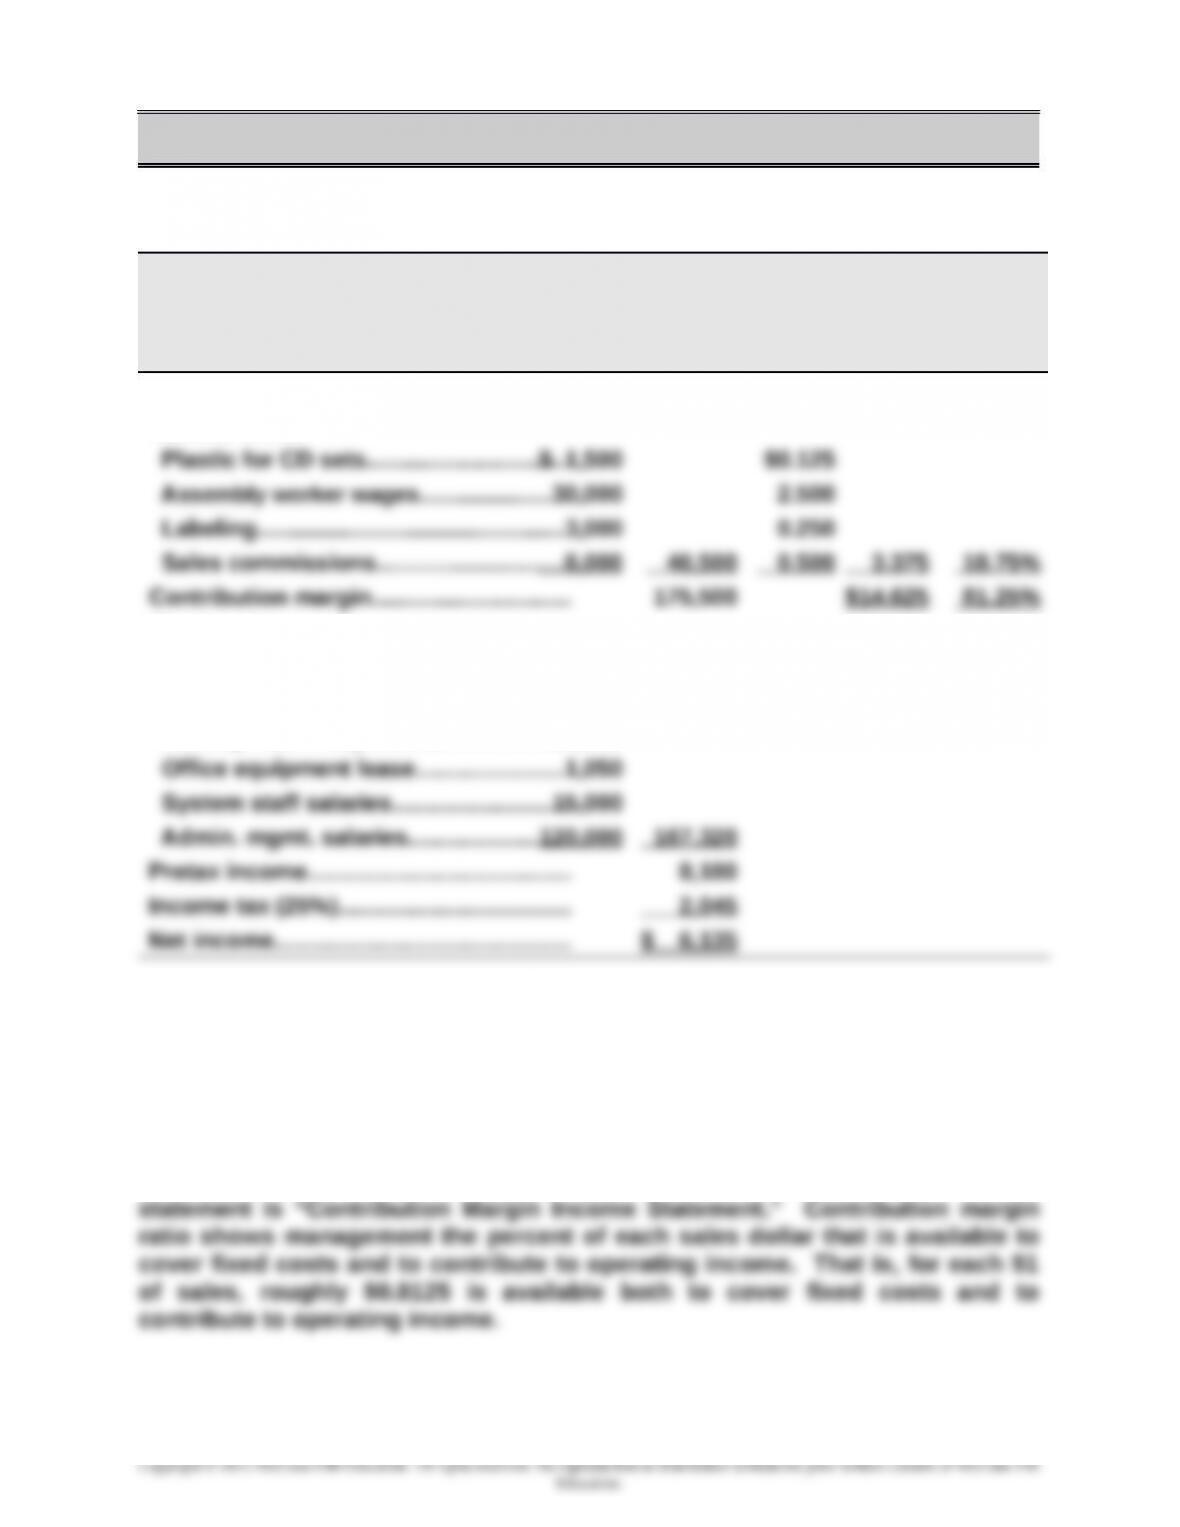
Gilmore Company
Contribution Margin Income Statement
For Year Ended December 31, 2015
(12,000 units) Per unit % of sales
Sales ($18 x 12,000)..……………………… $216,000 $18.000 100.00%
Variable costs
Fixed costs
Rent on factory.………………………………6,750
Factory cleaning service………..………..4,520
Factory mach. depreciation……………..20,000
The contribution margin per unit is $14.625, and the contribution margin ratio is
81.25%.
Part 3 Analysis Component
Contribution margin shows how much of total sales are available to cover
fixed costs and contribute to operating income. This is why the title for this
21-1211

Sun
Company
0
2
0
4
0
0
$120
0 $5
0
$10
0
$15
0
$200 $25
0
Sales
Dollars
Tot
al
Cos
ts
Chapter 21 – Cost-Volume-Profit Analysis
Problem 21-2B (45 minutes)
Parts 1 and 2
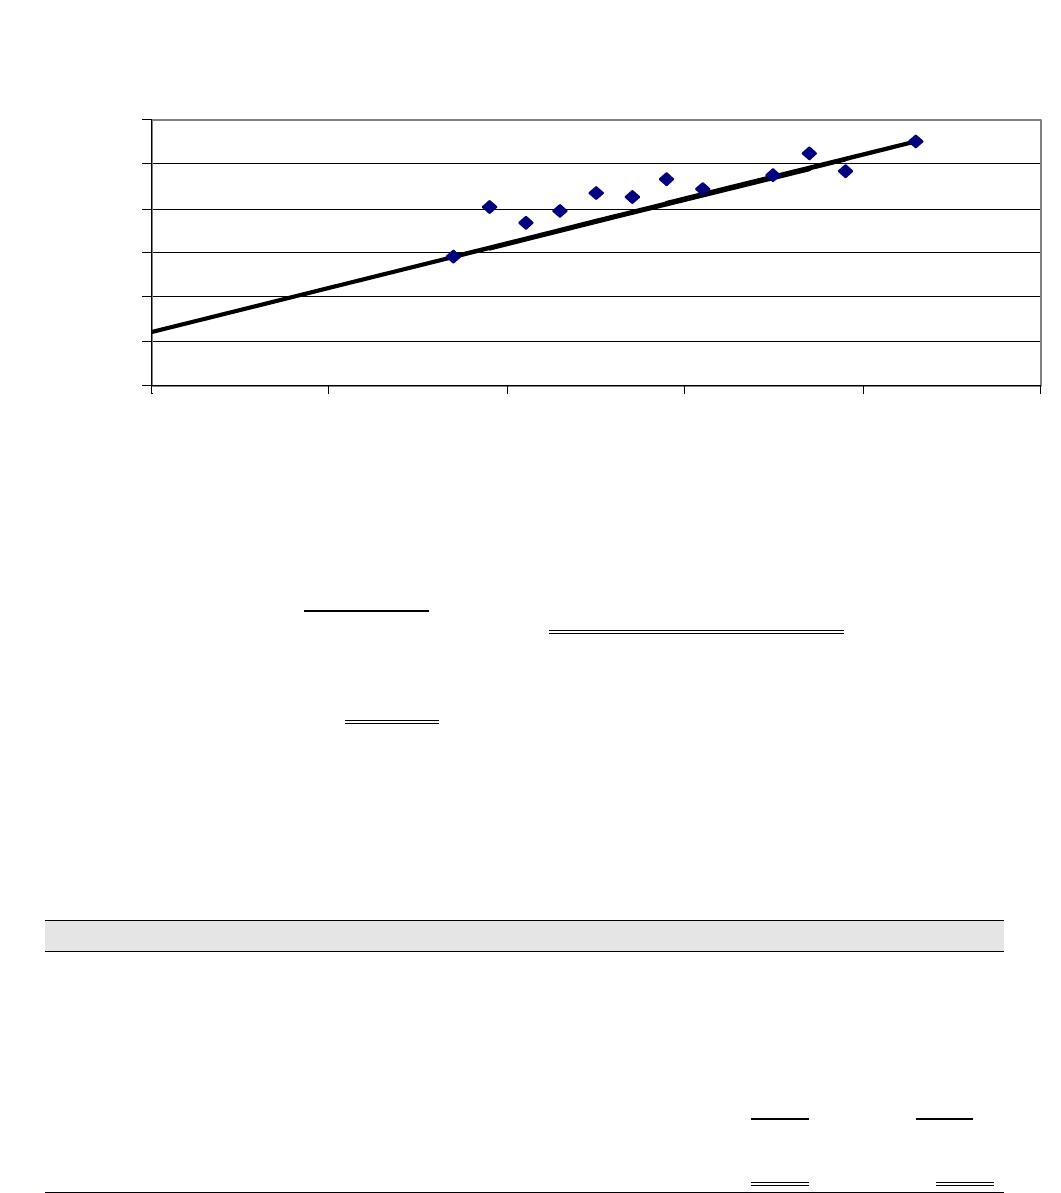
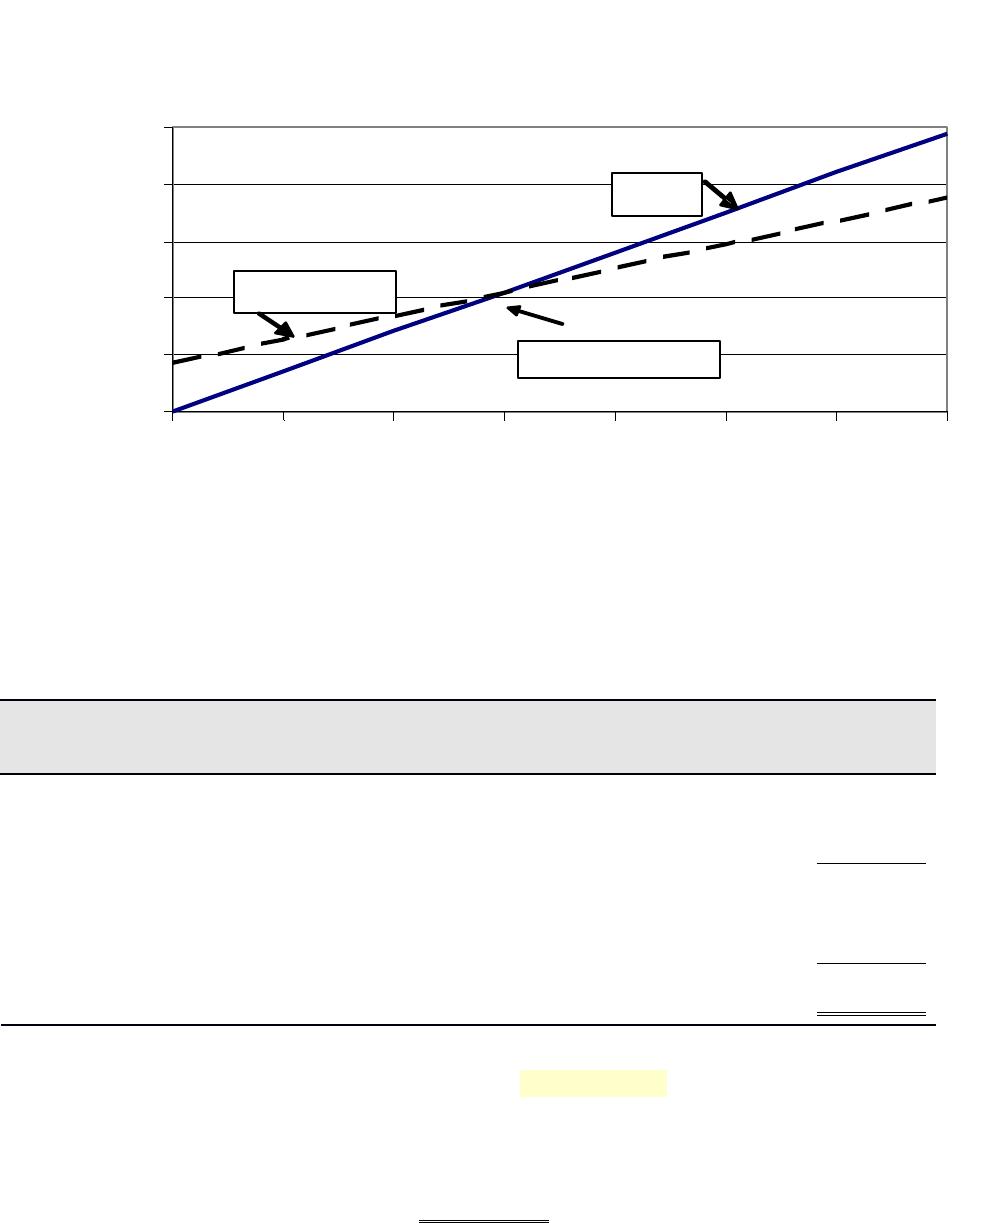
The scatter diagram and its estimated line of cost behavior appear below.
Sales and cost amounts are in thousands of dollars.
Part 2 Calculation of variable and fixed costs
Part 3
The estimates in Part 2 can be used to predict the total costs that will be
incurred at sales levels of $100 and $170 (both in thousands).
(‘000s) Predictions
Sales (given)……………………………………………………..……………$100 $170
21-1212
Chapter 21 – Cost-Volume-Profit Analysis
21-1213


Chapter 21 – Cost-Volume-Profit Analysis
Problem 21-3B (40 minutes)
Part 1
(a) Instructor note: Use the equation in Exhibit 21.11
Break-even in unit sales = Fixed costs / Contribution margin per unit
= $42,000 / $140*
= 300 units
*Contribution margin = $350 – $210 = $140
(b) Instructor note: Use the equation in Exhibit 21.12
Problem 21-3B (Continued)
Part 2
21-1214

Hip-Hop Company CVP
chart
$
0
$250,00
0 10
0
20
0
30
0
40
0
50
0
60
0
70
0
Unit
s
Chapter 21 – Cost-Volume-Profit Analysis
Part 3
HIP-HOP CO.
Contribution Margin Income Statement (at Break-Even) — Keyboards
Sales (300 x $350)…………………………………………………………………...…$105,000
Variable costs (300 x $210)……………………………………………………..…. 63,000
Problem 21-4B (75 minutes)
Part 1 Instructor note: Use the equation in Exhibit 21.12
2015 break-even in dollar sales = Fixed costs / Contribution margin ratio
= $200,000 / 20%*
= $1,000,000
21-1215

Chapter 21 – Cost-Volume-Profit Analysis
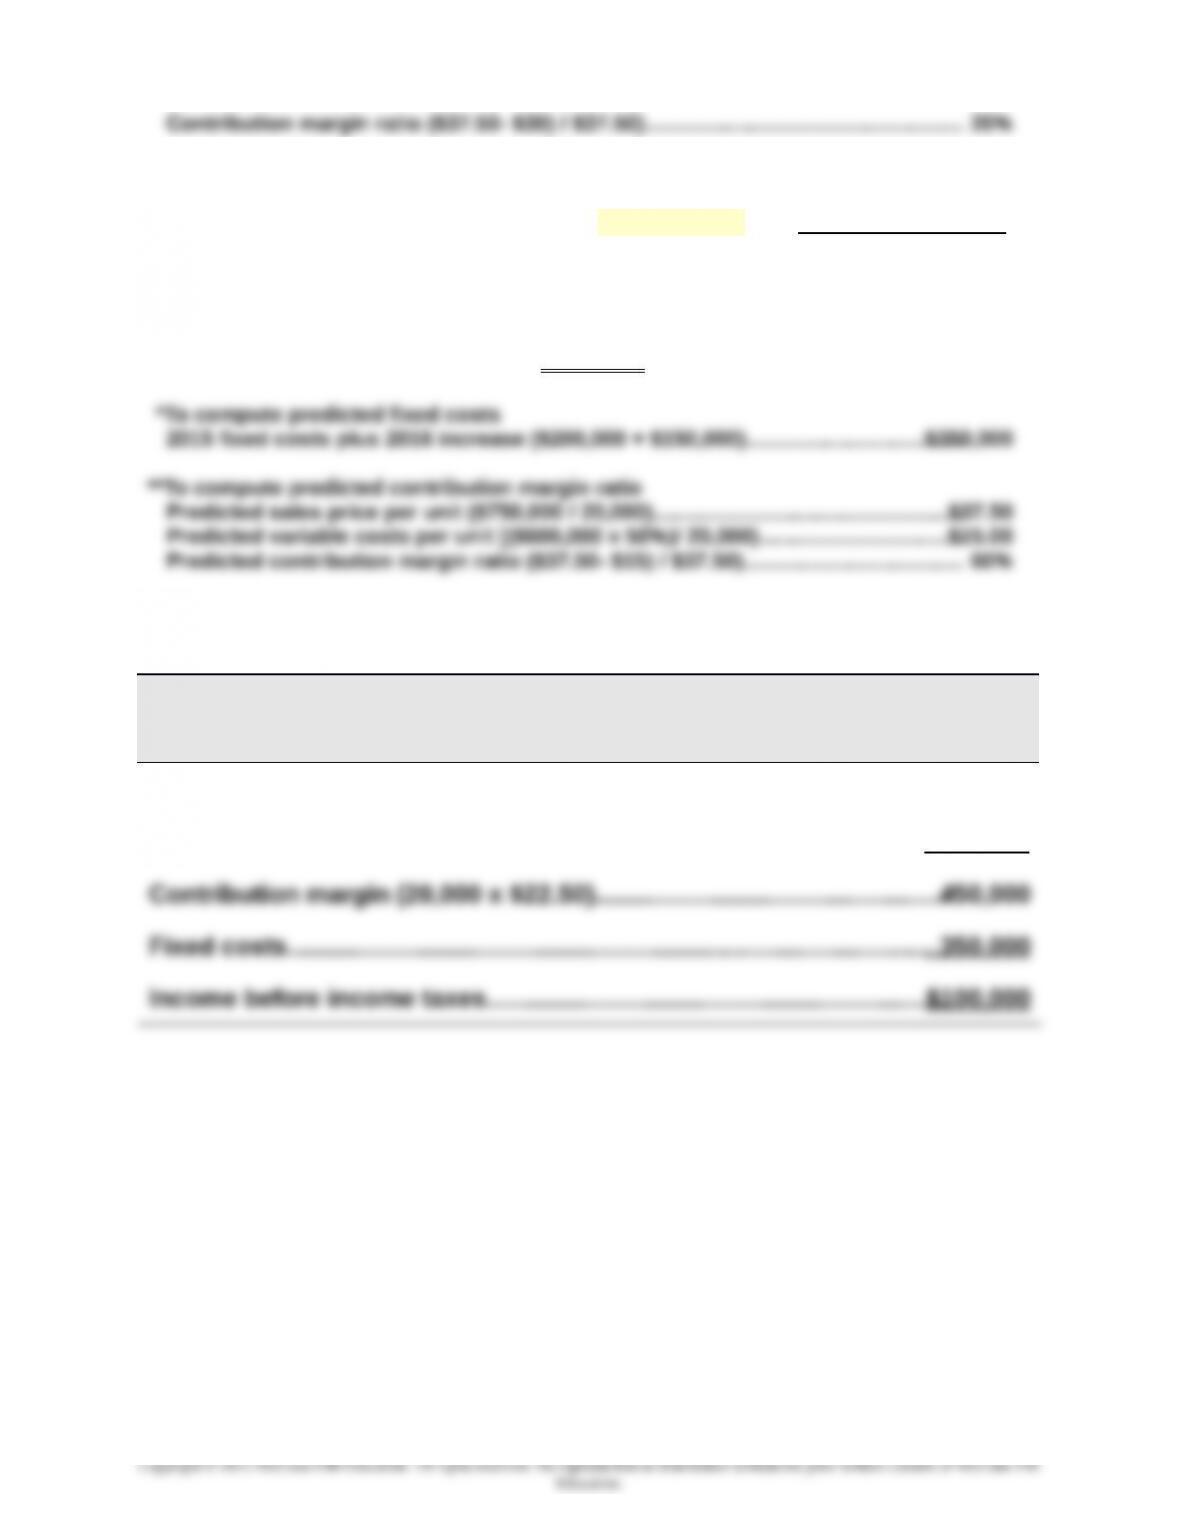
Part 2 Instructor note: Use equation in Exhibit 21.12 with predicted numbers
2016 break-even in dollar sales = Fixed costs / Contribution margin ratio
= $350,000* / 60%**
= $583,333 (rounded to whole dollars)
Part 3
RIVERA COMPANY
Forecasted Contribution Margin Income Statement
For Year Ended December 31, 2016
Sales (20,000 x $37.50)………………………………………………………..……….$750,000
Variable costs (20,000 x $15)…………………………..…………..…………….... 300,000
21-1216

Chapter 21 – Cost-Volume-Profit Analysis
Problem 21-4B (Continued)
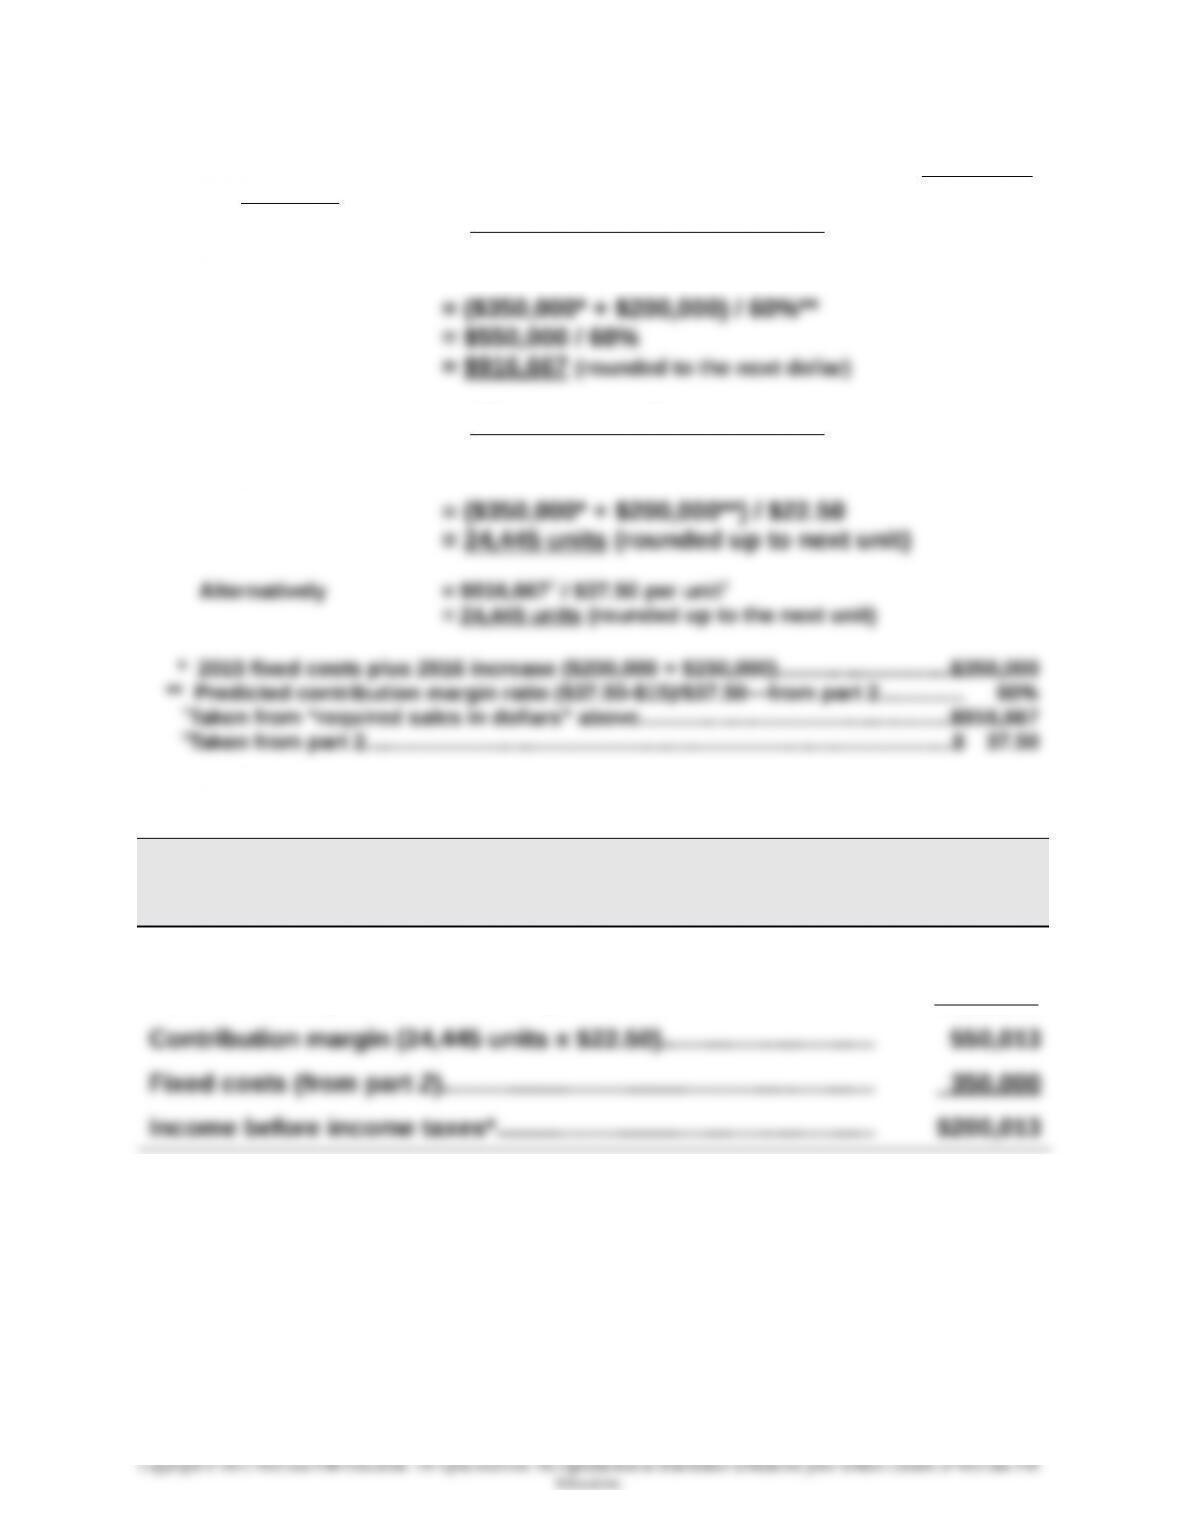
Part 4 Instructor note: Use equations in Exhibit 21.22 and 21.23 with predicted
numbers
(Fixed costs + Pretax income)
Required sales in dollars = Contribution margin ratio
(Fixed costs + Pretax income)
Required sales in units = Contribution margin per unit
Part 5
RIVERA COMPANY
Forecasted Contribution Margin Income Statement
For Year Ended December 31, 2016
Sales (24,445 units x $37.50)……………………………………………….. $916,688
Variable costs (24,445 units x $15)………………………………..…….. 366,675
*Slightly greater than the targeted $200,000 pretax income due to rounding of units from
part 4.
21-1217

Chapter 21 – Cost-Volume-Profit Analysis
Problem 21-5B (65 minutes)
Part 1 Instructor note: Use the equation in Exhibit 21.12
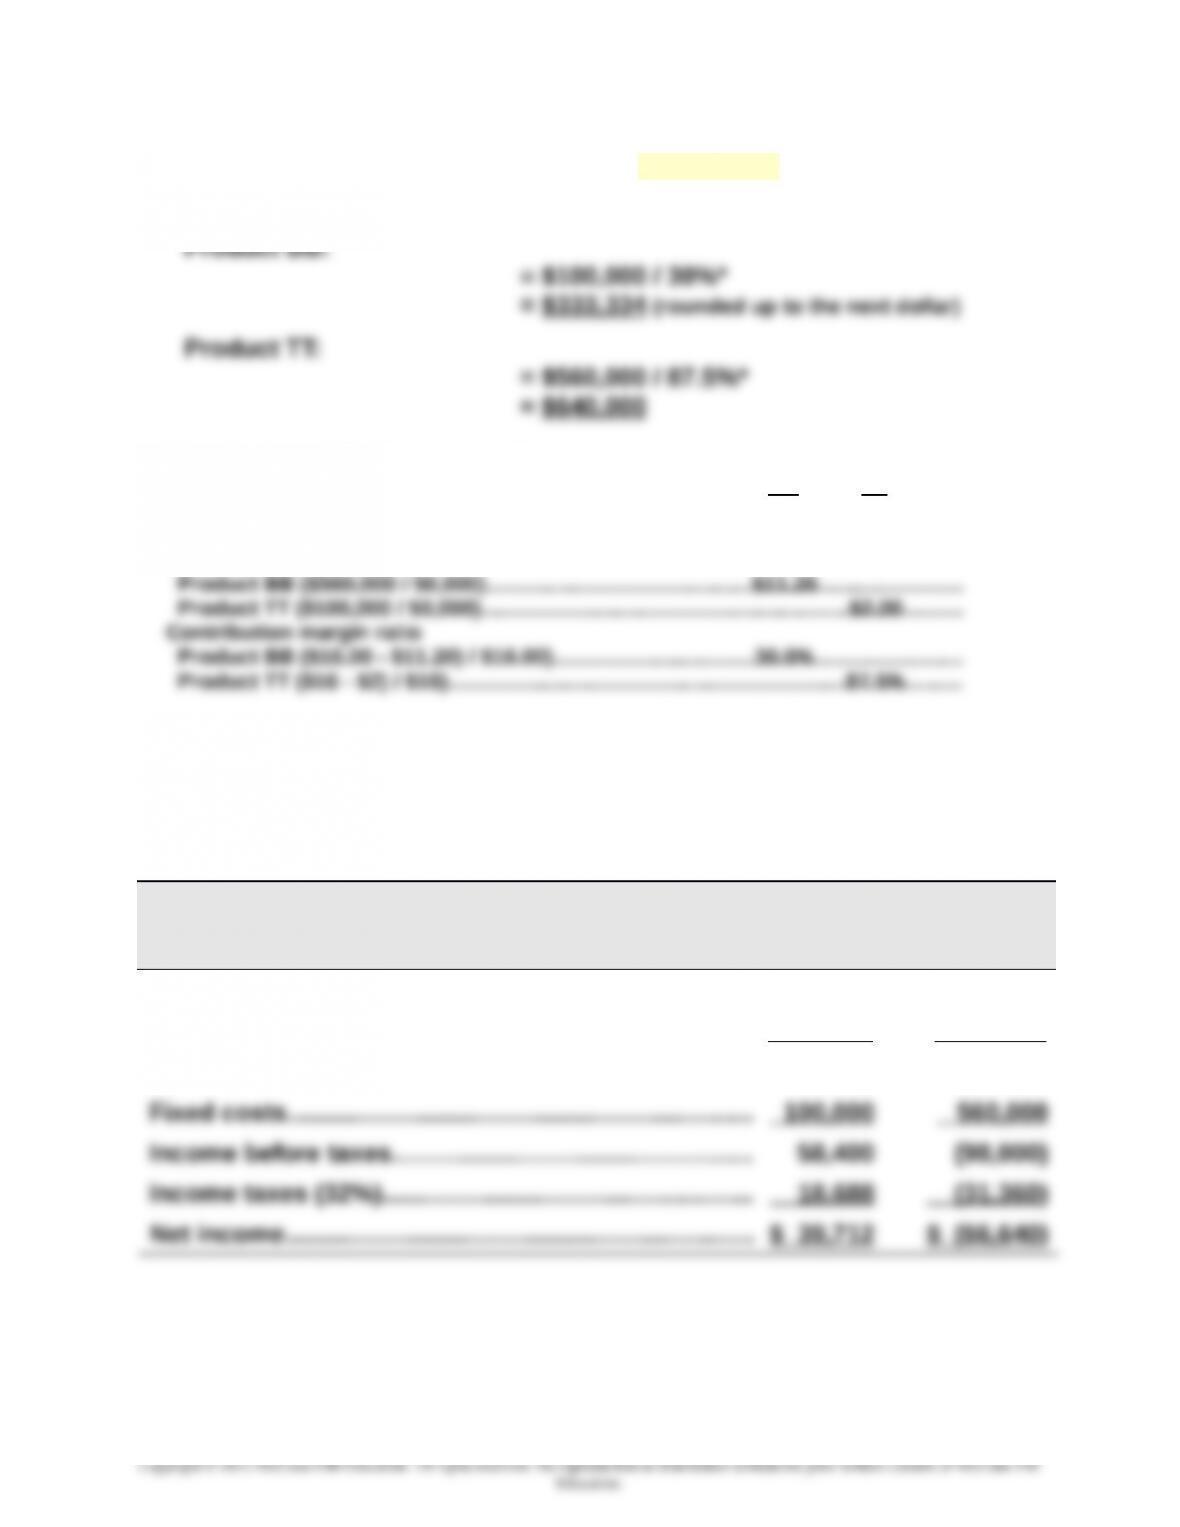
Break-even in dollar sales = Fixed costs / Contribution margin ratio
*To compute contribution margin ratio
Sales price per unit
Product BB ($800,000 / 50,000)…………………………………………………………………..…
Product TT ($800,000 / 50,000)……………………………………………...…..……..…..……..
BB
$16.00
TT
$16.00
Variable costs per unit
Part 2
Forecasted contribution margin income statements for each product
assuming sales decline to 33,000 units with no change in unit sales price
STAM CO.
Forecasted Contribution Margin Income Statement
Product BB Product TT
Sales*…………………………………………………………..…….. $528,000 $ 528,000
Variable costs**…………………………………………………… 369,600 66,000
Contribution margin………………………………..………..… 158,400 462,000
Unit sales price and variable costs are computed in Part 1 and used in these computations:
* Product BB sales = 33,000 units x $16; Product TT sales = 33,000 units x $16.
**Product BB variable costs = 33,000 units x $11.20;
Product TT variable costs = 33,000 units x $2.
21-1218

Chapter 21 – Cost-Volume-Profit Analysis
Problem 21-5B (Continued)
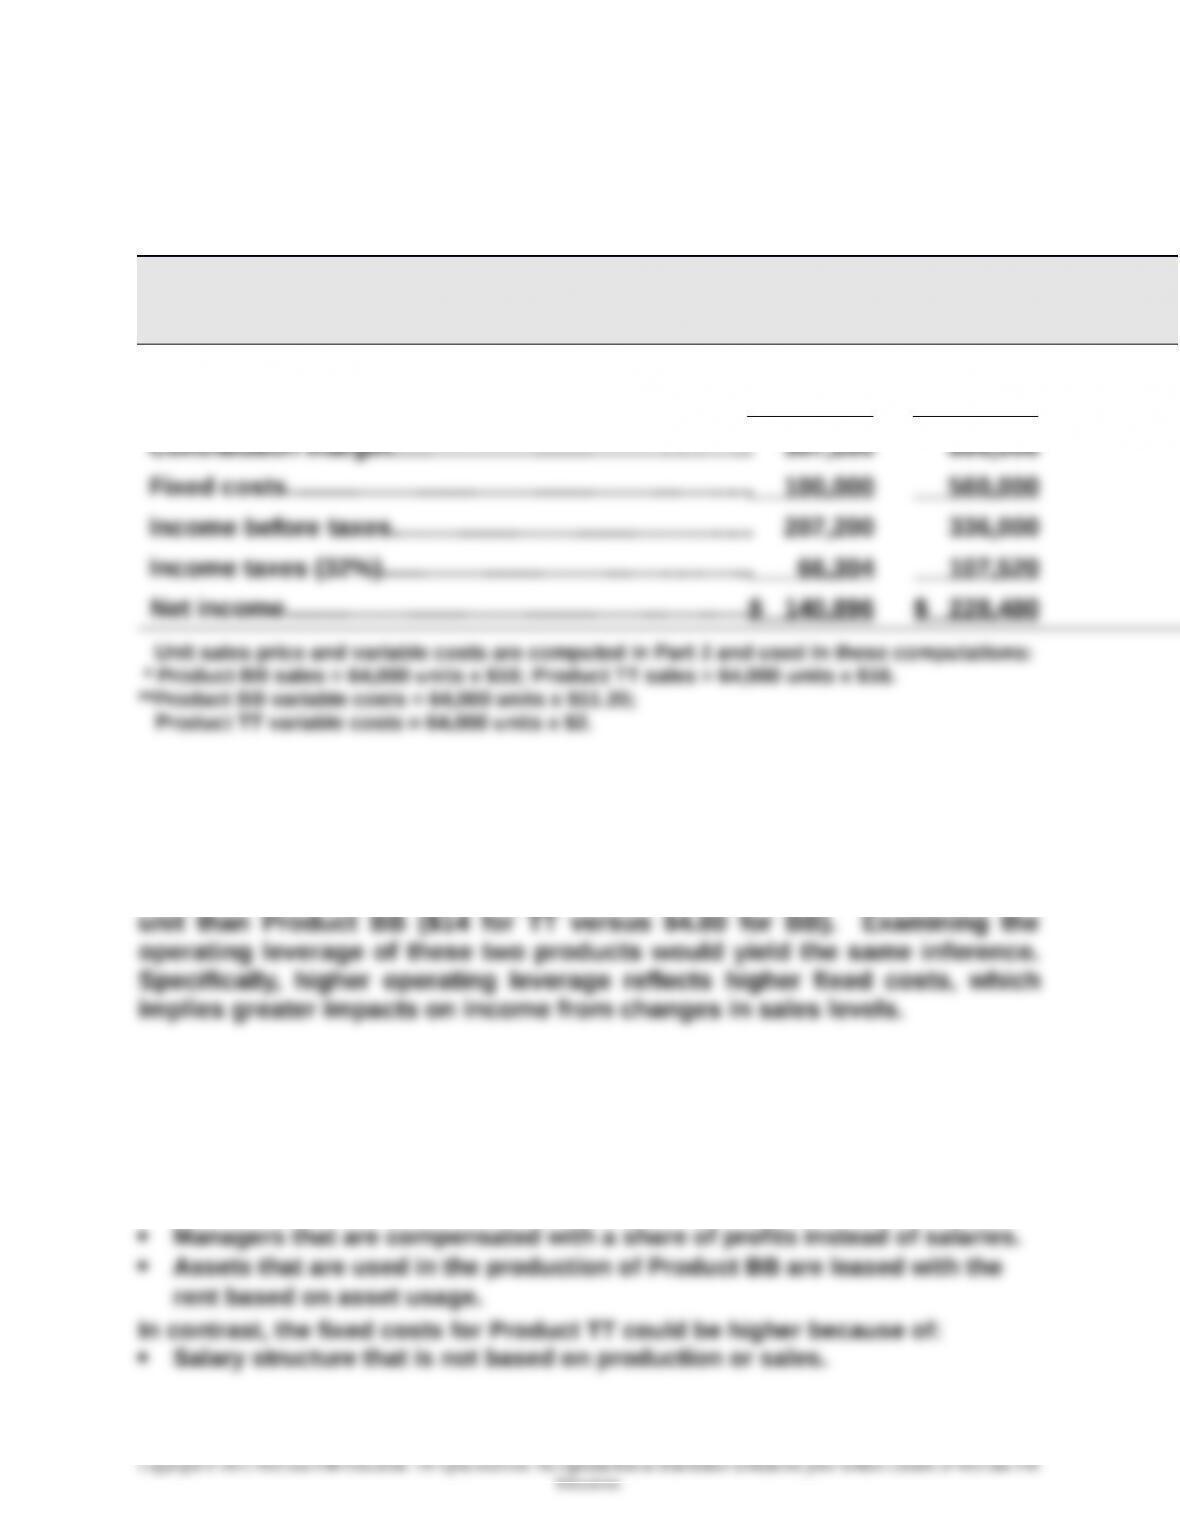
Forecasted contribution margin income statements for each product
assuming sales increase to 64,000 units with no change in unit sales price:
STAM CO.
Forecasted Contribution Margin Income Statement
Product BB Product TT
Sales*…………………………………………………………..……..$1,024,000 $1,024,000
Variable costs**…………………………………………………… 716,800 128,000
Part 4
If sales were to greatly increase, Product TT would experience the greater
increase in income because it would gain more contribution margin per
Part 5
Factors that could cause Product BB to have lower fixed costs include:
Labor arrangement that pays workers for units produced.
Sales representatives that work totally on commission.
21-1219
21-1220