Problem 21-5A (Continued)
Part 3 Forecasted contribution margin income statements for each product
assuming sales increase to 60,000 units with no change in unit sales price
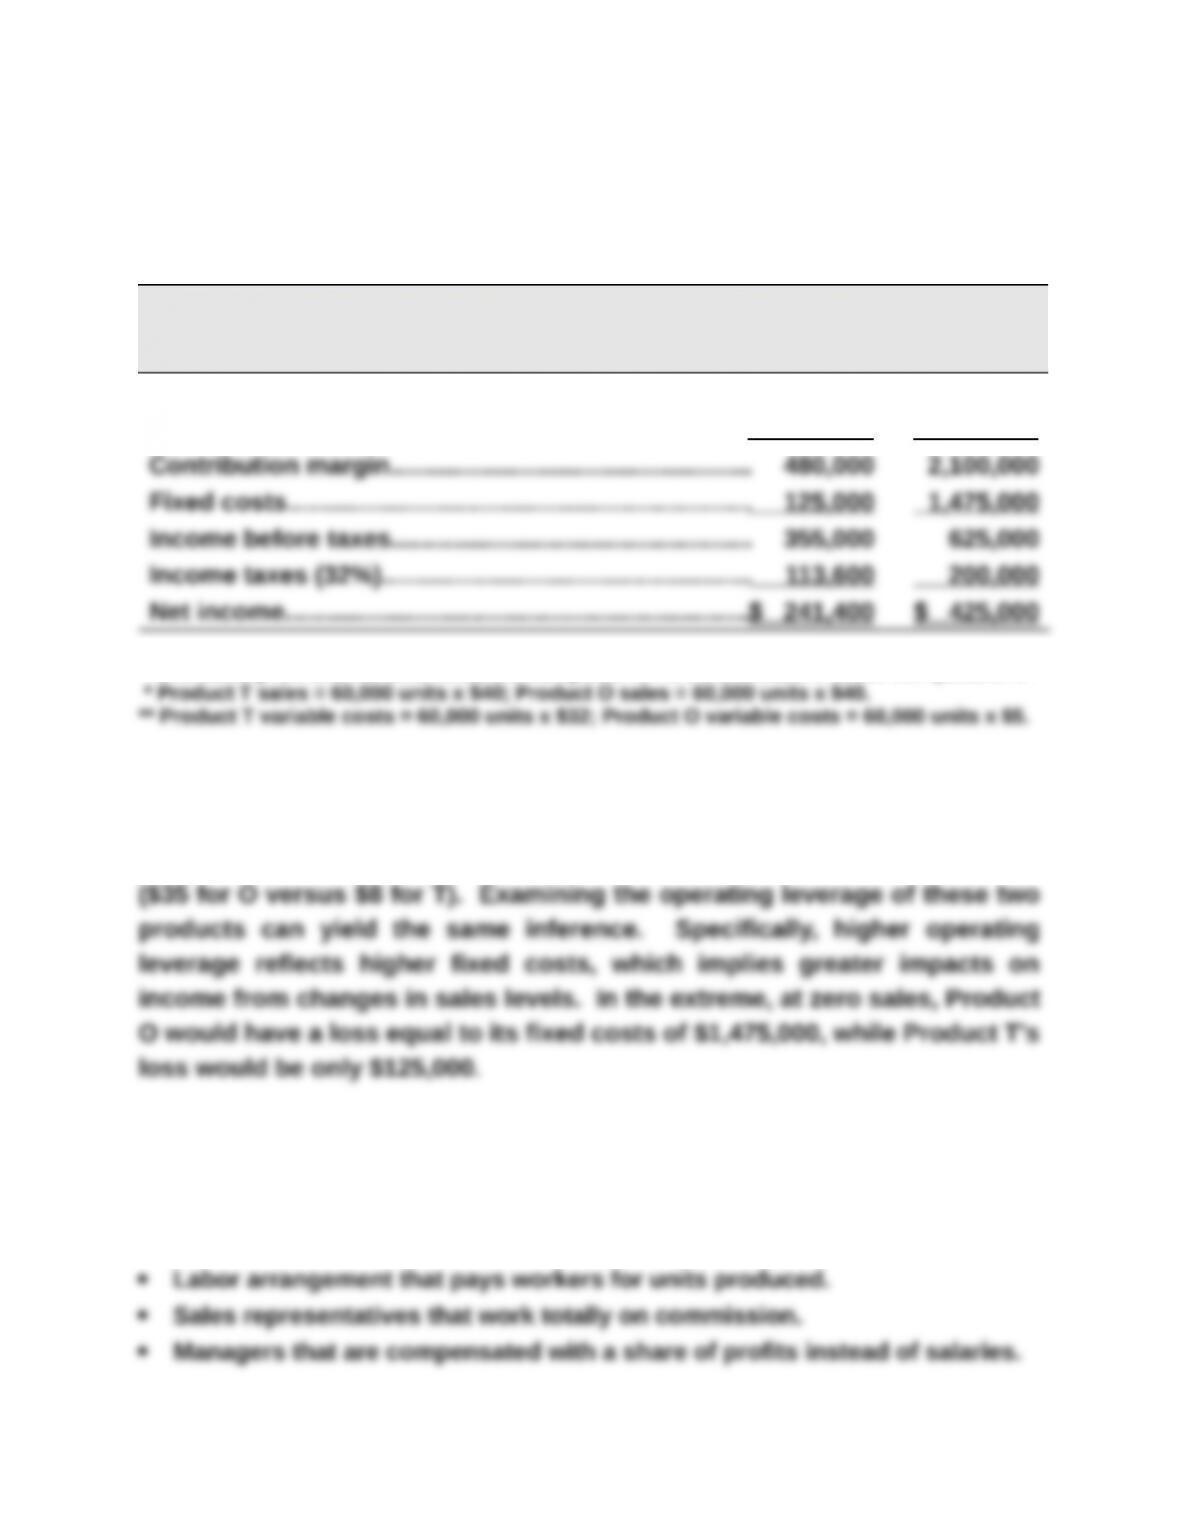
HENNA CO.
Forecasted Contribution Margin Income Statement
Product T Product O
Sales*………………………………………………………………..$2,400,000 $2,400,000
Variable costs**…………………………………………………. 1,920,000 300,000
Unit sales price and variable costs are computed in Part 1 and used in these computations:
Part 4
If sales were to greatly decrease, Product O would suffer the greater loss
because it would lose more contribution margin per unit than Product T
Part 5
Factors that could cause Product T to have lower fixed costs might include:
In contrast, fixed costs for Product O may be higher because of:
Problem 21-6A (45 minutes)
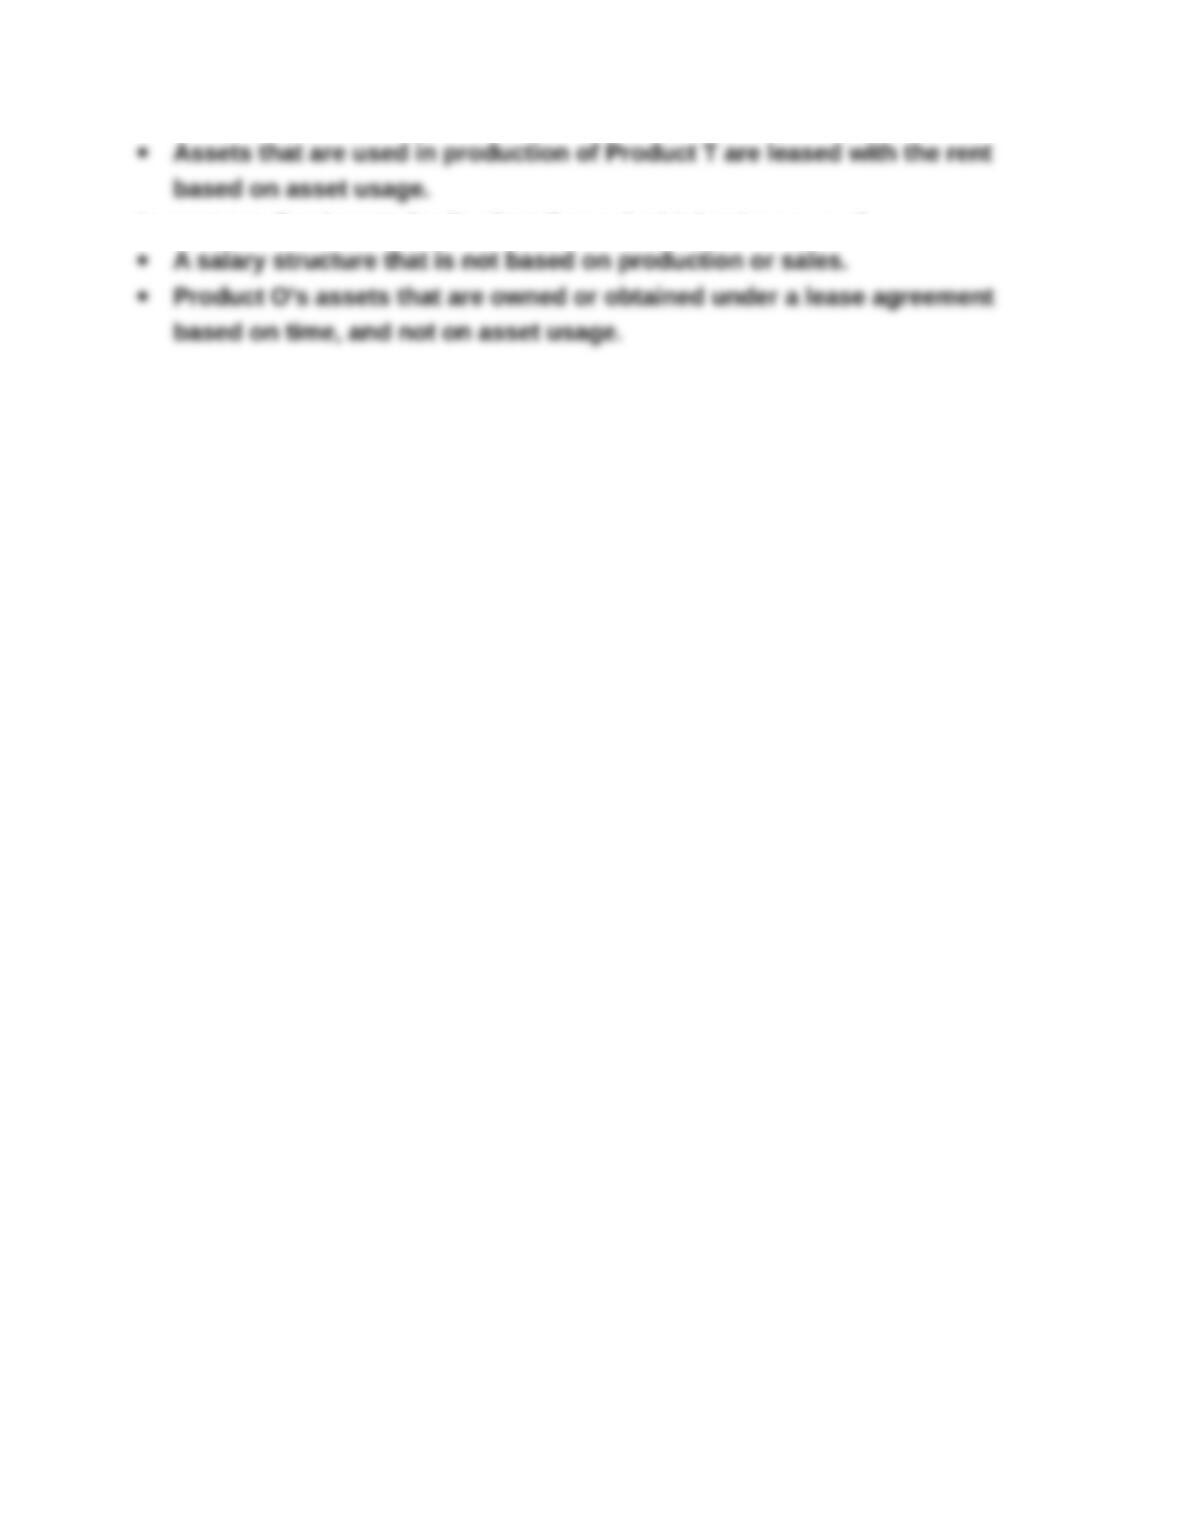
Part 1 Instructor note: Use the equation in Exhibit 21.12
Break-even in dollar sales = Fixed costs / Contribution margin ratio
Plan 1:
*To compute contribution margin ratio
Sales price per unit
Plan 1 (no change)………………………………………………………………………………………….
Plan 2 [$25.00 x (1 + 20%)]………………………………………………………………………………
Plan 1
$25.00
Plan 2
$30.00
Total variable costs per unit (both Plans 1 and 2)
Part 2
BURCHARD CO.
Forecasted Contribution Margin Income Statement
Plan 1 Plan 2
Sales*………………………………………………………………..$1,000,000 $1,080,000
Variable costs**…………………………………………………. 300,000 270,000
Unit sales price and variable costs are computed in Part 1 and used in these computations:
Problem 21-7A (50 minutes)
Part 1 BREAK–EVEN ANALYSIS ASSUMING USE OF SAME MATERIALS
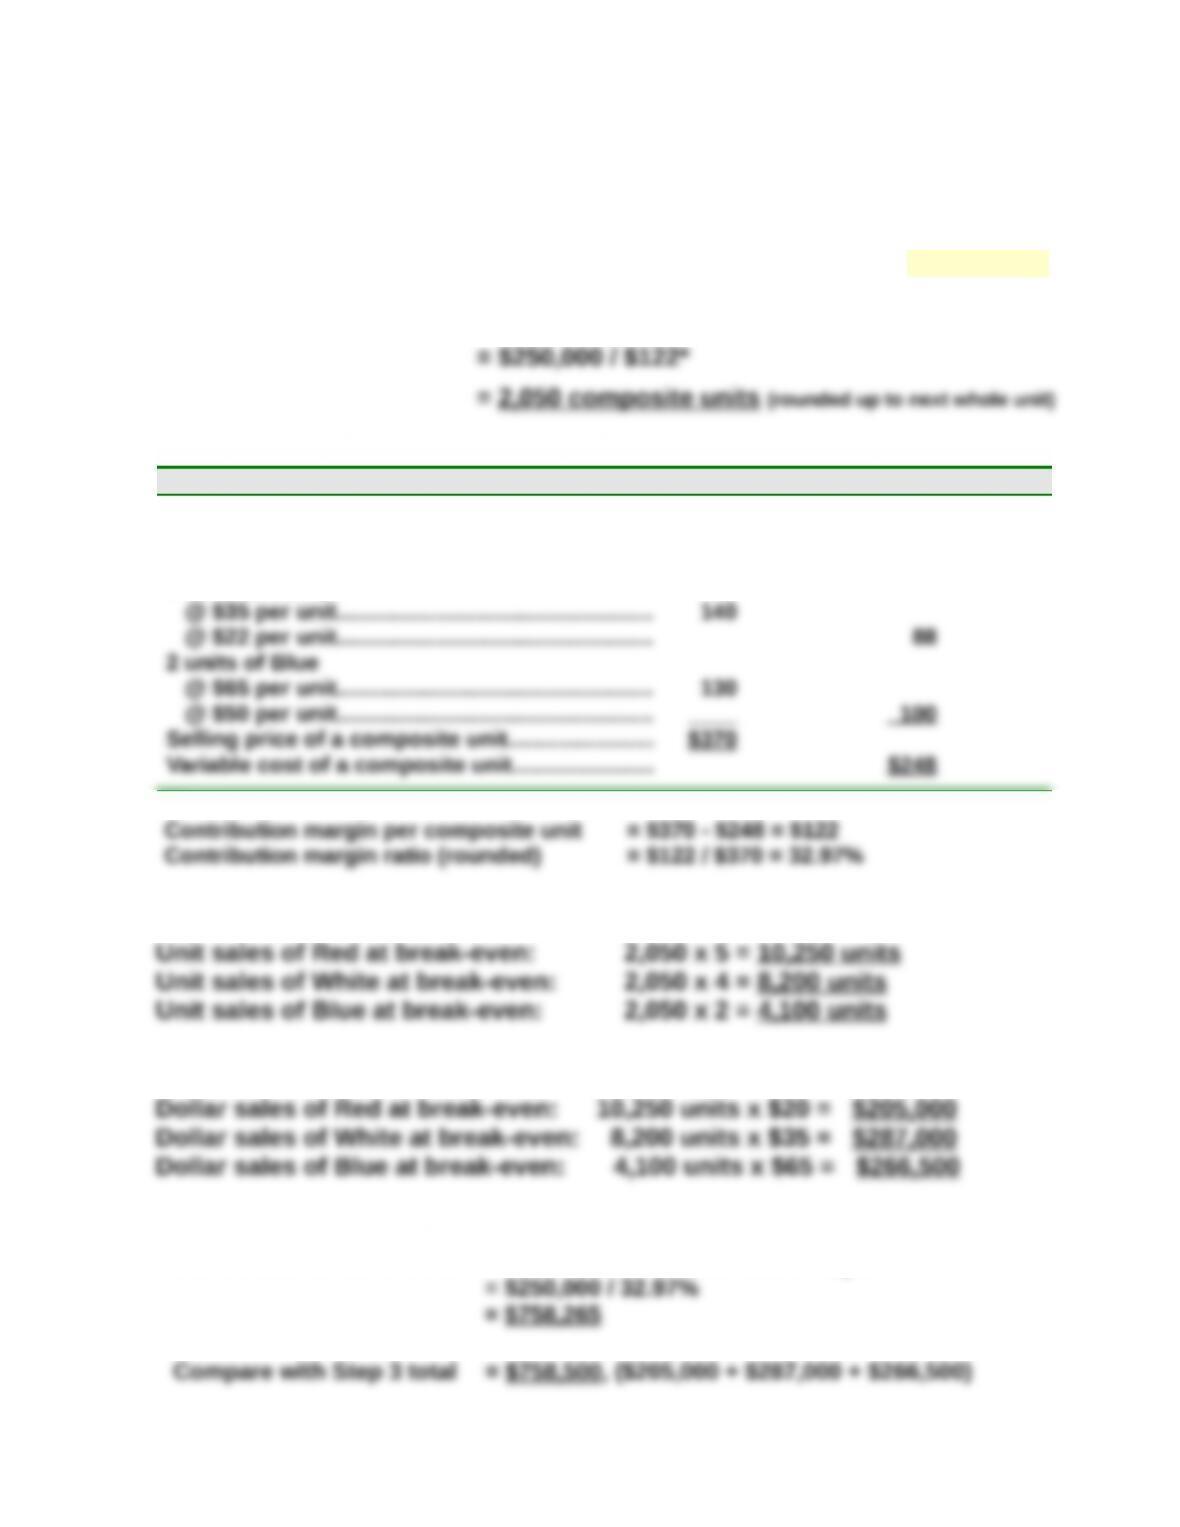
Step 1: Compute break-even in composite units—Use equation in Exhibit 21.29
Break-even in composite units = Fixed costs/Contribution margin per composite unit
*To compute the contribution margin per composite unit
Unit Sales Price Unit Variable Costs
5 units of Red
@ $20 per unit……………………………………………
@ $12 per unit……………………………………………
$100
$ 60
4 units of White
Thus:
Step 2: Compute break-even in individual product unit sales
Step 3: Compute break-even in individual product dollar sales
Crossfoot Step 3 total with that from formula ($235 rounding difference):
Break-even in dollar sales = Fixed costs / Contribution margin ratio
Problem 21-7A (Continued)
Part 2 BREAK–EVEN ANALYSIS ASSUMING USE OF NEW MATERIALS
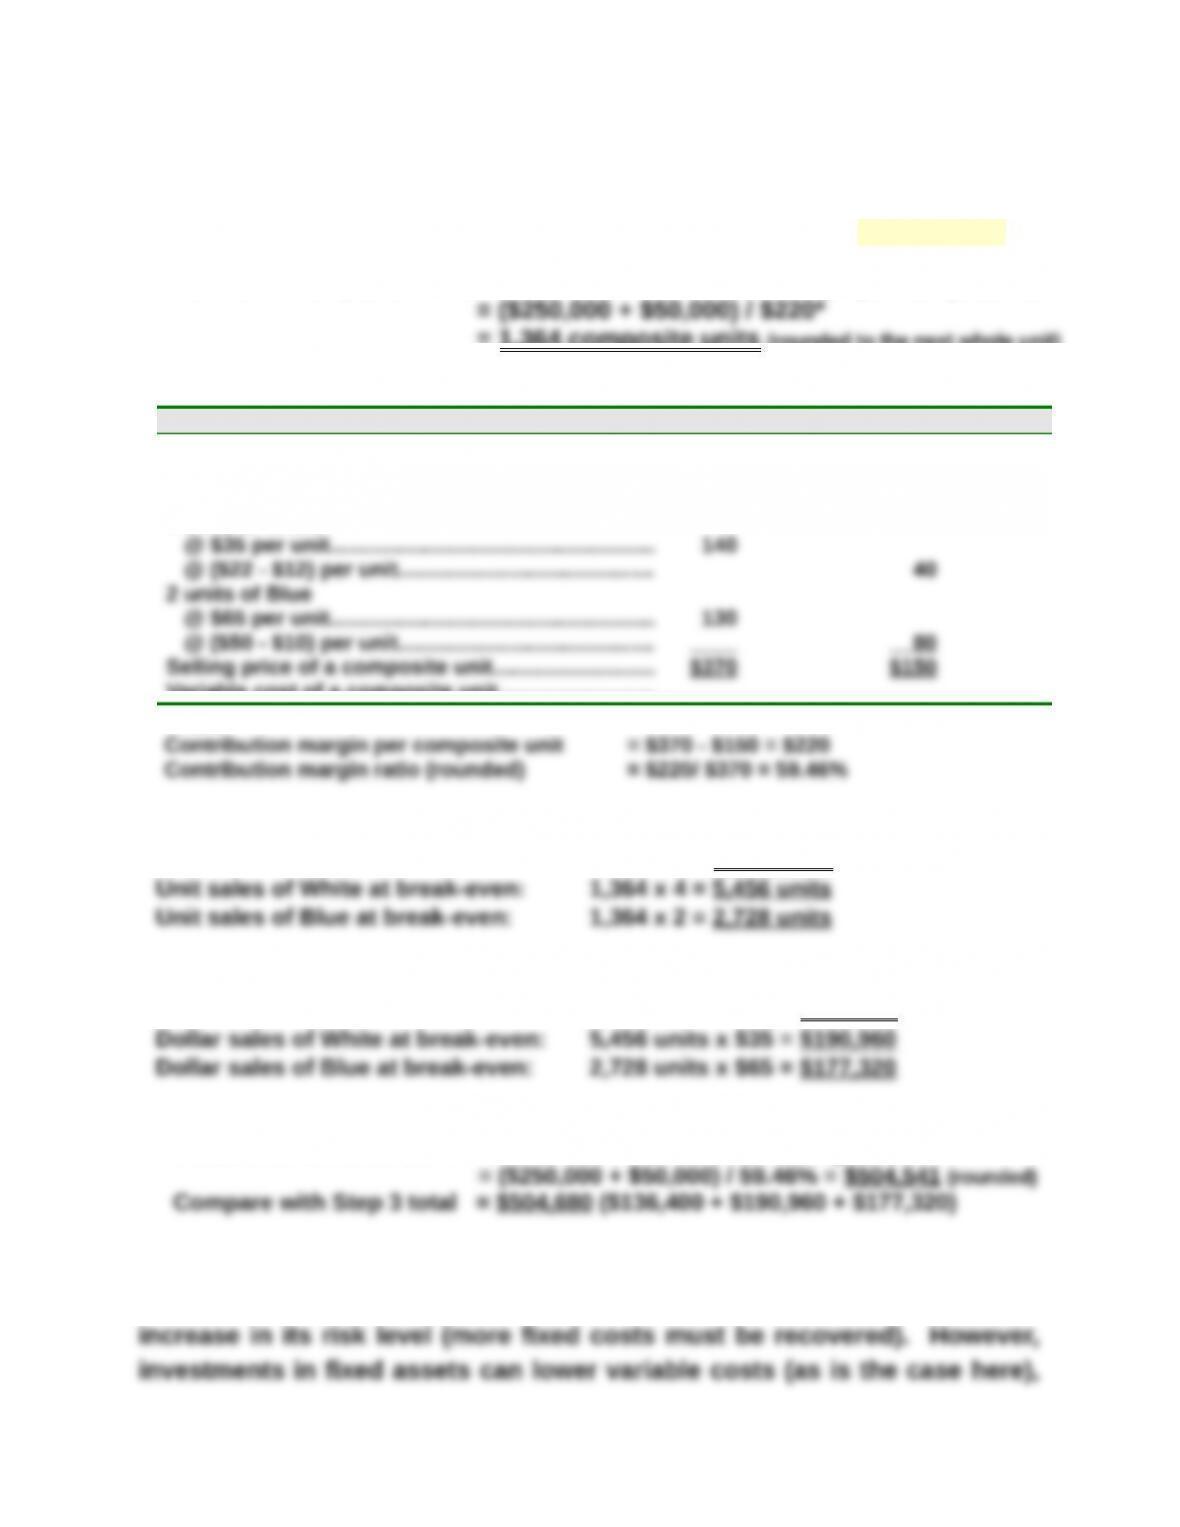
Step 1: Compute break-even in composite units—Use equation in Exhibit 21.29
Break-even in composite units = Fixed costs/Contribution margin per composite unit
= 1,364 composite units (rounded to the next whole unit)
*To compute the contribution margin per composite unit
Unit Sales Price Unit Variable Costs
5 units of Red
@ $20 per unit………………………………………………..
@ ($12 – $6) per unit……………………………………….
$100
$ 30
4 units of White
Variable cost of a composite unit………………………
Thus:
Step 2: Compute break-even in individual product unit sales
Unit sales of Red at break-even: 1,364 x 5 = 6,820 units
Step 3: Compute break-even in individual product dollar sales
Dollar sales of Red at break-even: 6,820 units x $20 = $136,400
Crossfoot Step 3 total with that from formula ($139 rounding difference):
Break-even in dollar sales = Fixed costs / Contribution margin ratio
Part 3
When a business invests in fixed assets, as in this case, there is an

PROBLEM SET B
Problem 21-1B (25 minutes)
Parts 1 and 2
Gilmore Company
Contribution Margin Income Statement
For Year Ended December 31, 2015
(12,000 units) Per unit % of sales
Sales ($18 x 12,000)………………………. $216,000 $18.000 100.00%
Variable costs
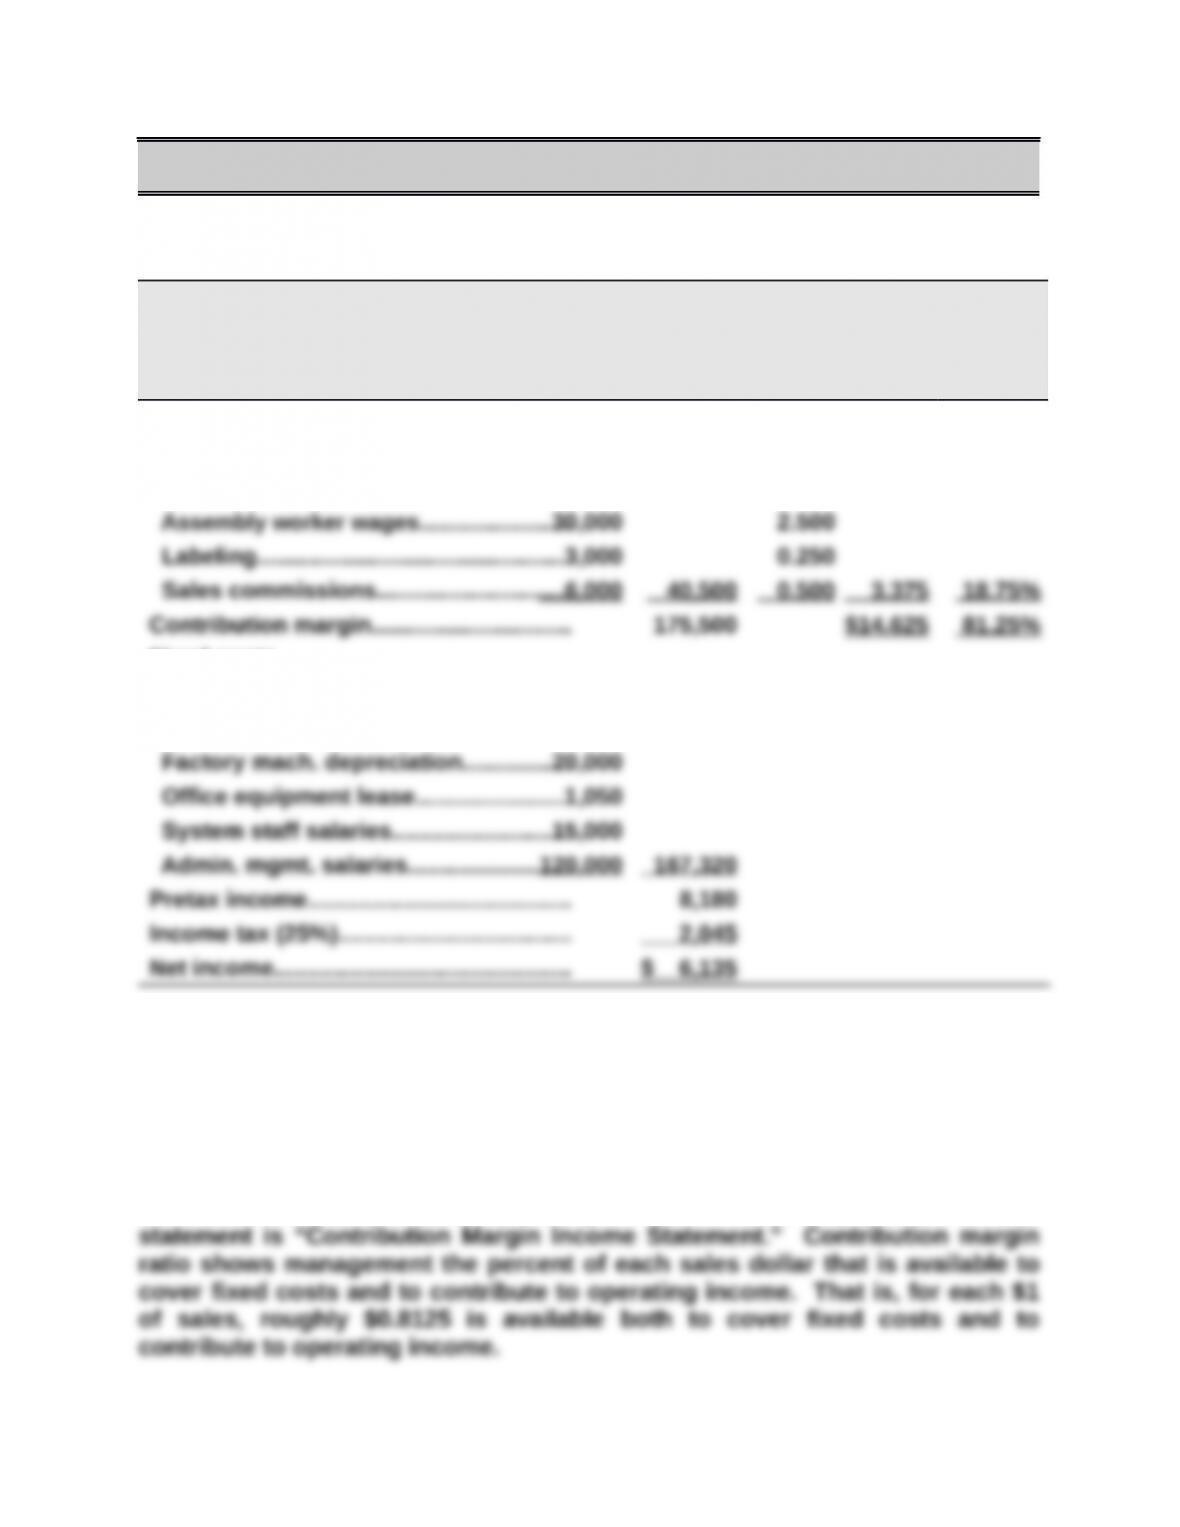
Plastic for CD sets……………………….$ 1,500 $0.125
Fixed costs
Rent on factory………………………………6,750
Factory cleaning service…………………4,520
The contribution margin per unit is $14.625, and the contribution margin ratio is
81.25%.
Part 3 Analysis Component
Contribution margin shows how much of total sales are available to cover
fixed costs and contribute to operating income. This is why the title for this
Sun Company
20
40
60
80
100
$120
Sales Dollars
Total
Costs
Problem 21-2B (45 minutes)
Parts 1 and 2
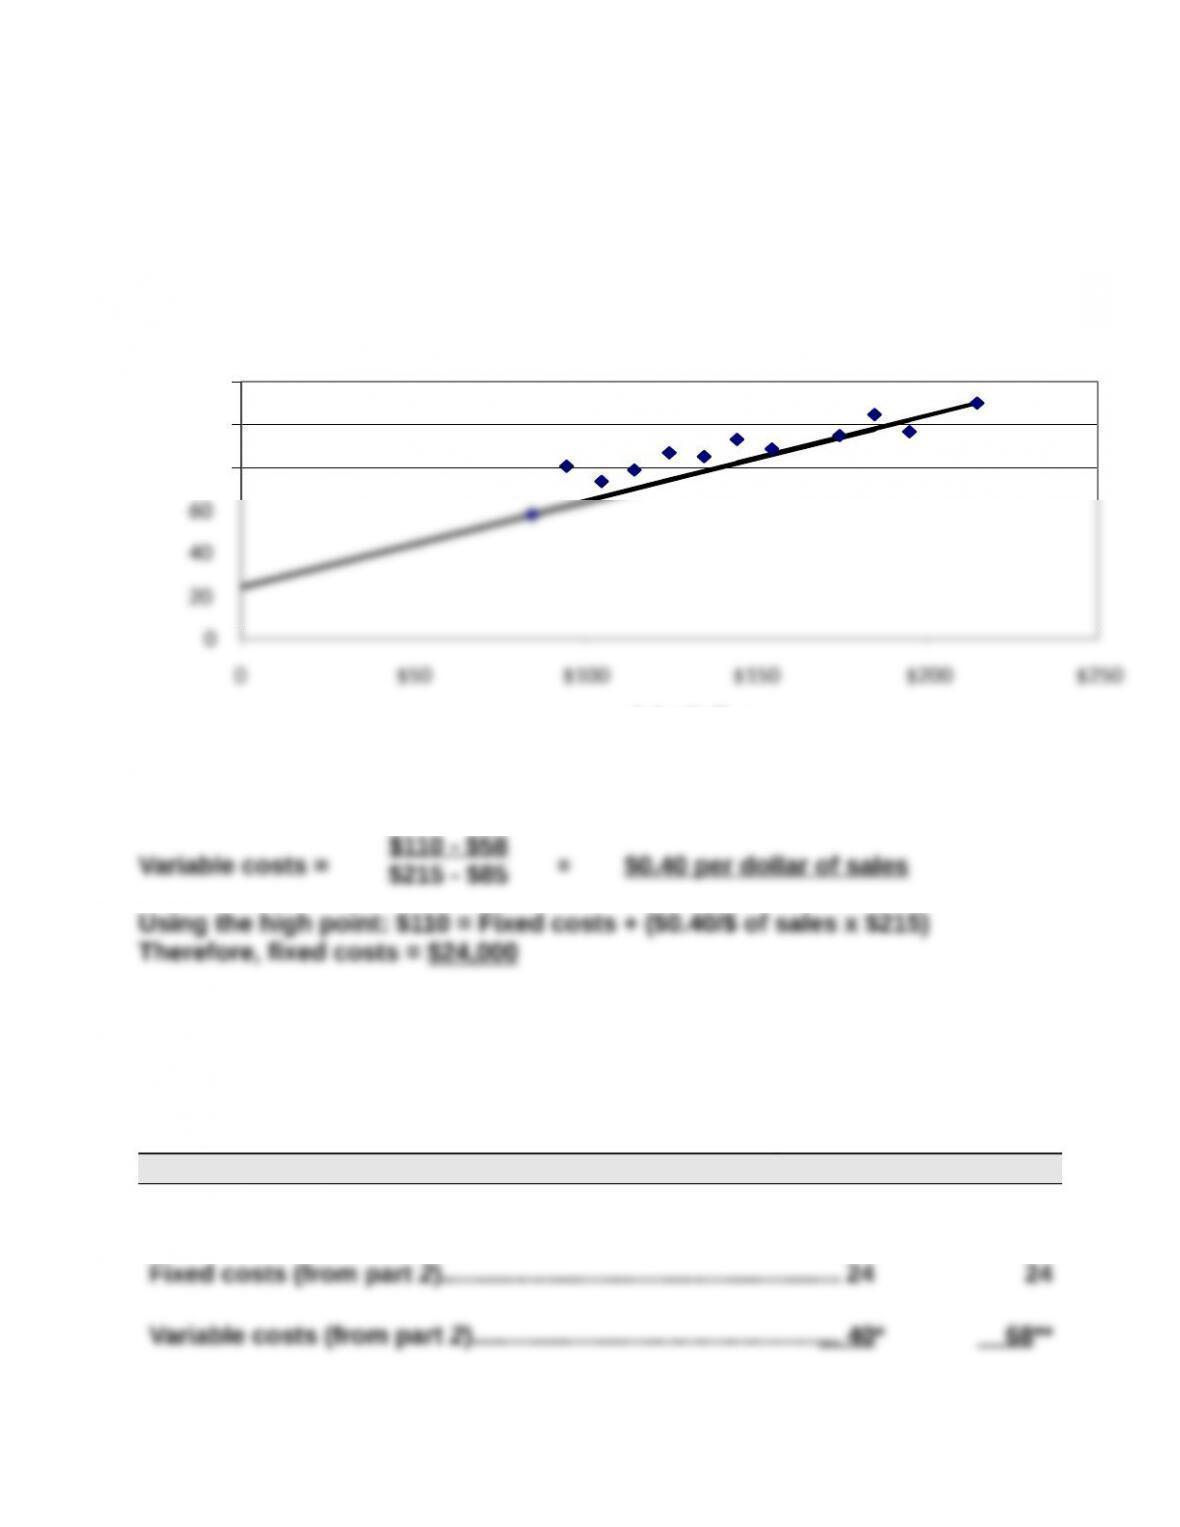
The scatter diagram and its estimated line of cost behavior appear below.
Sales and cost amounts are in thousands of dollars.
Part 2 Calculation of variable and fixed costs
Part 3
The estimates in Part 2 can be used to predict the total costs that will be
incurred at sales levels of $100 and $170 (both in thousands).
(‘000s) Predictions
Sales (given)…………………………………………………………………$100 $170
Fixed costs (from part 2)……………………………………………….. 24 24
Variable costs (from part 2)…………………………………………… 40* 68**
$110 – $58

Problem 21-3B (40 minutes)
Part 1
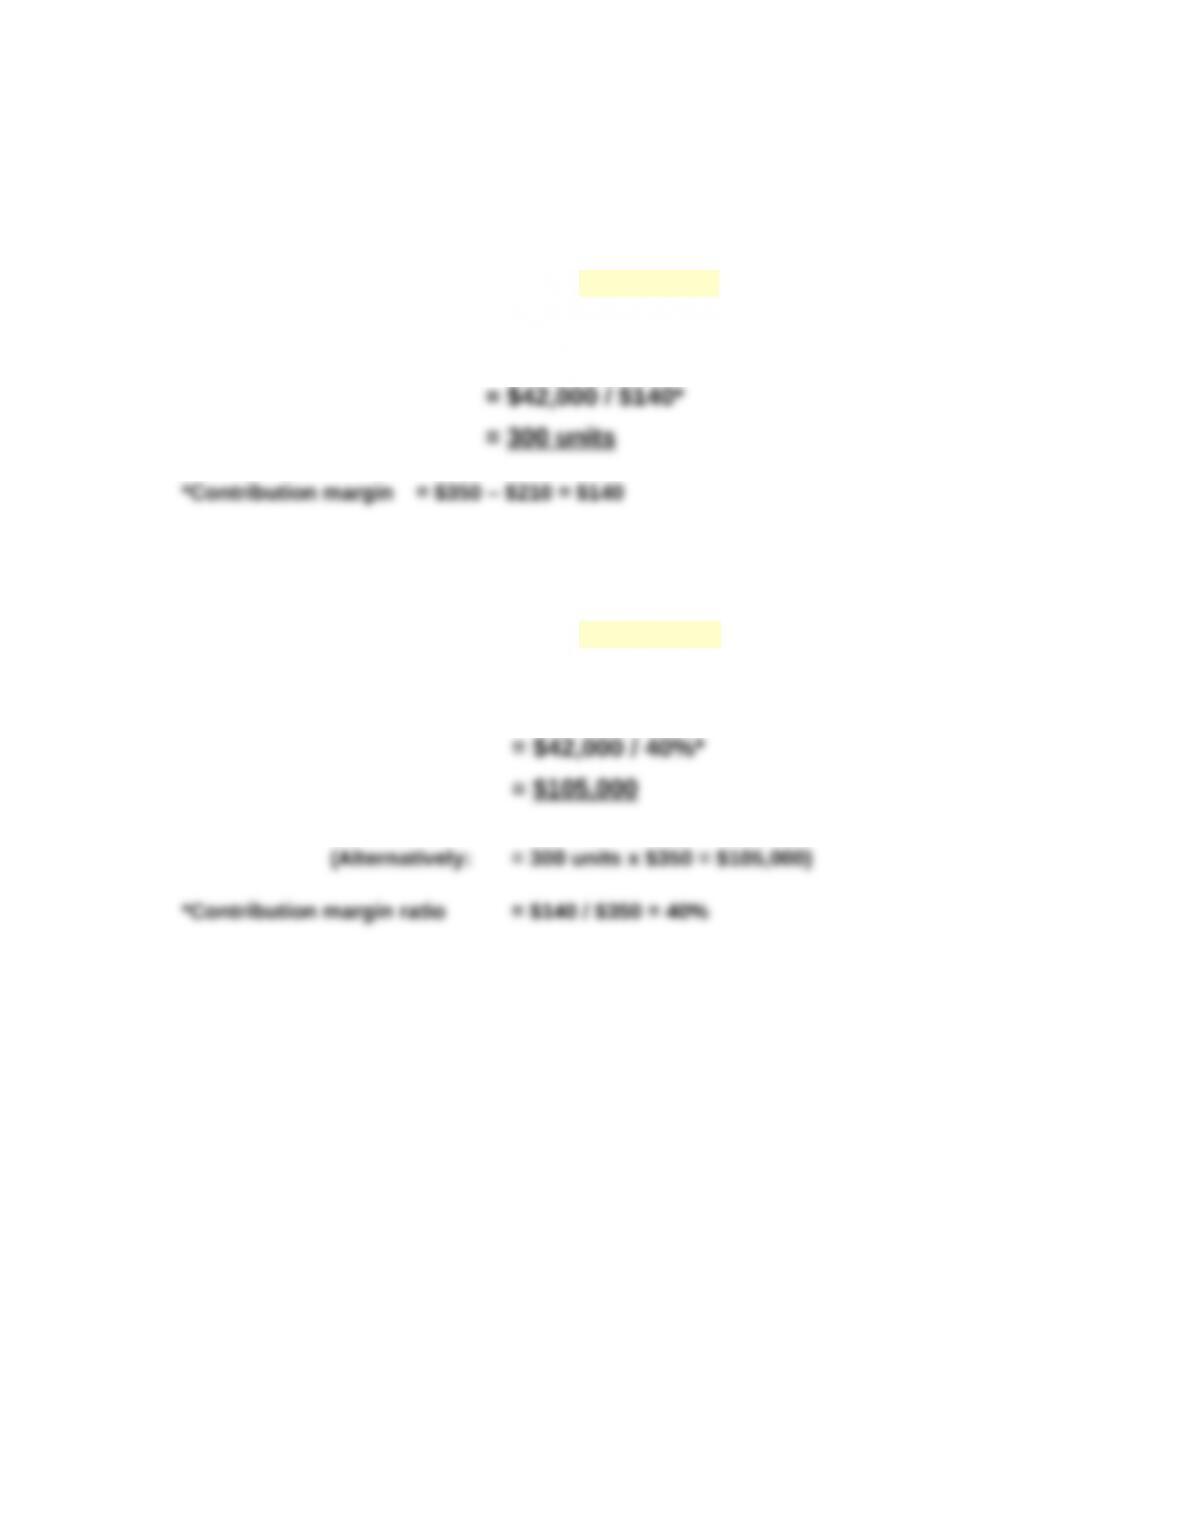
(a) Instructor note: Use the equation in Exhibit 21.11
Break-even in unit sales = Fixed costs / Contribution margin per unit
(b) Instructor note: Use the equation in Exhibit 21.12
Break-even in dollar sales = Fixed costs / Contribution margin ratio
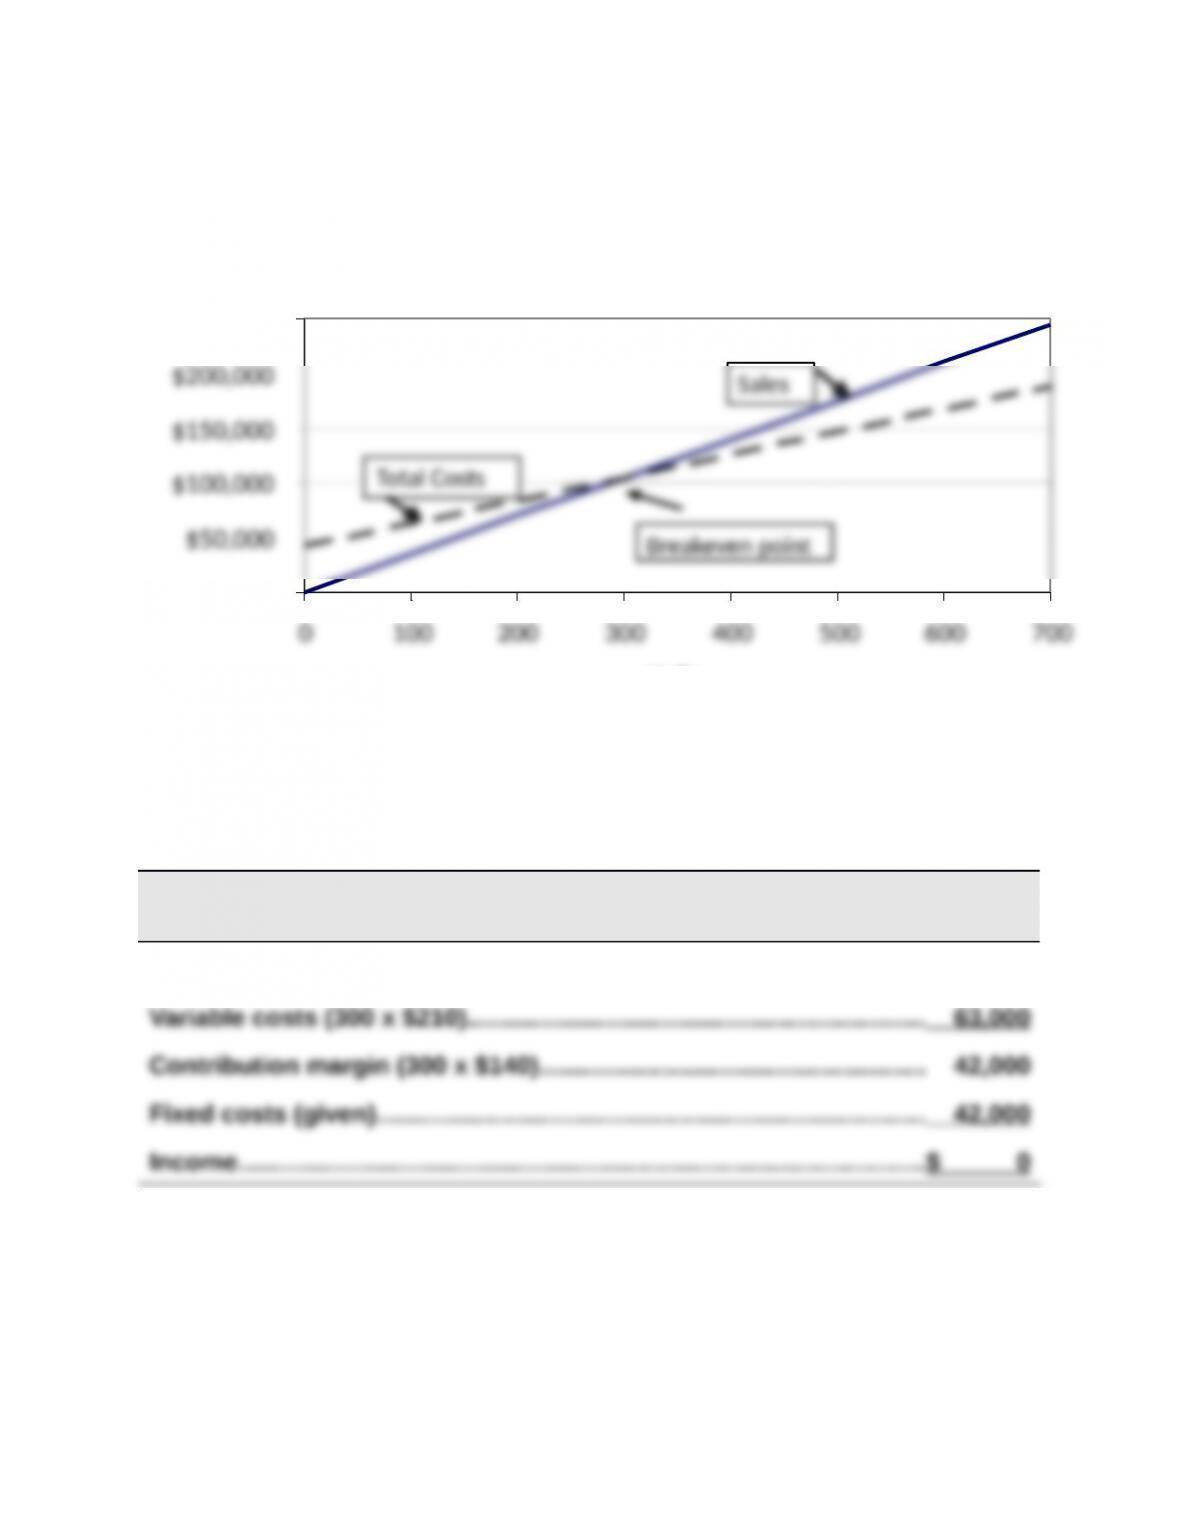
Hip-Hop Company CVP chart
$200,000
$250,000
Units
Problem 21-3B (Continued)
Part 2
Part 3
HIP-HOP CO.
Contribution Margin Income Statement (at Break-Even) — Keyboards
Sales (300 x $350)…………………………………………………………………….$105,000