Chapter 21 – Cost-Volume-Profit Analysis
Exercise 21-25 (10 minutes)
1. Degree of operating leverage = Total contribution margin
Pretax income
= $432,000/$108,000
= 4.0
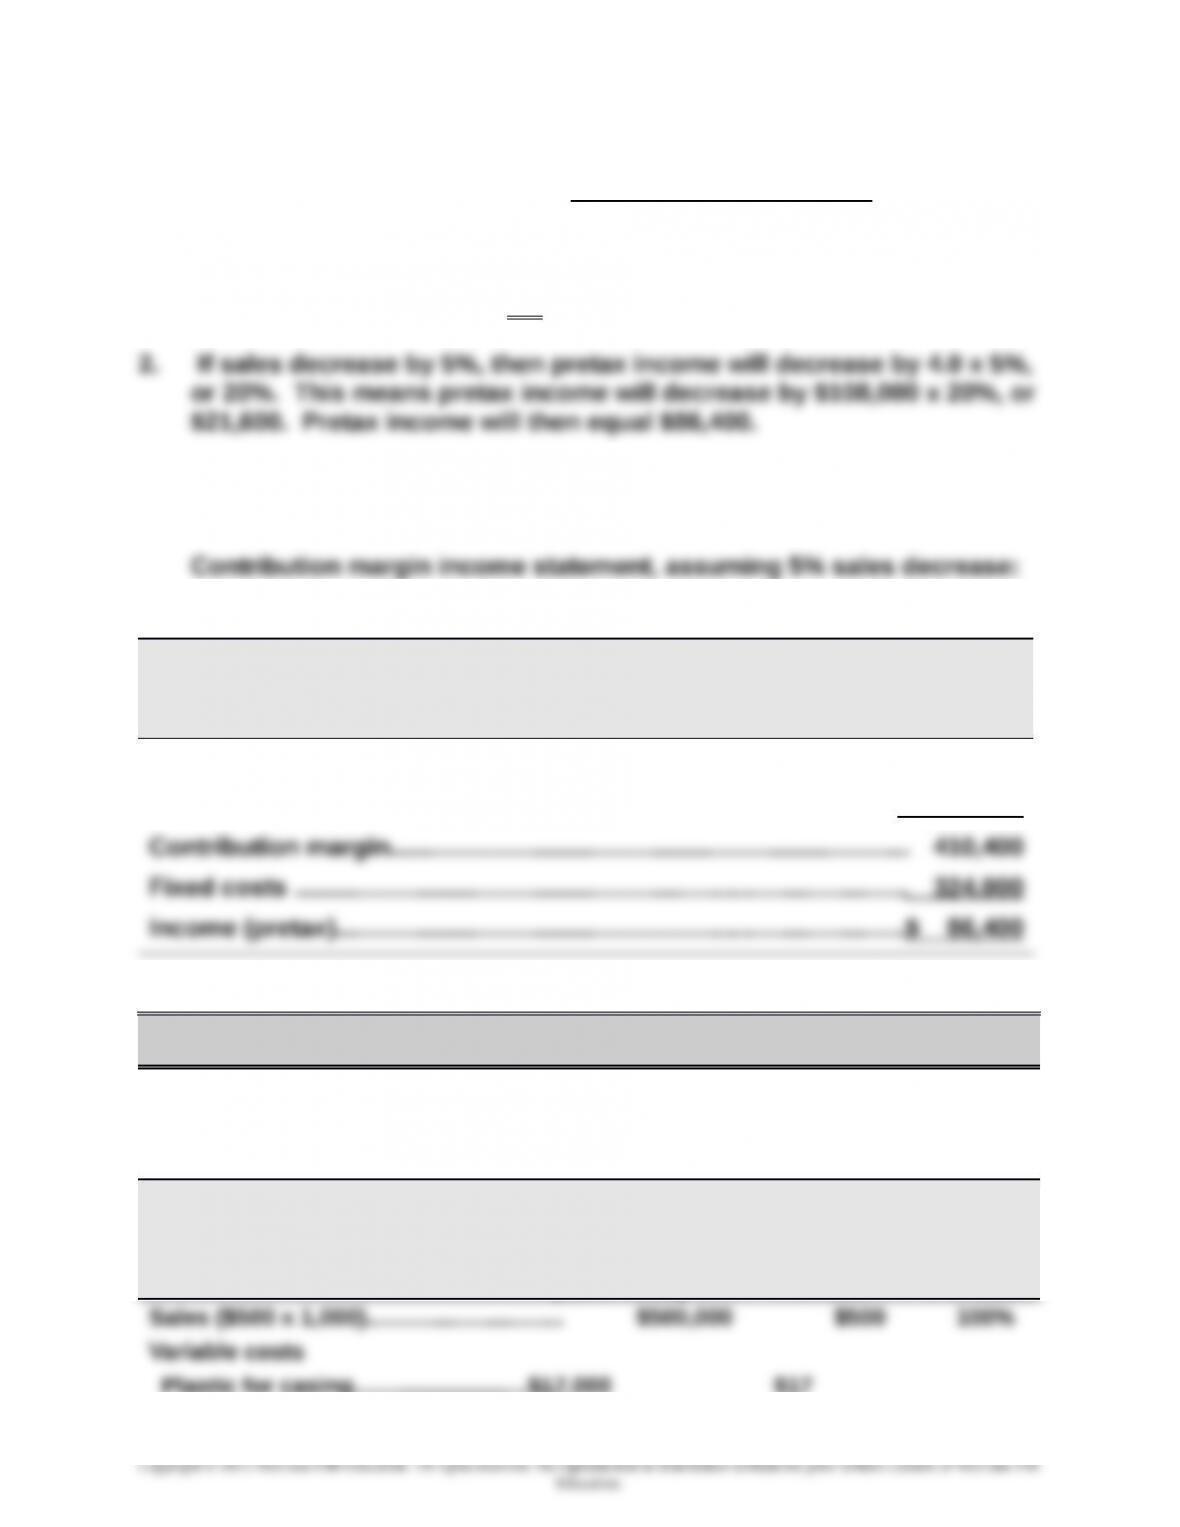
3. If sales decrease by 5%, a total of 9,120 (computed as 9,600 x 95%)
units will be sold.
HUDSON CO.
Forecasted Contribution Margin Income Statement
For Year Ended December 31, 2016
Sales (9,120 x $225)…………………………………………………………………$2,052,000
Variable costs (9,120 x $180)…………………………………………………… 1,641,600
PROBLEM SET A
Problem 21-1A (25 minutes)
Parts 1 and 2
Tight Drums Company
Contribution Margin Income Statement
For Year Ended December 31, 2015
(1,000 units) Per unit % of sales
Plastic for casing…………………………$17,000 $17
21-1209
Chapter 21 – Cost-Volume-Profit Analysis
Assembly worker wages…………..…….82,000 82
Drum stands……..………………………..26,000 26
Sales commissions……………….……. 15,000 140,000 15 140 28%
Contribution margin……………………… 360,000 $360 72%
Fixed costs
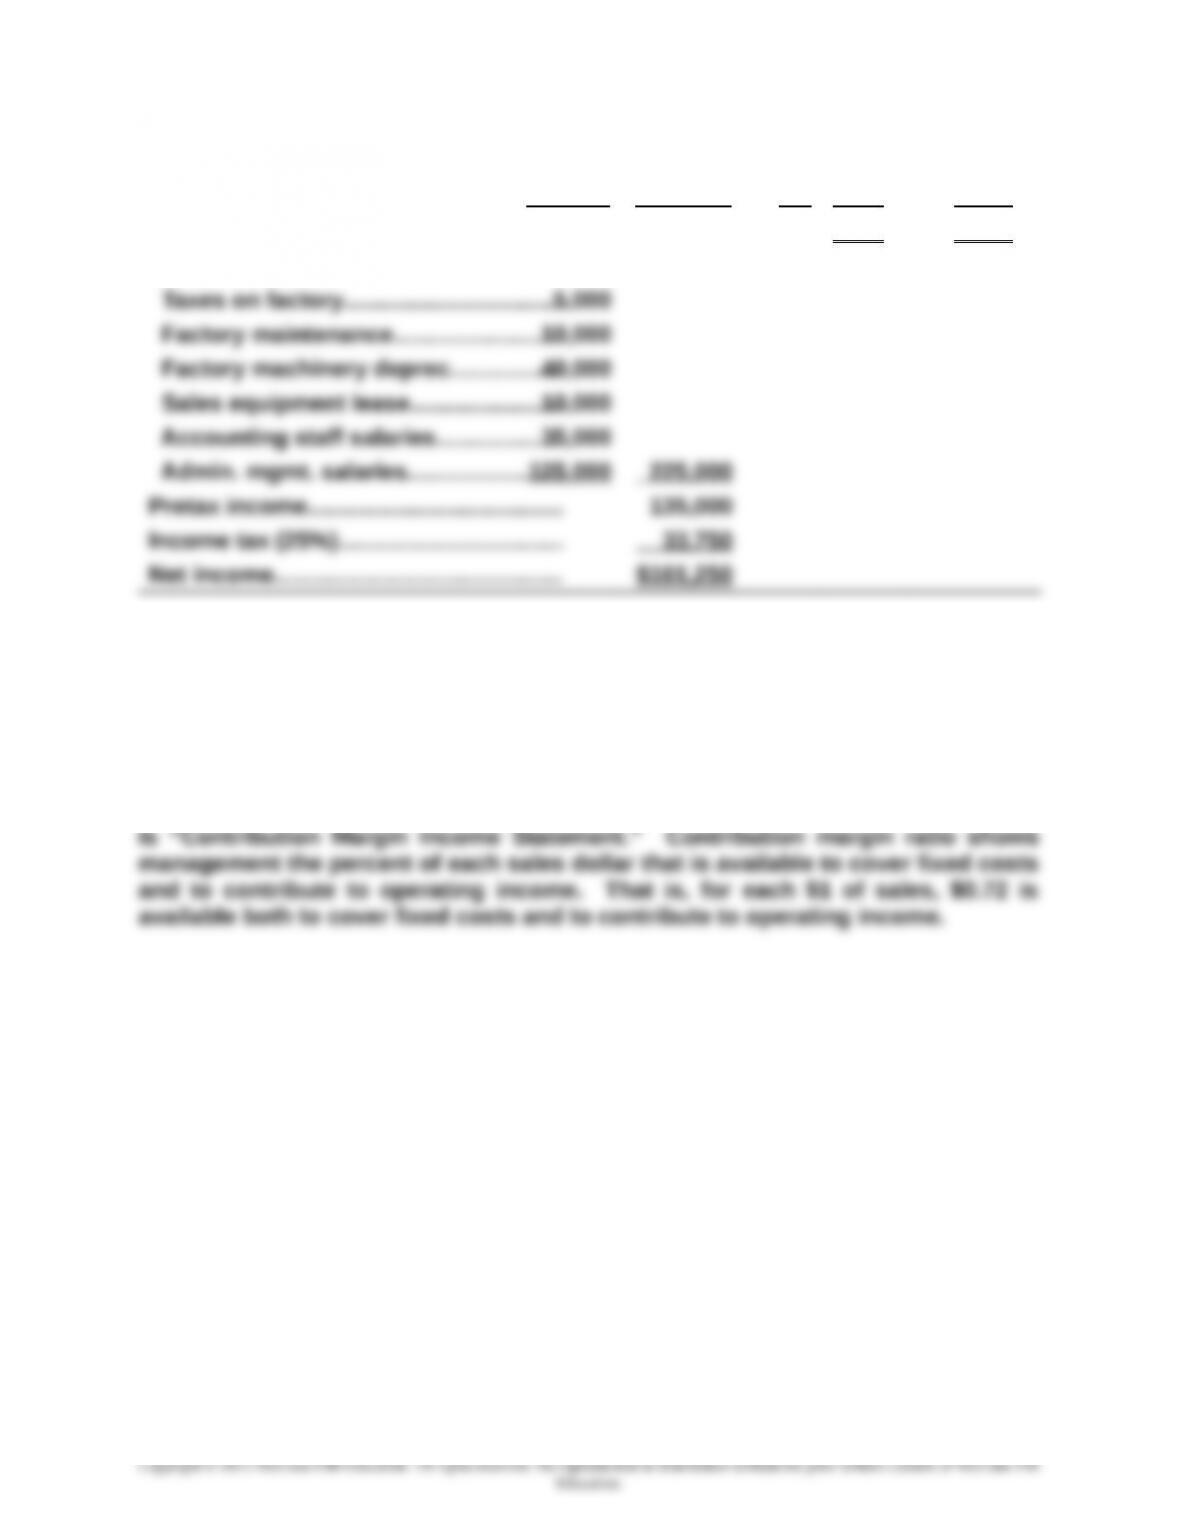
The contribution margin per unit is $360, and the contribution margin ratio is 72%.
Part 3 Analysis Component
Contribution margin shows how much of total sales are available to cover fixed
costs and contribute to operating income. This is why the title for this statement
21-1210
Chapter 21 – Cost-Volume-Profit Analysis
Problem 21-2A (45 minutes)
Parts 1 and 2
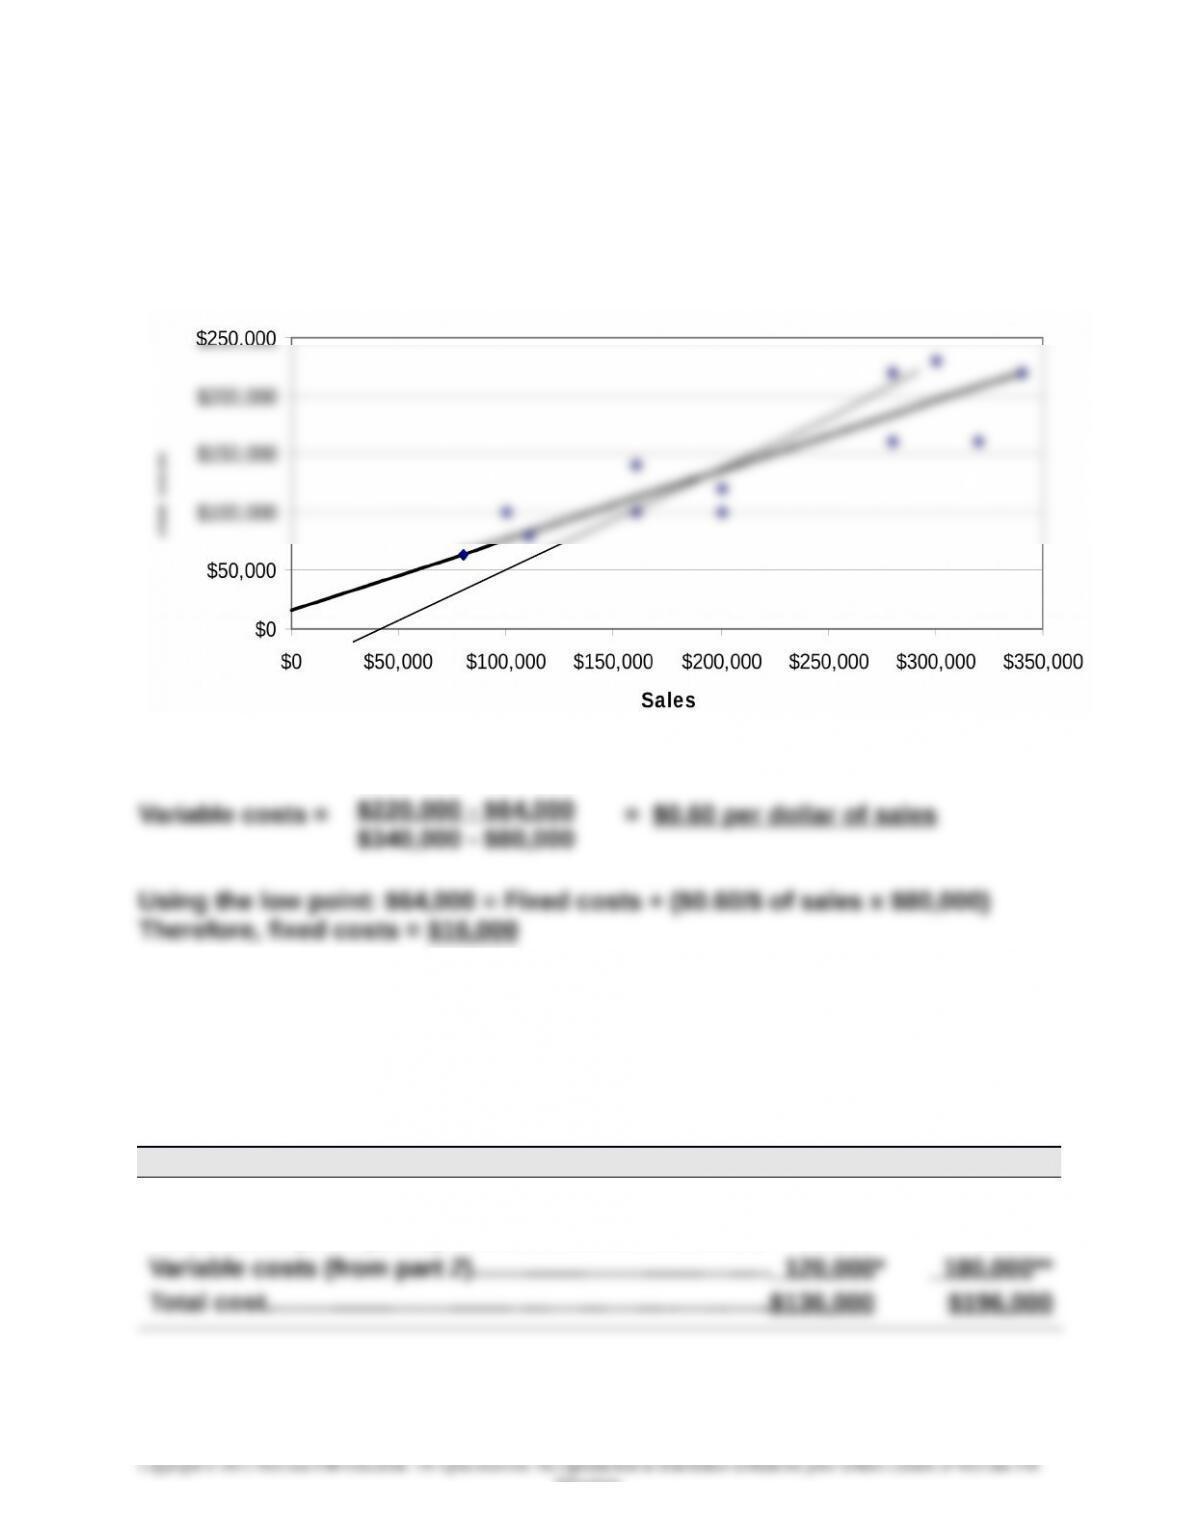
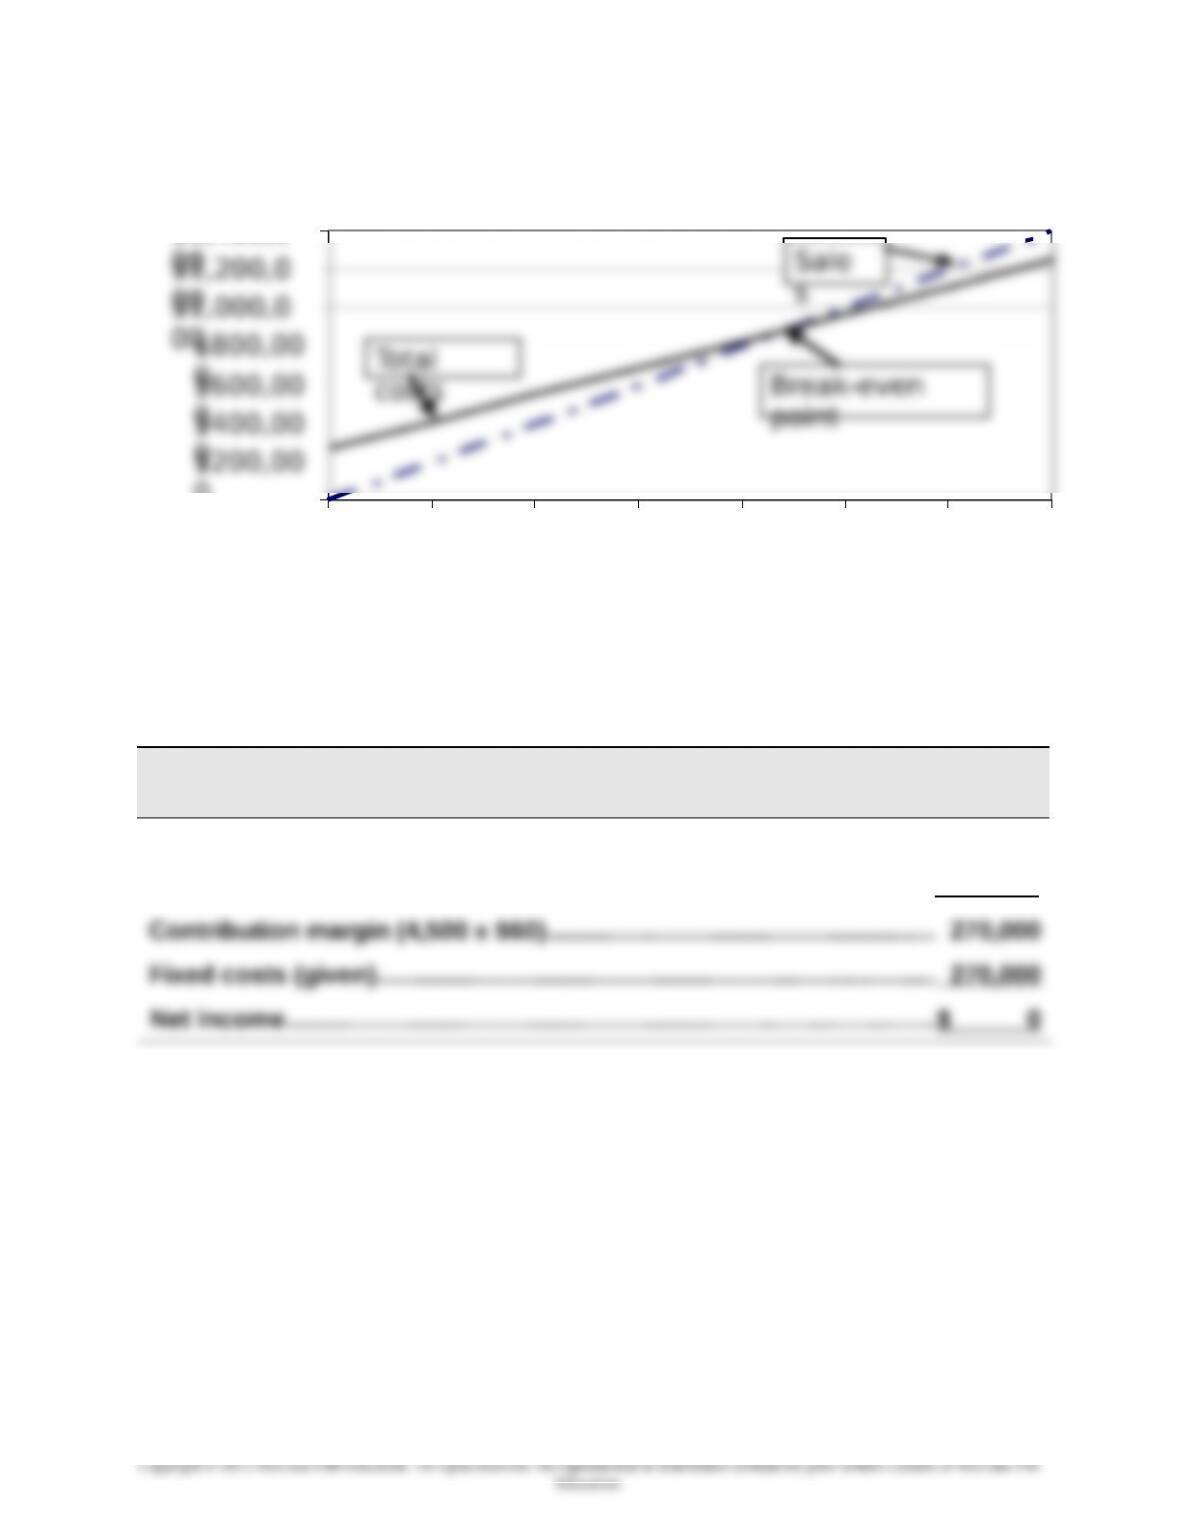
The scatter diagram and its estimated line of cost behavior appear below.
Part 2 – Calculation of variable and fixed costs
Part 3
The estimates in Part 2 can be used to predict the total costs that will be
incurred at sales levels of $200,000 and $300,000.
Predictions
Sales (given)…………………………………………….……………$200,000 $300,000
Fixed costs (from part 2)……………………….………………. 16,000 16,000
* ($200,000 sales) x ($0.60 per sales dollar).
** ($300,000 sales) x ($0.60 per sales dollar).
21-1211
Education.
Alden Co.
Chapter 21 – Cost-Volume-Profit Analysis
Problem 21-3A (40 minutes)
Part 1
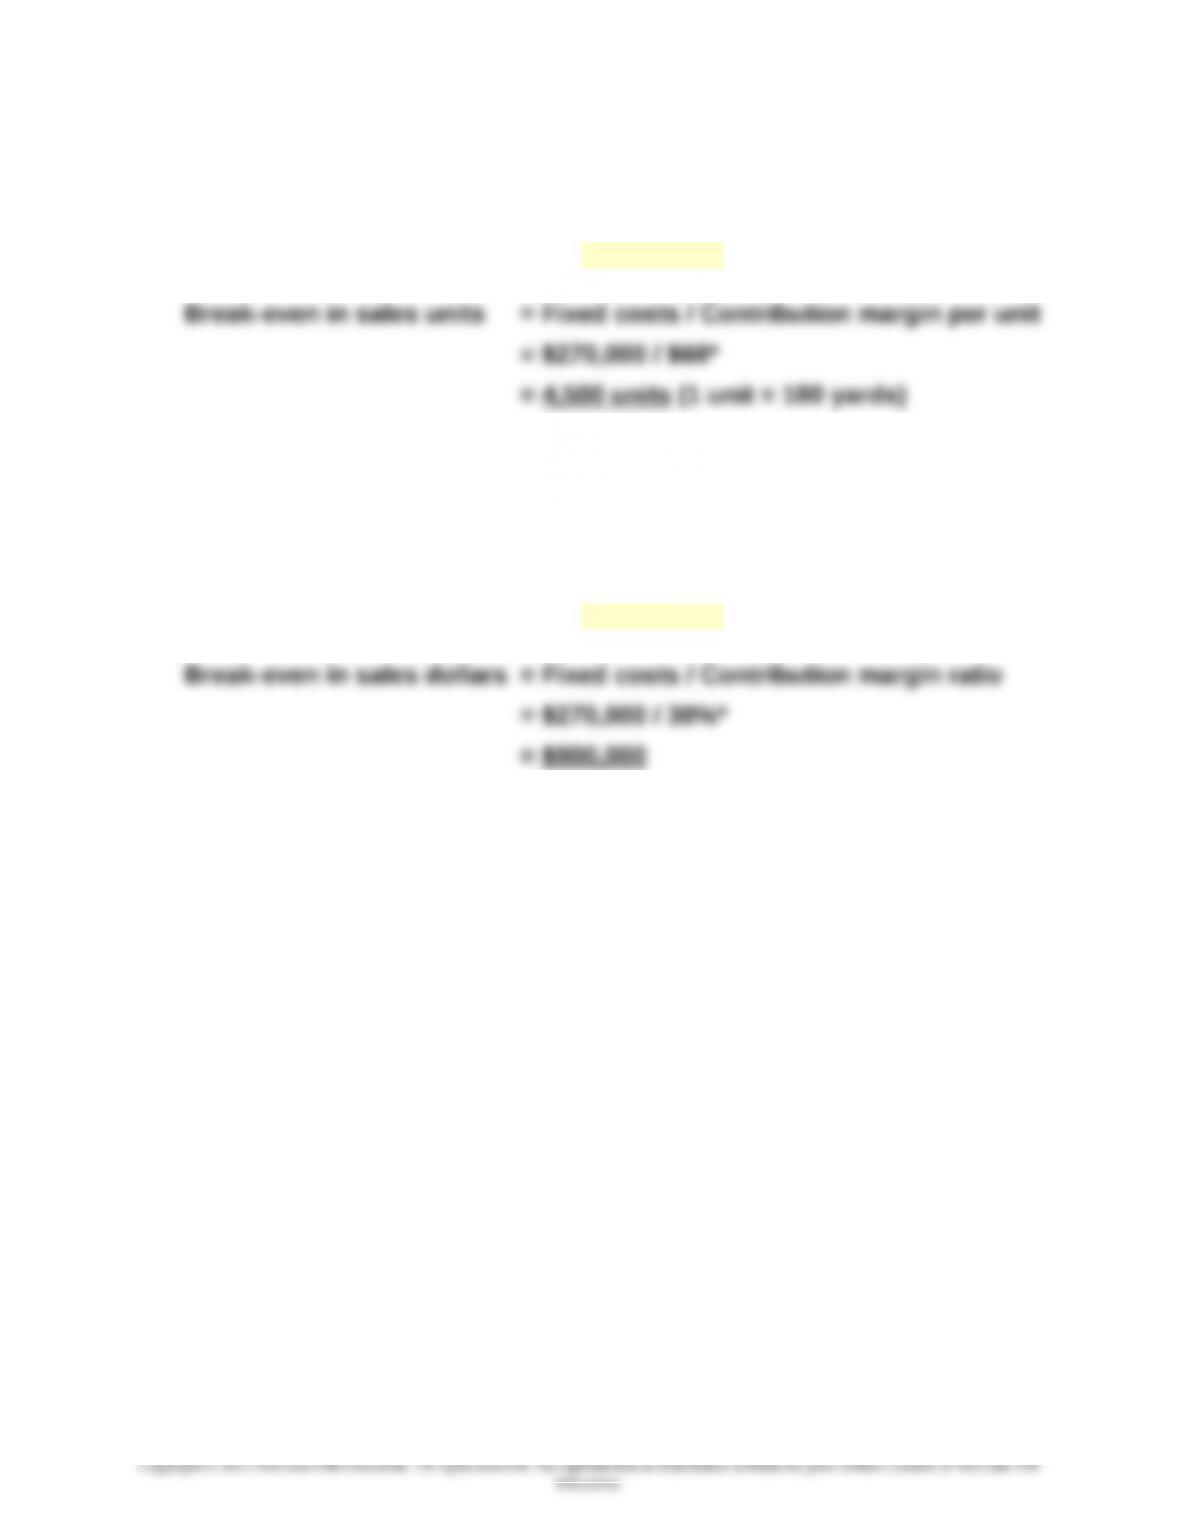
(a) Instructor note: Use the equation in Exhibit 21.11
*Contribution margin per unit = $200 – $140 = $60 per 100 yards
(b) Instructor note: Use the equation in Exhibit 21.12
(Alternatively: = 4,500 units x $200 = $900,000)
*Contribution margin ratio = $60 / $200 = 30%
Problem 21-3A (Continued)
Part 2
CVP Chart for Praveen Company
21-1212
$
0
0
$400,00
0
$800,00
$1,000,0
00
$1,200,0
00
$1,400,0
0 1,00
0
2,00
0
3,00
0
4,00
0
5,00
0
6,00
0
7,00
0
Units (100
yards)
s
Chapter 21 – Cost-Volume-Profit Analysis
Part 3
PRAVEEN CO.
Contribution Margin Income Statement (at Break-Even) — Product XT
Sales (4,500 x $200)……………………………………………………….……………$900,000
Variable costs (4,500 x $140)……………………………………..……………….. 630,000
21-1213
Chapter 21 – Cost-Volume-Profit Analysis
Problem 21-4A (75 minutes)
Part 1 Instructor note: Use the equation in Exhibit 21.12
*To compute contribution margin ratio
Sales price per unit ($1,000,000 / 20,000)..………….………………….............................$50
Variable costs per unit ($800,000 / 20,000)…..……………….……………........................$40
Contribution margin ratio ($50- $40) / $50)……………………………………………………...20%
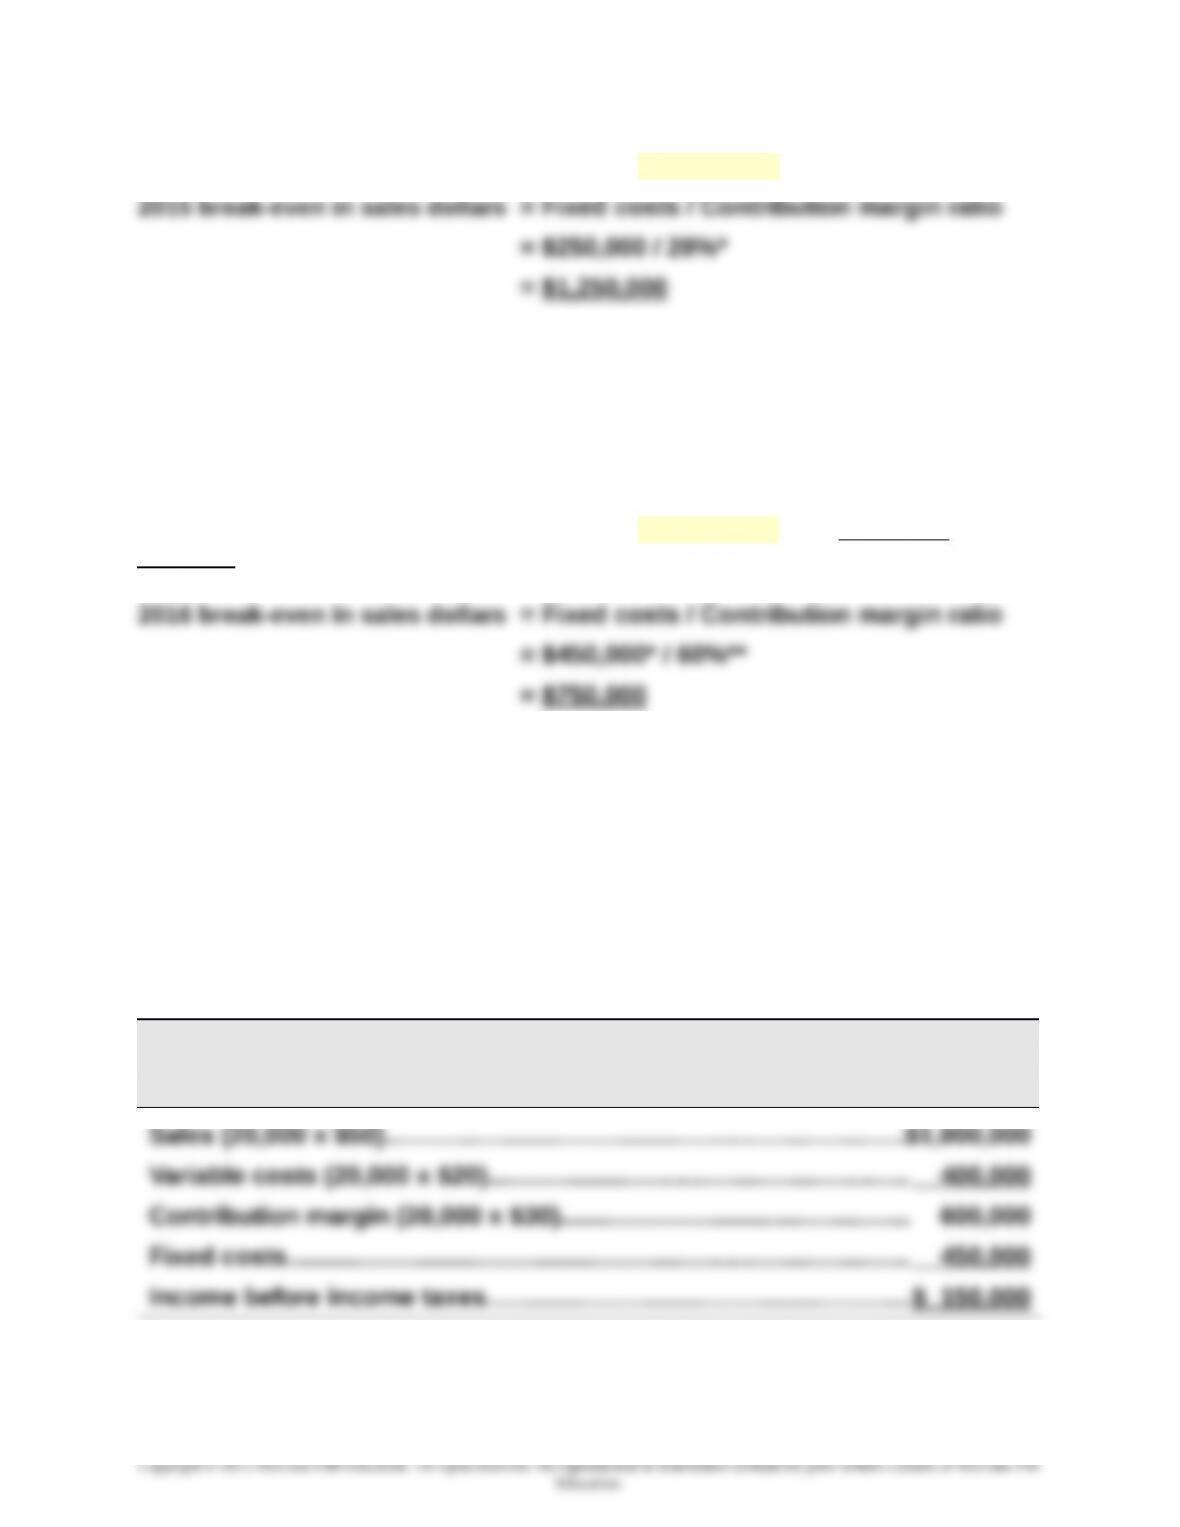
Part 2 Instructor note: Use the equation in Exhibit 21.12 with predicted
numbers
*To compute predicted fixed costs
2015 fixed costs plus 2016 increase ($250,000 + $200,000)………………..................$450,000
**To compute predicted contribution margin ratio
Predicted sales price per unit (no change in sales price)…….…….………................$50
Predicted variable costs per unit ($40 x 50%)..……………….…………………….............$20
Predicted contribution margin ratio ($50- $20) / $50).…….…………….......................60%
Part 3
ASTRO COMPANY
Forecasted Contribution Margin Income Statement
For Year Ended December 31, 2016
21-1214
Chapter 21 – Cost-Volume-Profit Analysis
Problem 21-4A (Continued)
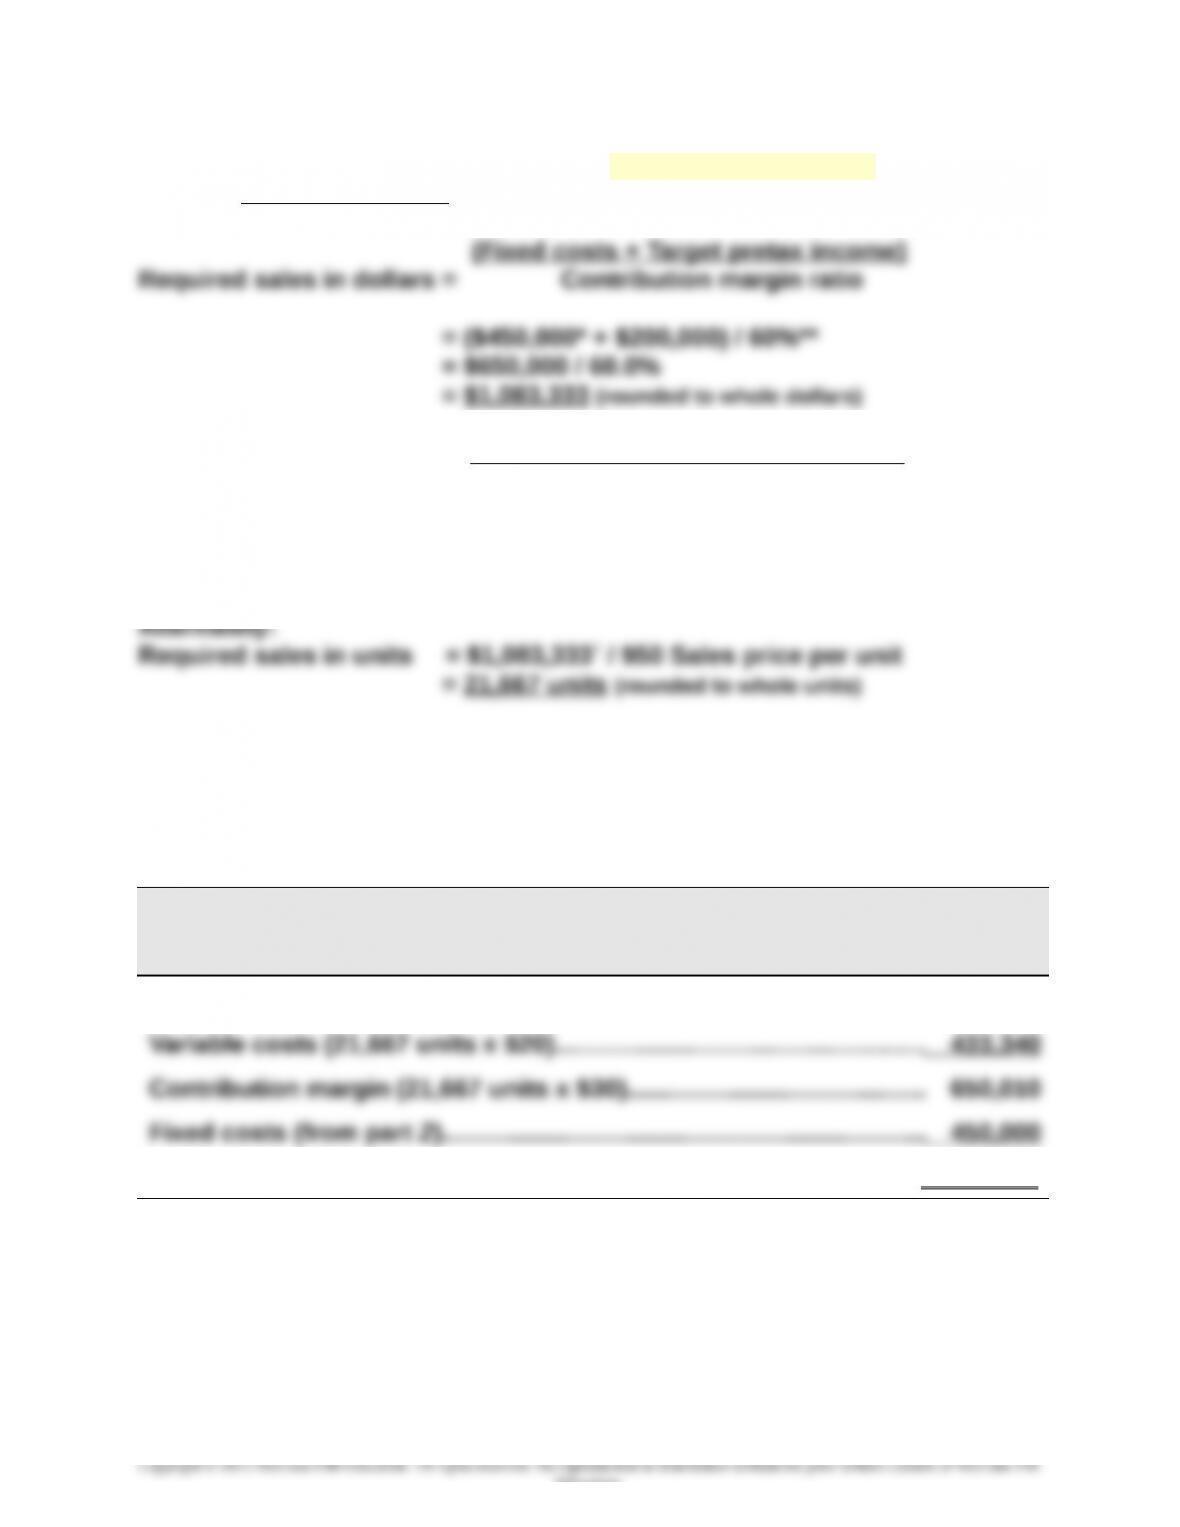
Part 4 Instructor note: Use equations in Exhibits 21.22 and 21.23 with
predicted numbers
(Fixed costs + Target pretax income)
Required sales in units = Contribution margin per unit
= ($450,000 + $200,000) / ($50 – $20)
= $650,000 / $30
= 21,667 units (rounded to whole units)
* 2015 fixed costs plus 2016 increase ($250,000 + $200,000)……..……………........$450,000
** Predicted contribution margin ratio ($50- $30) / $50)—from part 2................... 60%
† Taken from “required sales in dollars” above
Part 5
ASTRO COMPANY
Forecasted Contribution Margin Income Statement
For Year Ended December 31, 2016
Sales (21,667 units x $50)………………………………………….……………….$1,083,350
Income before income taxes*………………………………………………….….$ 200,010
*Slightly greater than the targeted $200,000 income due to rounding of units.
21-1215
Education.
Chapter 21 – Cost-Volume-Profit Analysis
Problem 21-5A (65 minutes)
Part 1 Instructor note: Use the equation in Exhibit 21.12
Break-even in dollar sales = Fixed costs / Contribution margin ratio
Product T:
*To compute contribution margin ratio
Sales price per unit
Product T ($2,000,000 / 50,000)……………………………………………………………………..
Product O ($2,000,000 / 50,000)………………………………………………………..…………..
__T__
$40
__O__
$40
Variable costs per unit
Part 2
Forecasted contribution margin income statements for each product
assuming sales declines to 30,000 units with no change in unit sales price
HENNA CO.
Forecasted Contribution Margin Income Statement
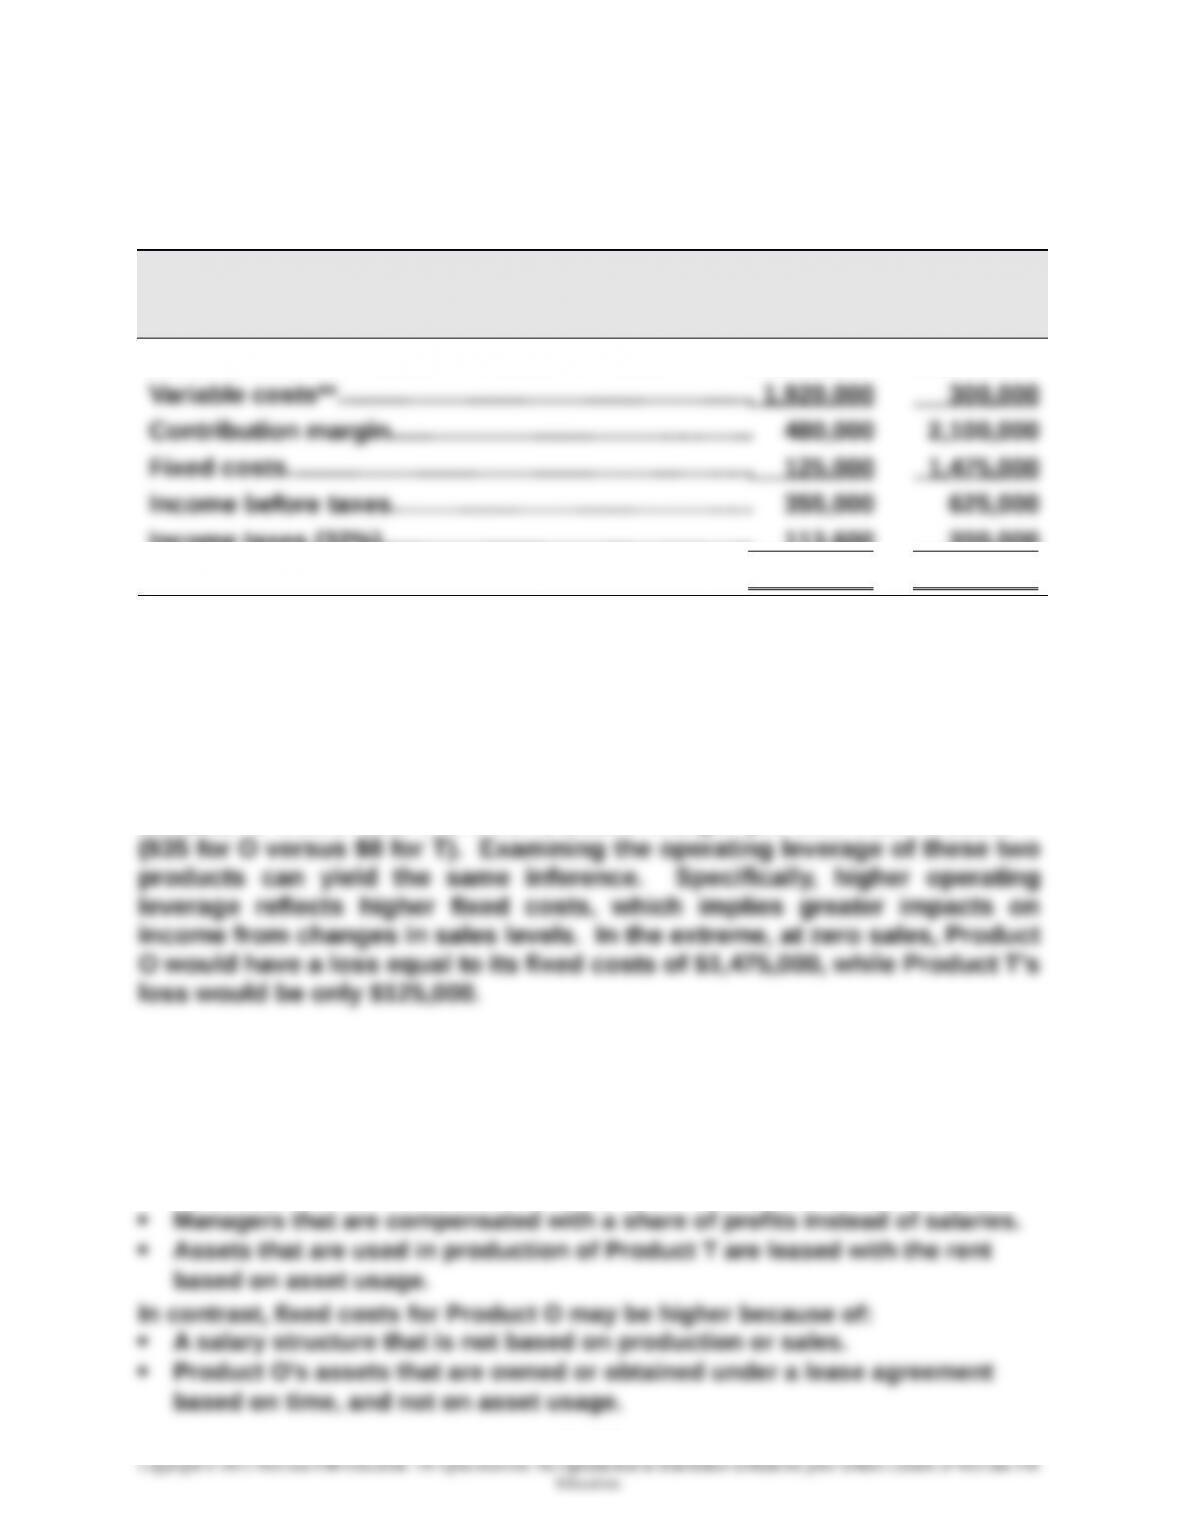
Product T Product O
Sales*…………………………………………………………..……..$1,200,000 $1,200,000
Variable costs**…………………………………………………… 960,000 150,000
Unit sales price and variable costs are computed in Part 1 and used in these computations:
* Product T sales = 30,000 units x $40; Product O sales = 30,000 units x $40.
** Product T variable costs = 30,000 units x $32; Product O variable costs = 30,000 units x $5.
21-1216
Chapter 21 – Cost-Volume-Profit Analysis
Problem 21-5A (Continued)
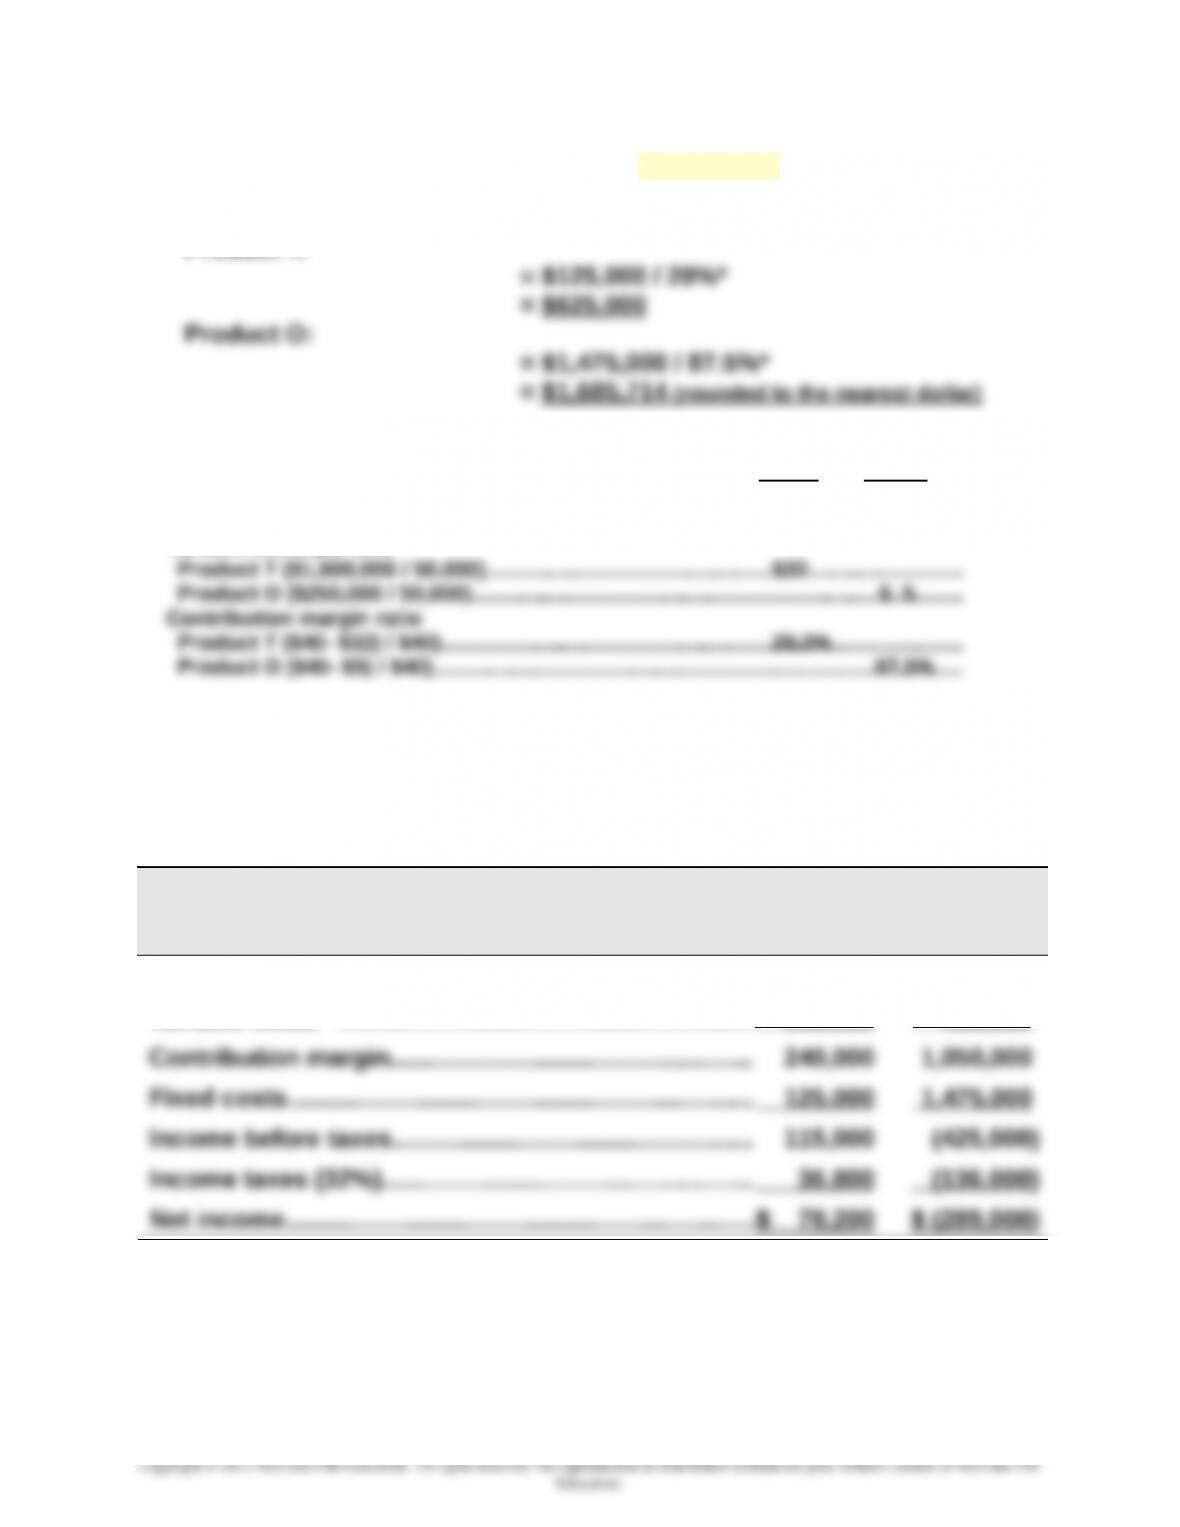
Part 3 Forecasted contribution margin income statements for each product
assuming sales increase to 60,000 units with no change in unit sales price
HENNA CO.
Forecasted Contribution Margin Income Statement
Product T Product O
Sales*…………………………………………………………..……..$2,400,000 $2,400,000
Income taxes (32%)…………………………..………………… 113,600 200,000
Net income……………………………………..…………………..$ 241,400 $ 425,000
Unit sales price and variable costs are computed in Part 1 and used in these computations:
* Product T sales = 60,000 units x $40; Product O sales = 60,000 units x $40.
** Product T variable costs = 60,000 units x $32; Product O variable costs = 60,000 units x $5.
Part 4
If sales were to greatly decrease, Product O would suffer the greater loss
because it would lose more contribution margin per unit than Product T
Part 5
Factors that could cause Product T to have lower fixed costs might include:
Labor arrangement that pays workers for units produced.
Sales representatives that work totally on commission.
21-1217
Chapter 21 – Cost-Volume-Profit Analysis
Problem 21-6A (45 minutes)
Part 1 Instructor note: Use the equation in Exhibit 21.12
*To compute contribution margin ratio
Sales price per unit
Plan 1 (no change)……………………………………………………………………………………….
Plan 2 [$25.00 x (1 + 20%)]………………………………………………………………….…..……
Plan 1
$25.00
Plan 2
$30.00
Total variable costs per unit (both Plans 1 and 2)
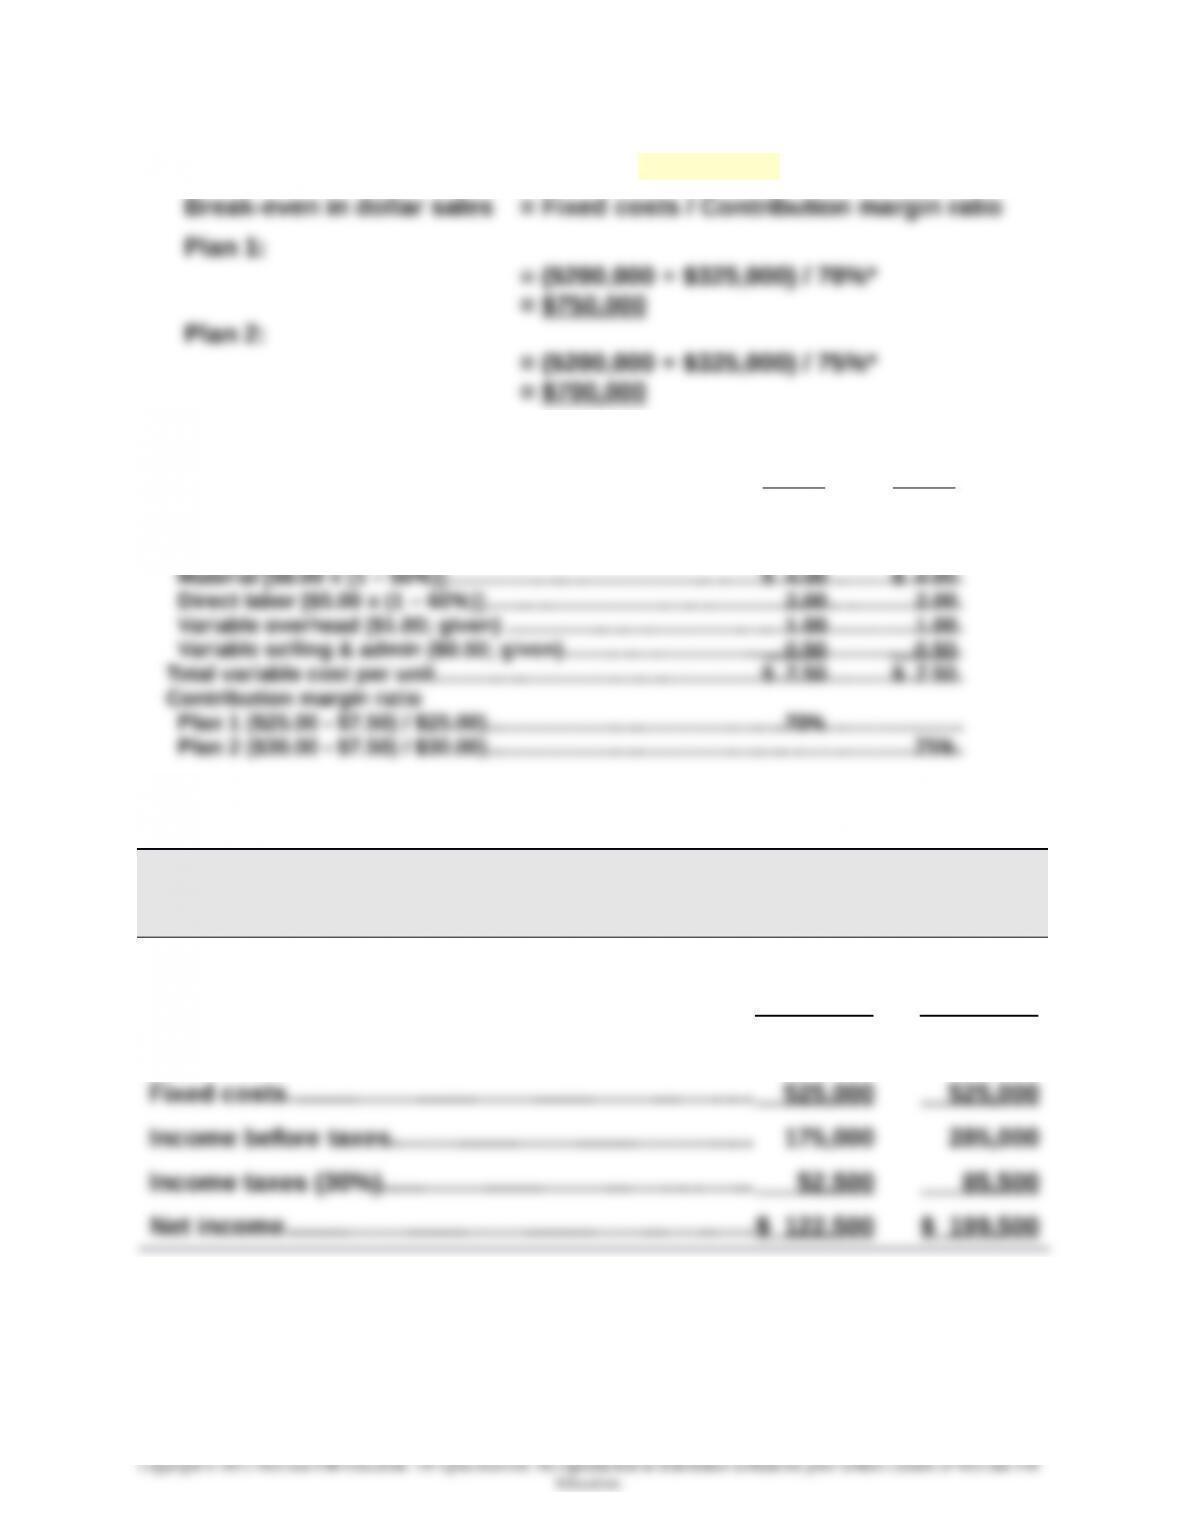
Part 2
BURCHARD CO.
Forecasted Contribution Margin Income Statement
Plan 1 Plan 2
Sales*…………………………………………………………..……..$1,000,000 $1,080,000
Variable costs**…………………………………………………… 300,000 270,000
Contribution margin………………………………..………….. 700,000 810,000
Unit sales price and variable costs are computed in Part 1 and used in these computations:
* Plan 1 sales = 40,000 units x $25; Plan 2 sales = 36,000 units x $30.
** Plan 1 variable costs = 40,000 units x $7.50; Plan 2 variable costs = 36,000 units x $7.50.
21-1218