Exercise 21-23 (25 minutes)
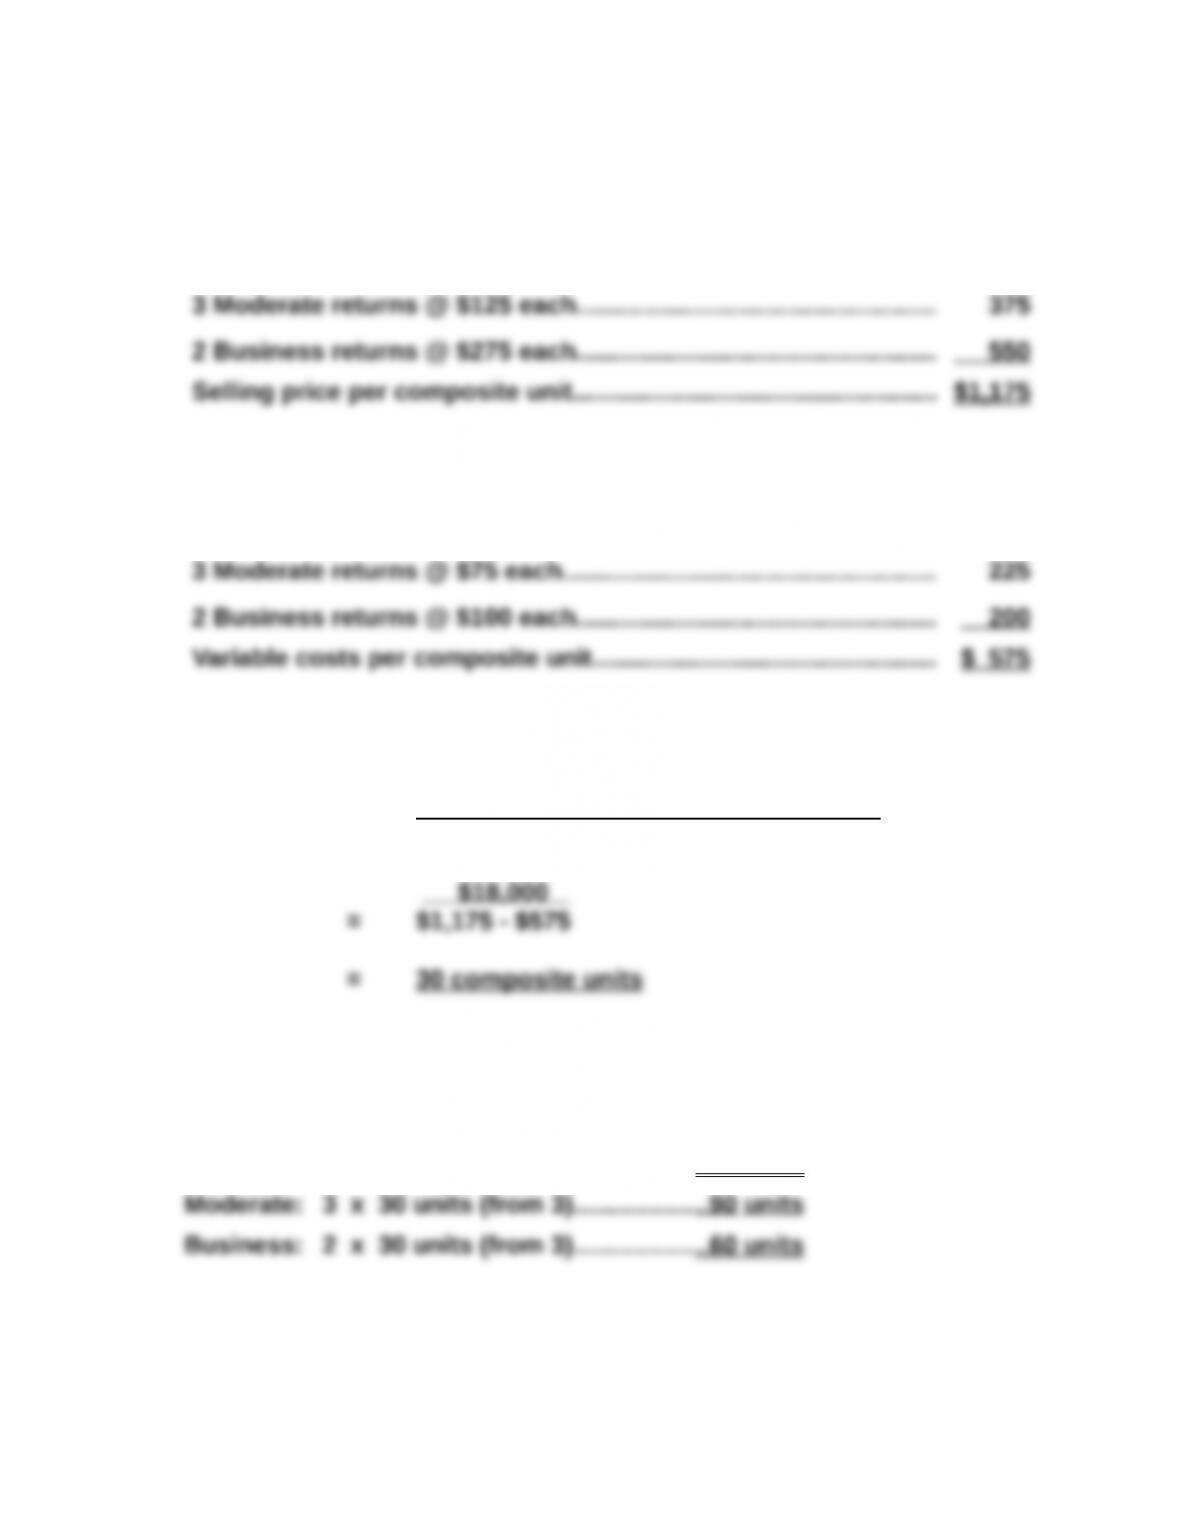
1. Selling price per composite unit
5 Easy returns @ $50 each…………………………………………………… $ 250
2. Variable costs per composite unit
5 Easy returns @ $30 each…………………………………………………… $ 150
3. Break-even point in composite units
Fixed costs .
= Contribution margin per composite unit
4. Unit sales of Easy, Moderate, and Business returns at break-even point
Easy: 5 x 30 units (from 3)………..………..150 units
Exercise 21-24 (30 minutes)
Instructor note: This exercise is solved in 3 steps
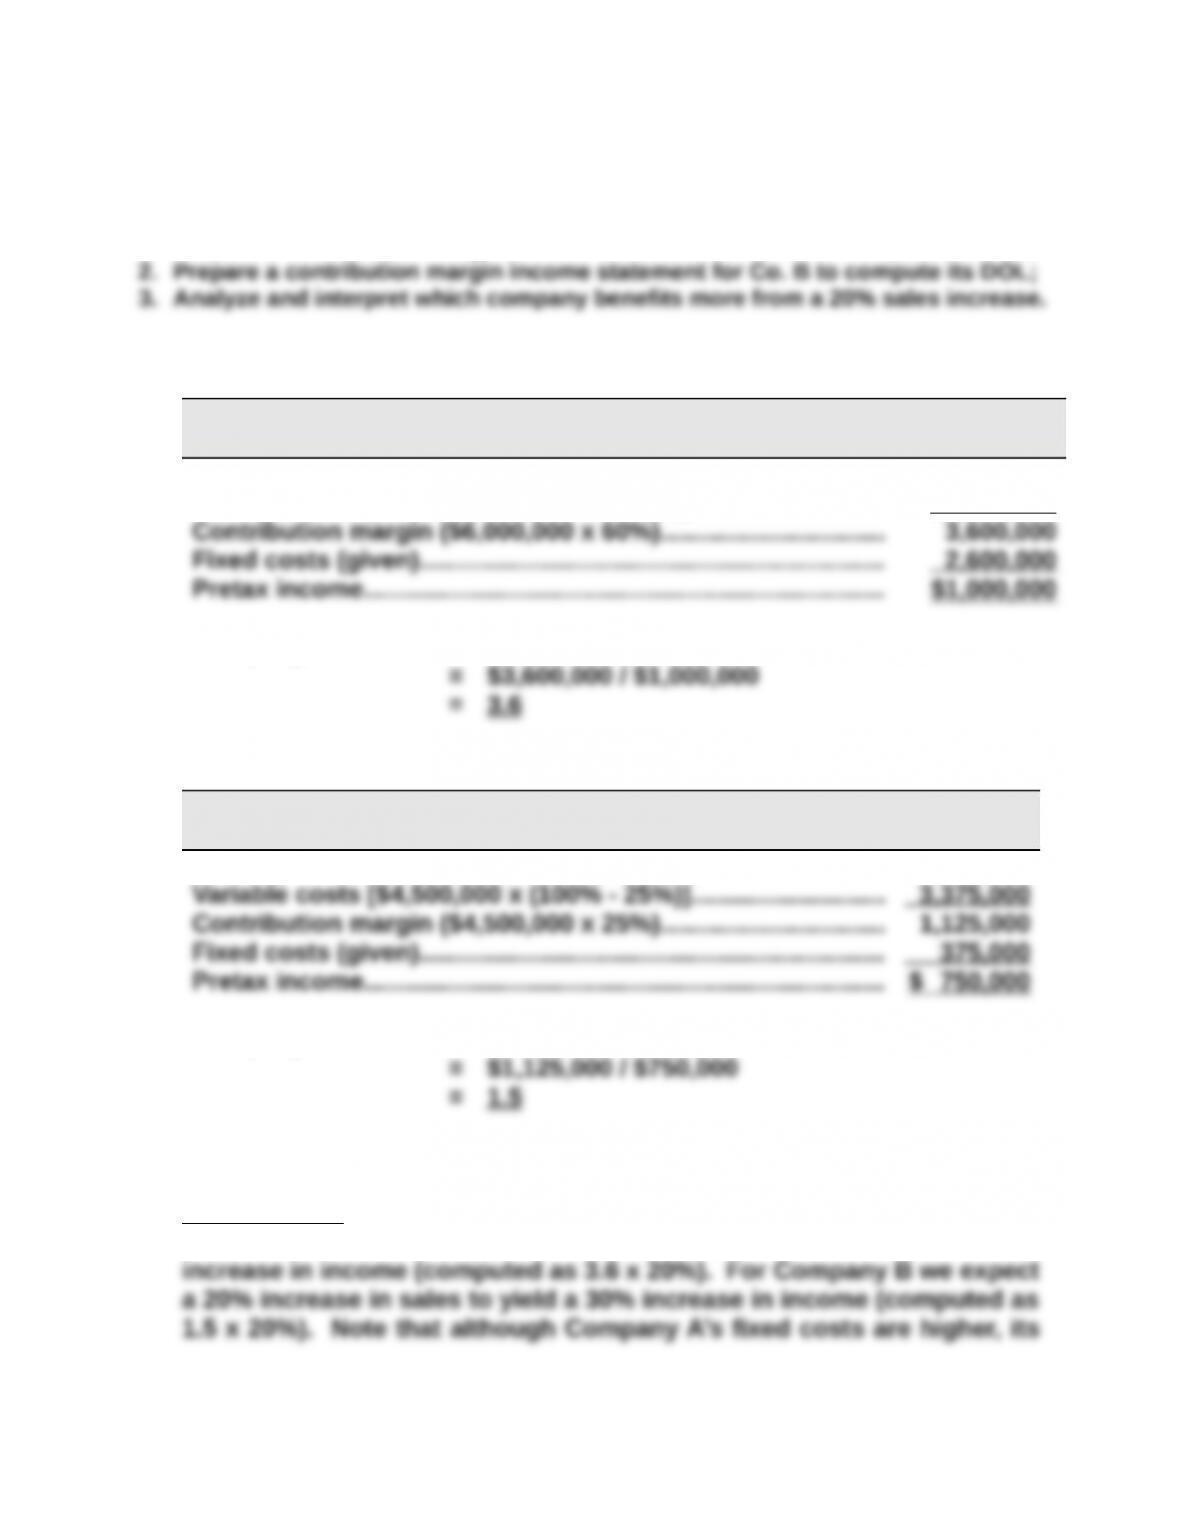
1. Prepare a contribution margin income statement for Co. A to compute its DOL;
Step 1.
Company A
Contribution Margin Income Statement
Sales (given)………………………………………………………………… $6,000,000
Variable costs [$6,000,000 x (100% – 60%)]……………………… 2,400,000
Company A’s DOL = Contribution margin in dollars / Pretax income
Step 2.
Company B
Contribution Margin Income Statement
Sales (given)………………………………………………………………… $4,500,000
Company B’s DOL = Contribution margin in dollars / Pretax income
Step 3.
Interpretation: Company A benefits more from a 20% increase in sales.
This is because we expect a 20% increase in sales to yield a 72%

Exercise 21-25 (10 minutes)
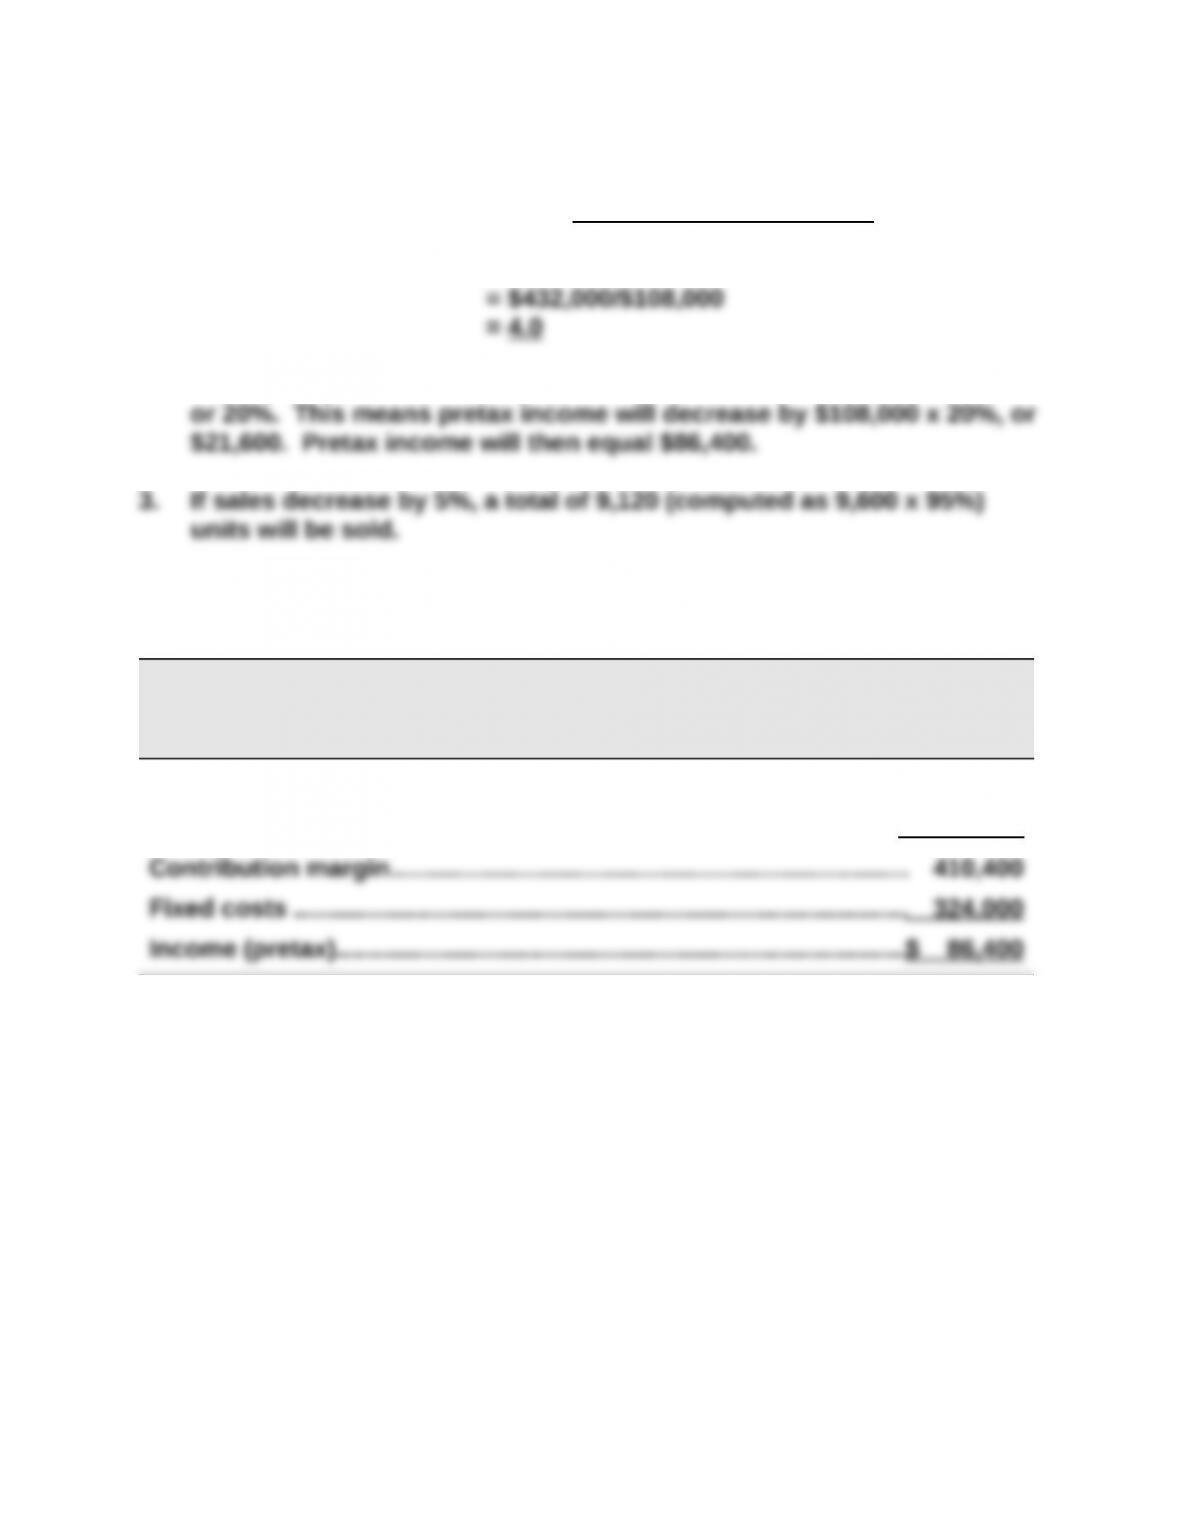
1. Degree of operating leverage = Total contribution margin
Pretax income
2. If sales decrease by 5%, then pretax income will decrease by 4.0 x 5%,
Contribution margin income statement, assuming 5% sales decrease:
HUDSON CO.
Forecasted Contribution Margin Income Statement
For Year Ended December 31, 2016
Sales (9,120 x $225)……………………………………………………………….$2,052,000
Variable costs (9,120 x $180)………………………………………………….. 1,641,600
PROBLEM SET A
Problem 21-1A (25 minutes)
Parts 1 and 2
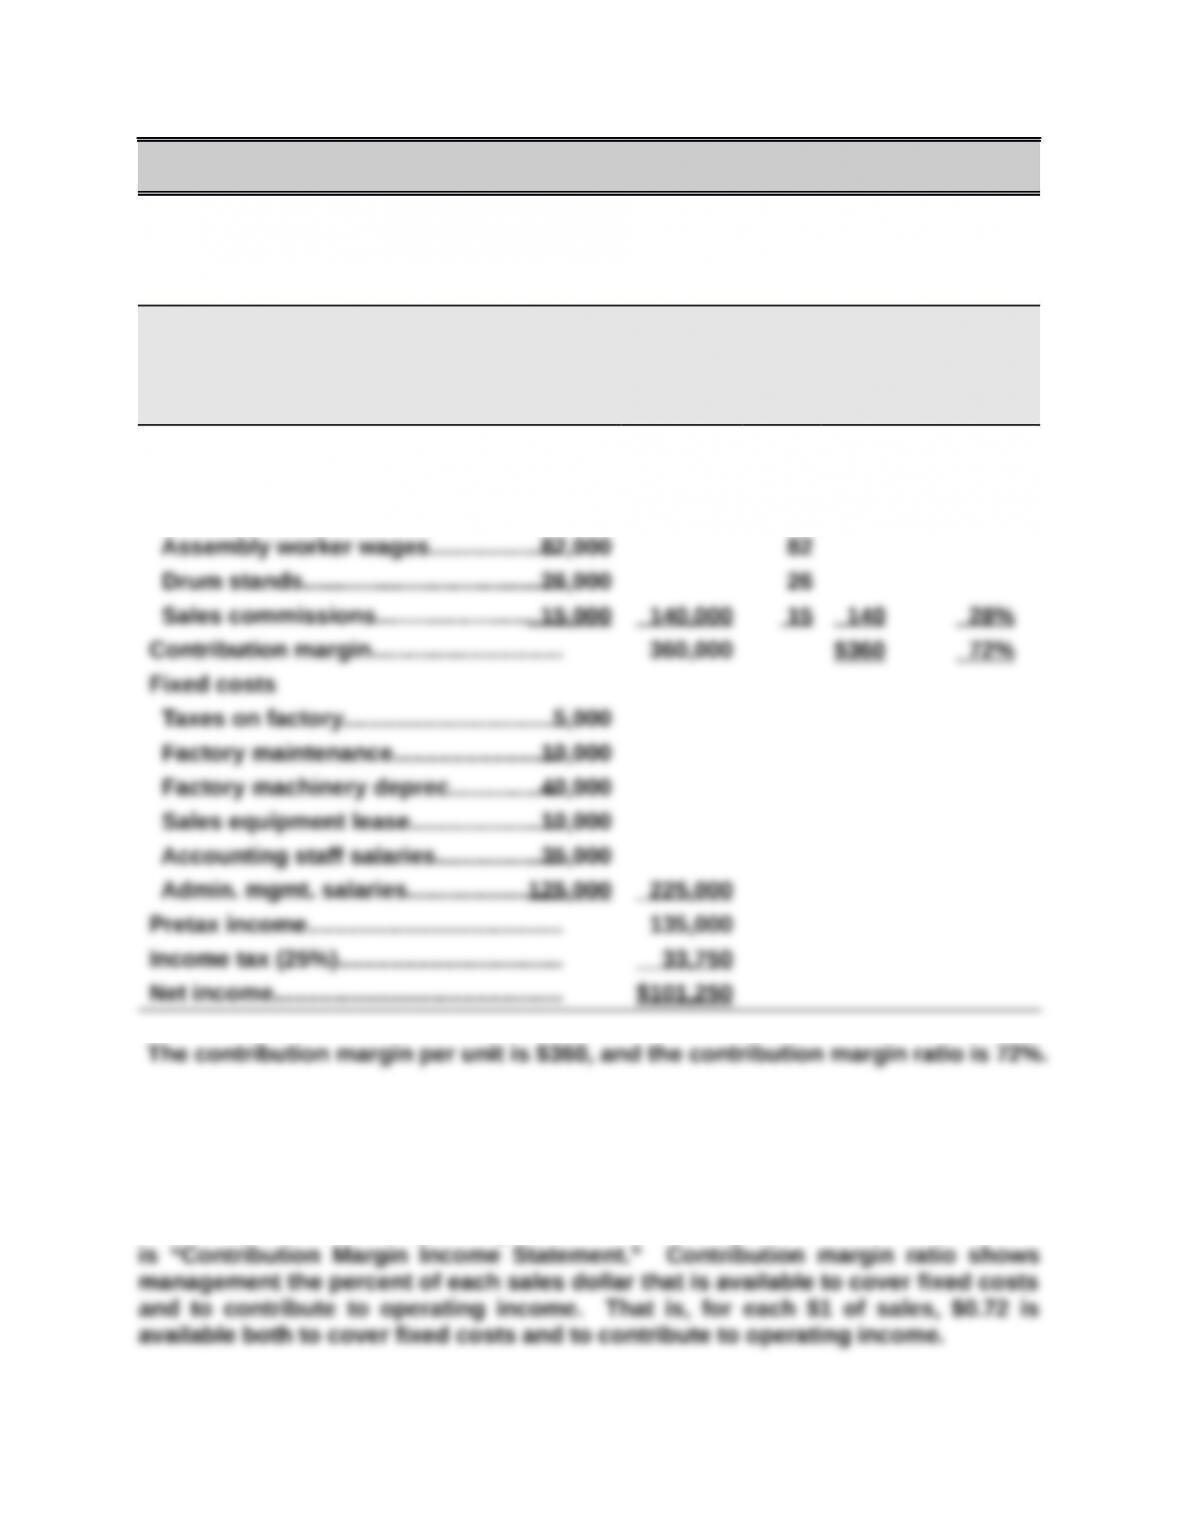
Tight Drums Company
Contribution Margin Income Statement
For Year Ended December 31, 2015
(1,000 units) Per unit % of sales
Sales ($500 x 1,000)……………………… $500,000 $500 100%
Variable costs
Plastic for casing………………………..$17,000 $17
Part 3 Analysis Component
Contribution margin shows how much of total sales are available to cover fixed
costs and contribute to operating income. This is why the title for this statement
Problem 21-2A (45 minutes)
Parts 1 and 2
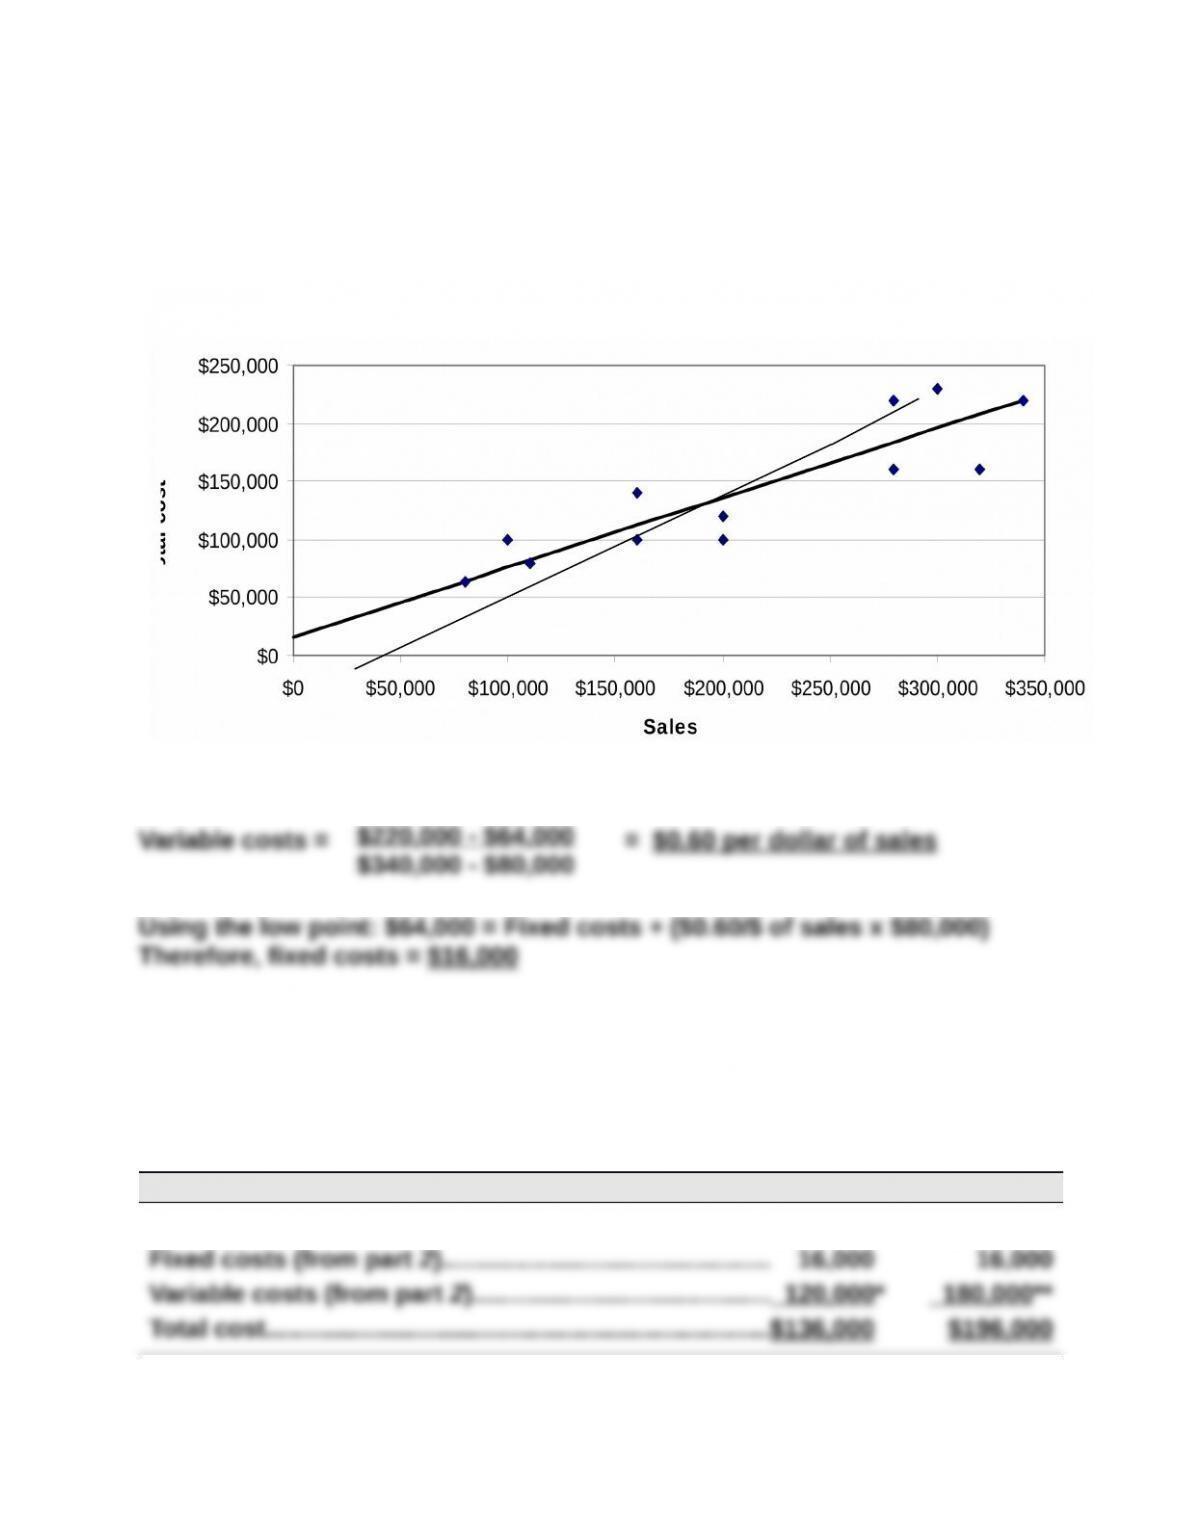
The scatter diagram and its estimated line of cost behavior appear below.
Part 2 – Calculation of variable and fixed costs
Part 3
The estimates in Part 2 can be used to predict the total costs that will be
incurred at sales levels of $200,000 and $300,000.
Predictions
Sales (given)………………………………………………………..$200,000 $300,000
Fixed costs (from part 2)………………………………………. 16,000 16,000
Variable costs (from part 2)…………………………………… 120,000* 180,000**
Total cost…………………………………………………………….$136,000 $196,000
Alden Co.

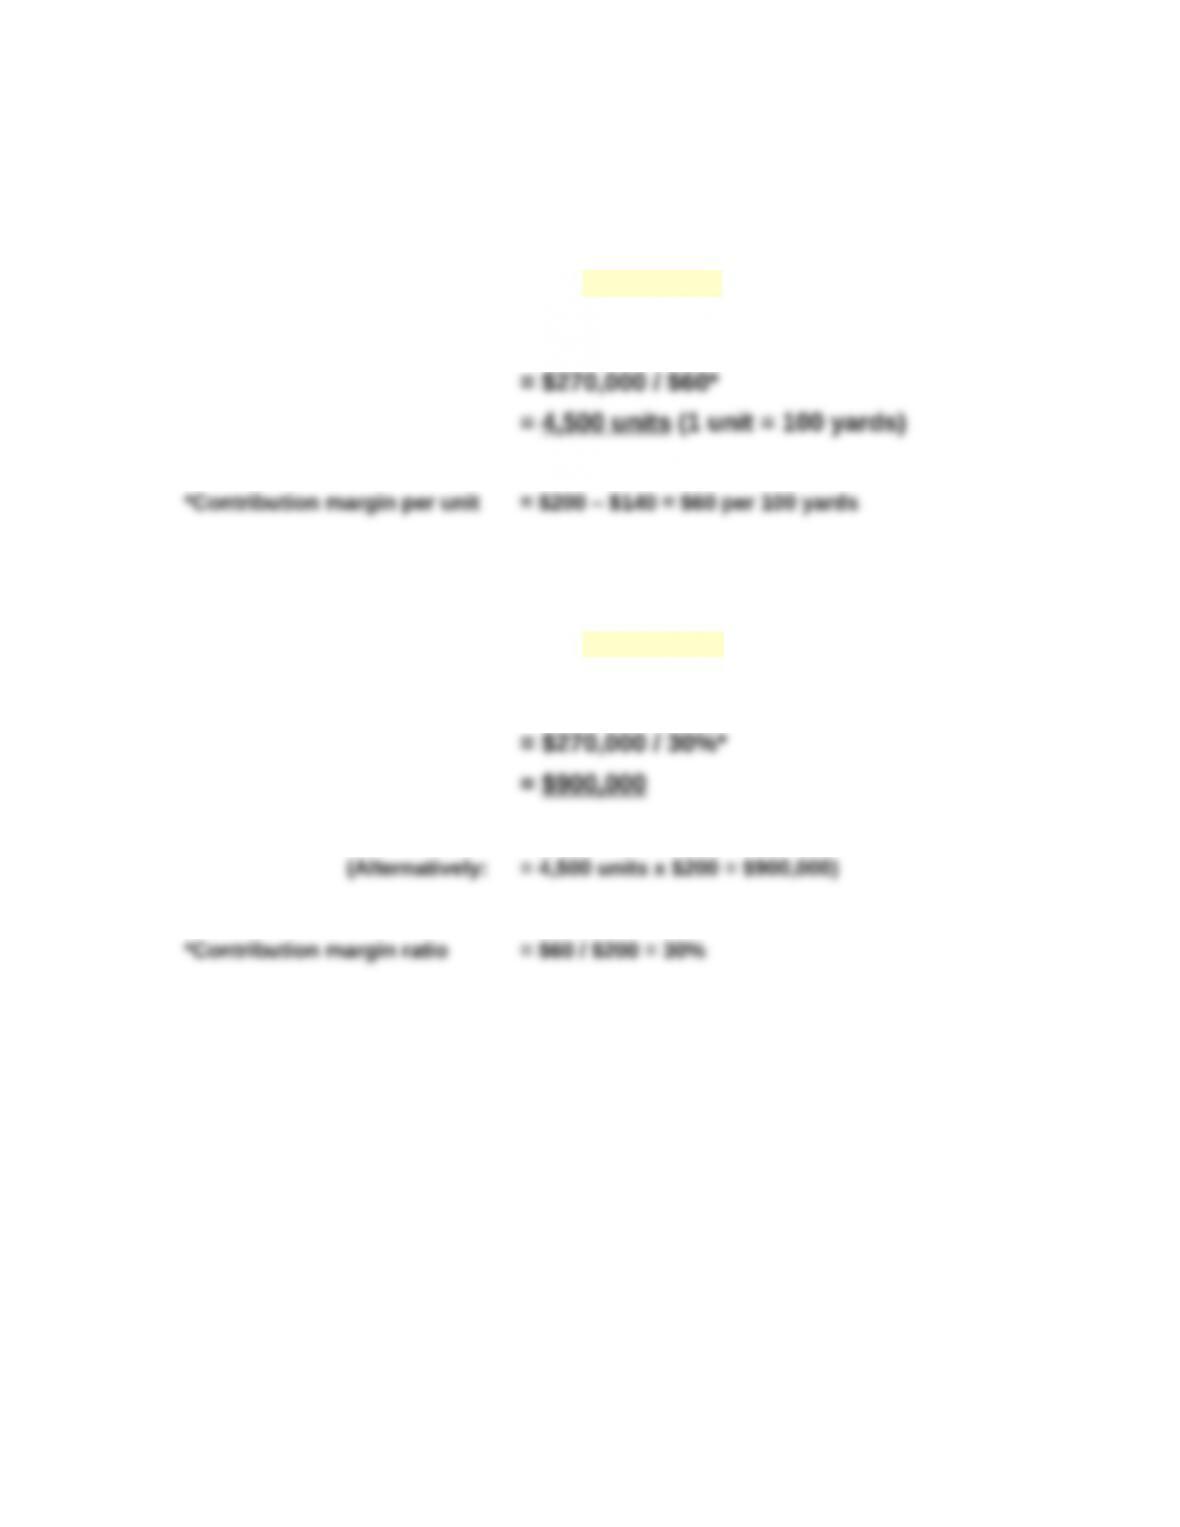
Problem 21-3A (40 minutes)
Part 1
(a) Instructor note: Use the equation in Exhibit 21.11
Break-even in sales units = Fixed costs / Contribution margin per unit
(b) Instructor note: Use the equation in Exhibit 21.12
Break-even in sales dollars = Fixed costs / Contribution margin ratio
$ 0
$200,000
$400,000
$800,000
$1,000,000
$1,200,000
$1,400,000
0 1,000 2,000 3,000 4,000 5,000 6,000 7,000
Units (100 yards)
Sales
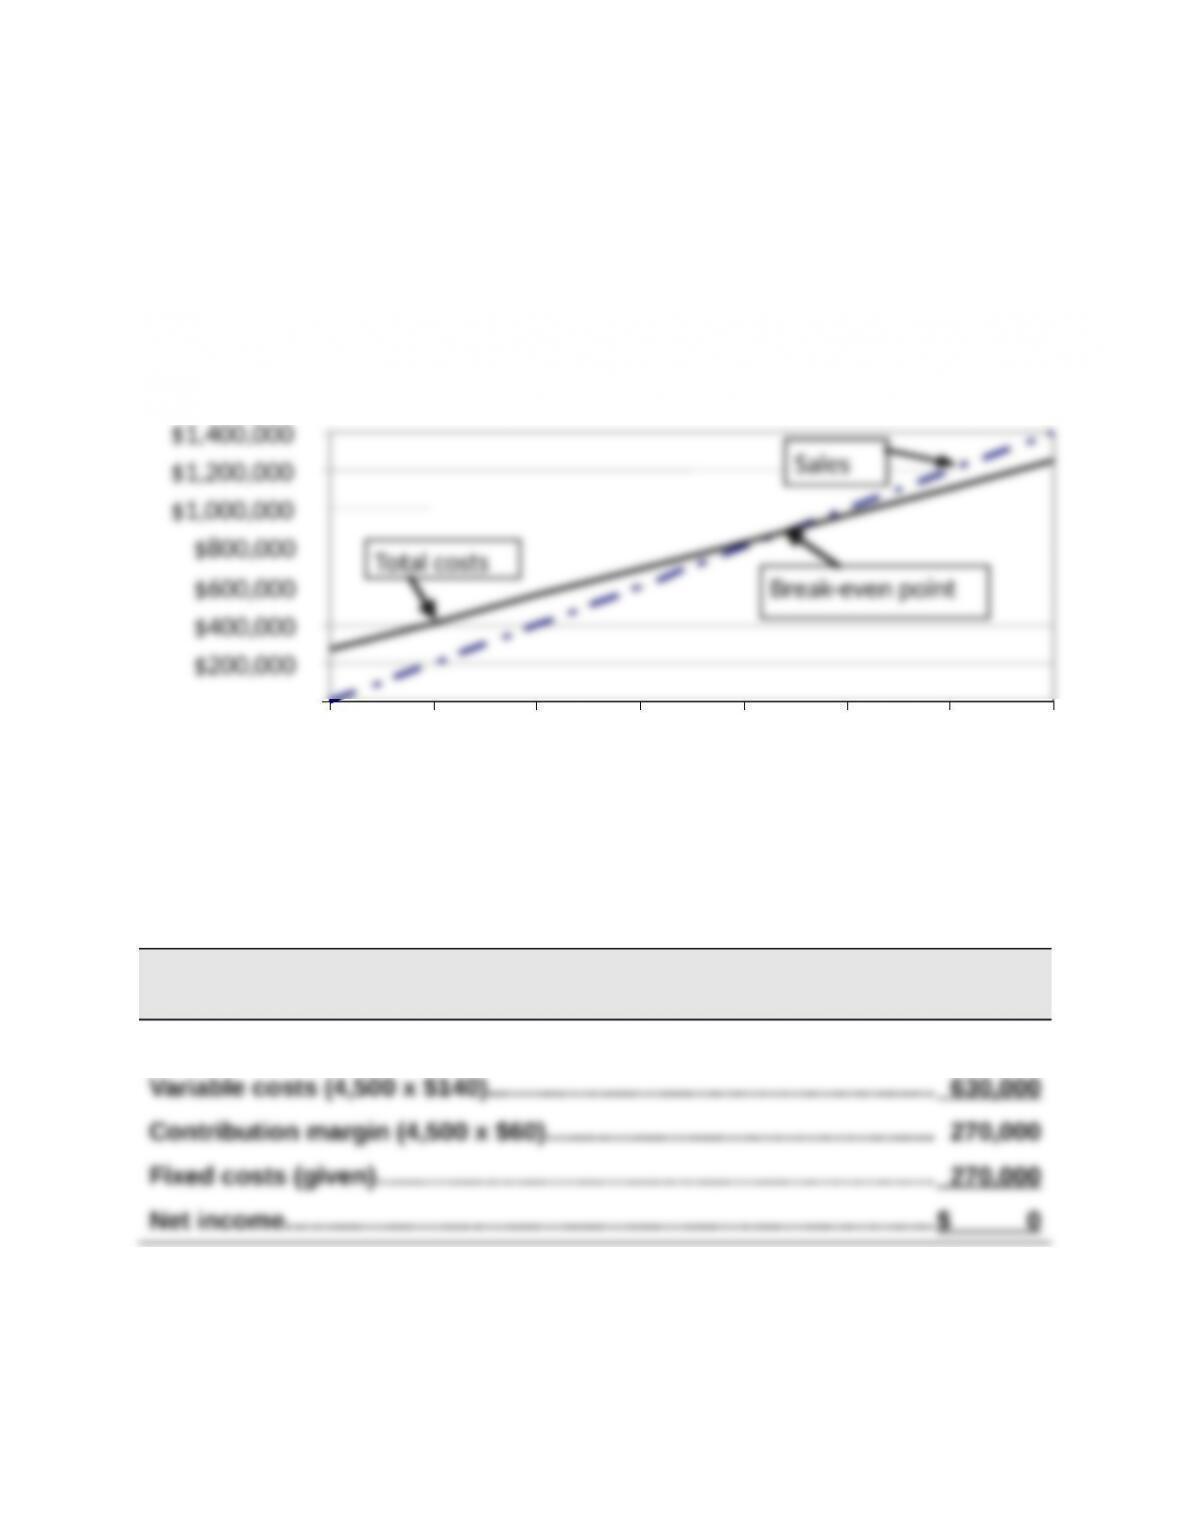
Problem 21-3A (Continued)
Part 2
CVP Chart for Praveen Company
Part 3
PRAVEEN CO.
Contribution Margin Income Statement (at Break-Even) — Product XT
Sales (4,500 x $200)…………………………………………………………………..$900,000
Problem 21-4A (75 minutes)
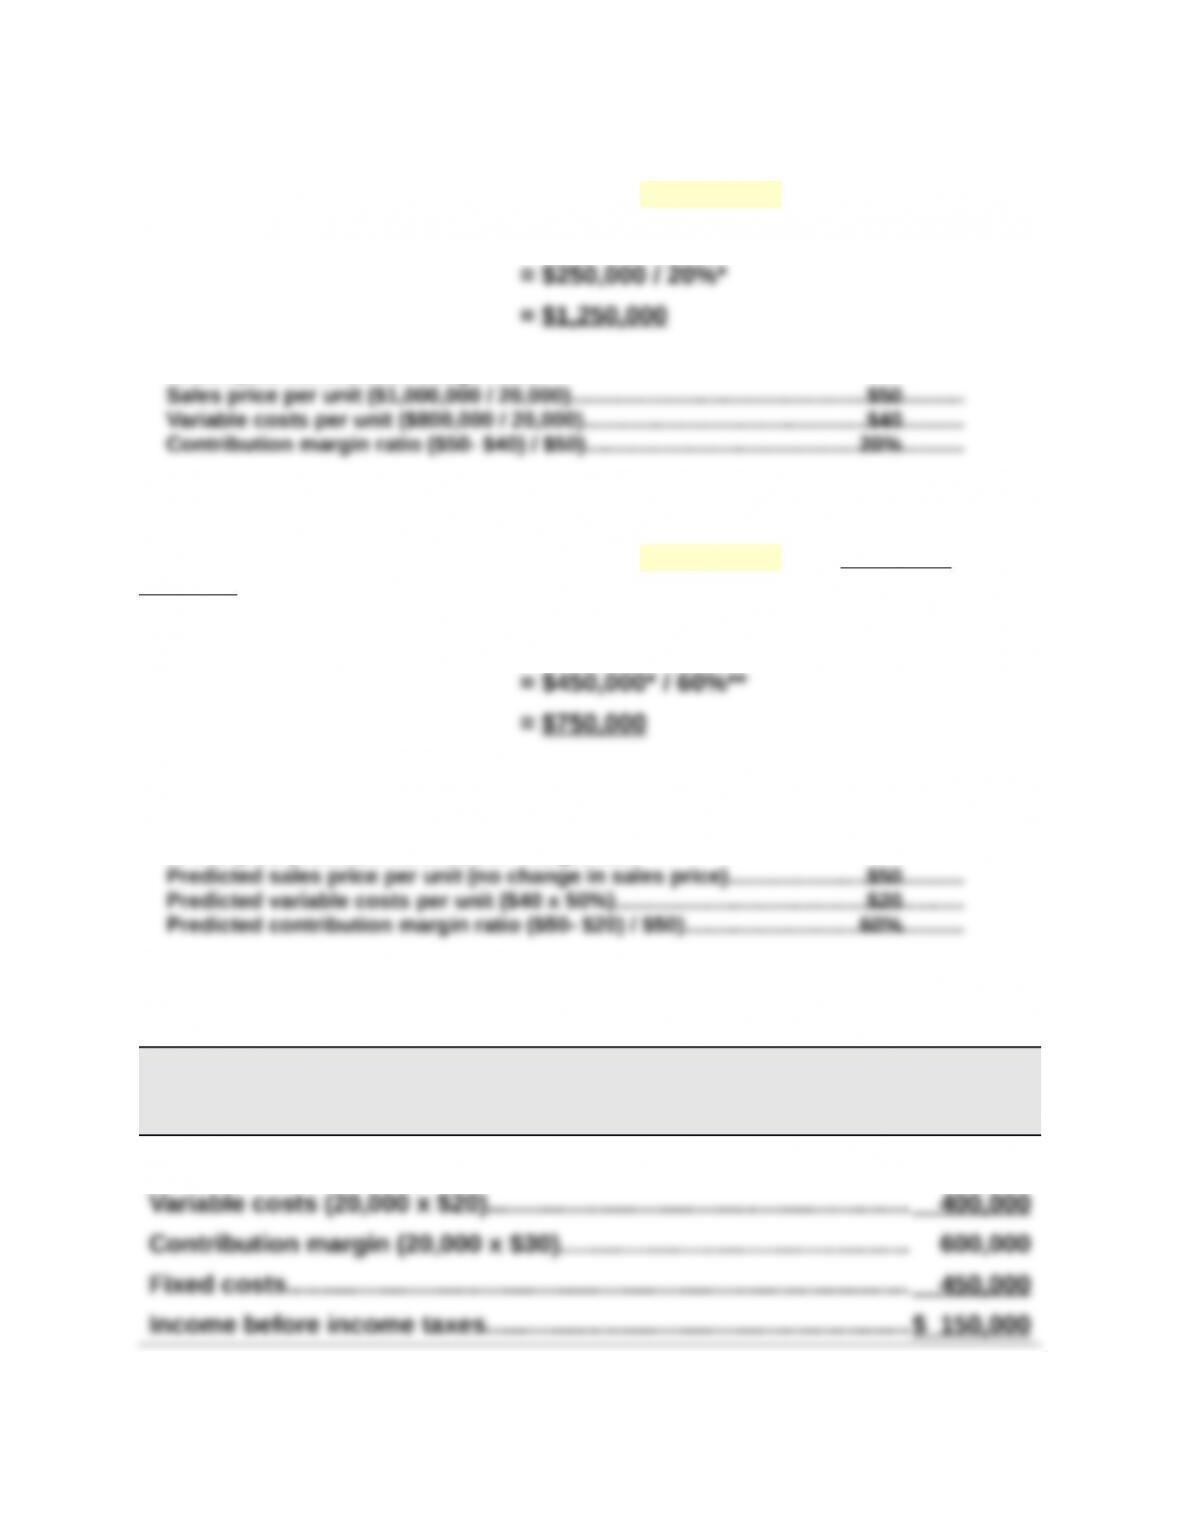
Part 1 Instructor note: Use the equation in Exhibit 21.12
2015 break-even in sales dollars = Fixed costs / Contribution margin ratio
*To compute contribution margin ratio
Part 2 Instructor note: Use the equation in Exhibit 21.12 with predicted
numbers
2016 break-even in sales dollars = Fixed costs / Contribution margin ratio
*To compute predicted fixed costs
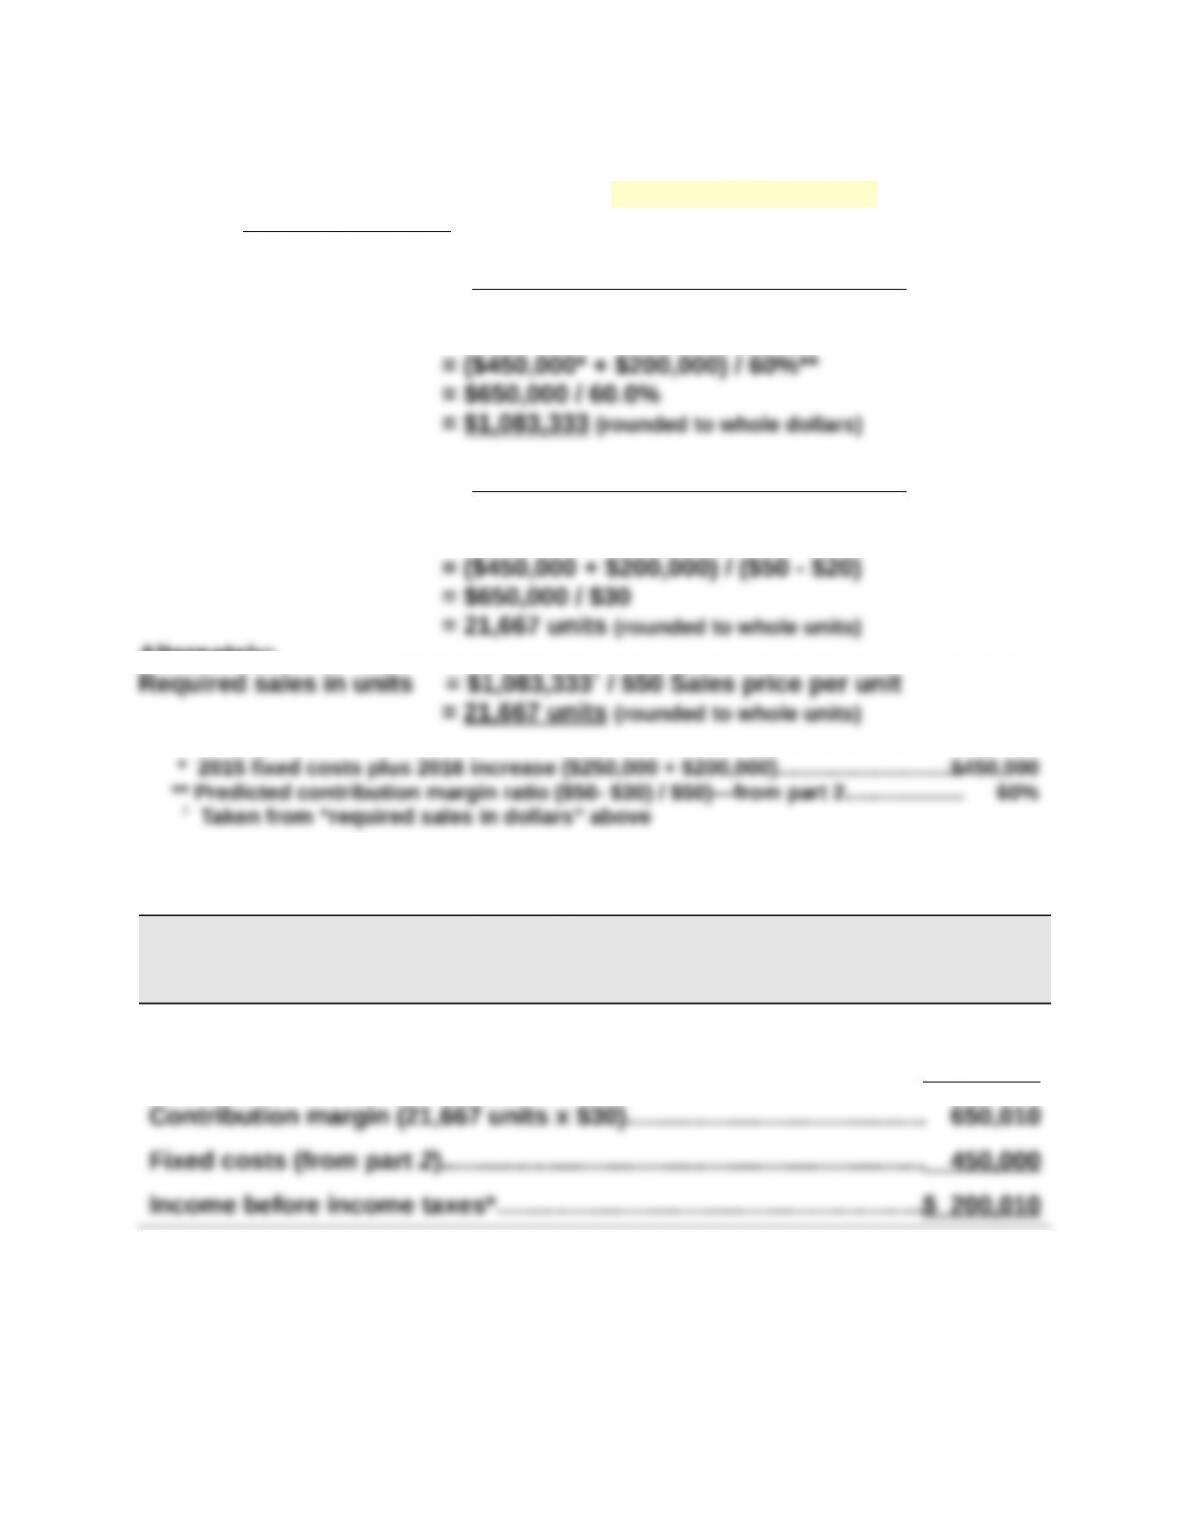
2015 fixed costs plus 2016 increase ($250,000 + $200,000)……………………………….$450,000
**To compute predicted contribution margin ratio
Part 3
ASTRO COMPANY
Forecasted Contribution Margin Income Statement
For Year Ended December 31, 2016
Sales (20,000 x $50)……………………………………………………………….$1,000,000
Problem 21-4A (Continued)
Part 4 Instructor note: Use equations in Exhibits 21.22 and 21.23 with
predicted numbers
(Fixed costs + Target pretax income)
Required sales in dollars = Contribution margin ratio
(Fixed costs + Target pretax income)
Required sales in units = Contribution margin per unit
Alternately:
Part 5
ASTRO COMPANY
Forecasted Contribution Margin Income Statement
For Year Ended December 31, 2016
Sales (21,667 units x $50)…………………………………………………………$1,083,350
Variable costs (21,667 units x $20)……………………………………………. 433,340
*Slightly greater than the targeted $200,000 income due to rounding of units.
Problem 21-5A (65 minutes)
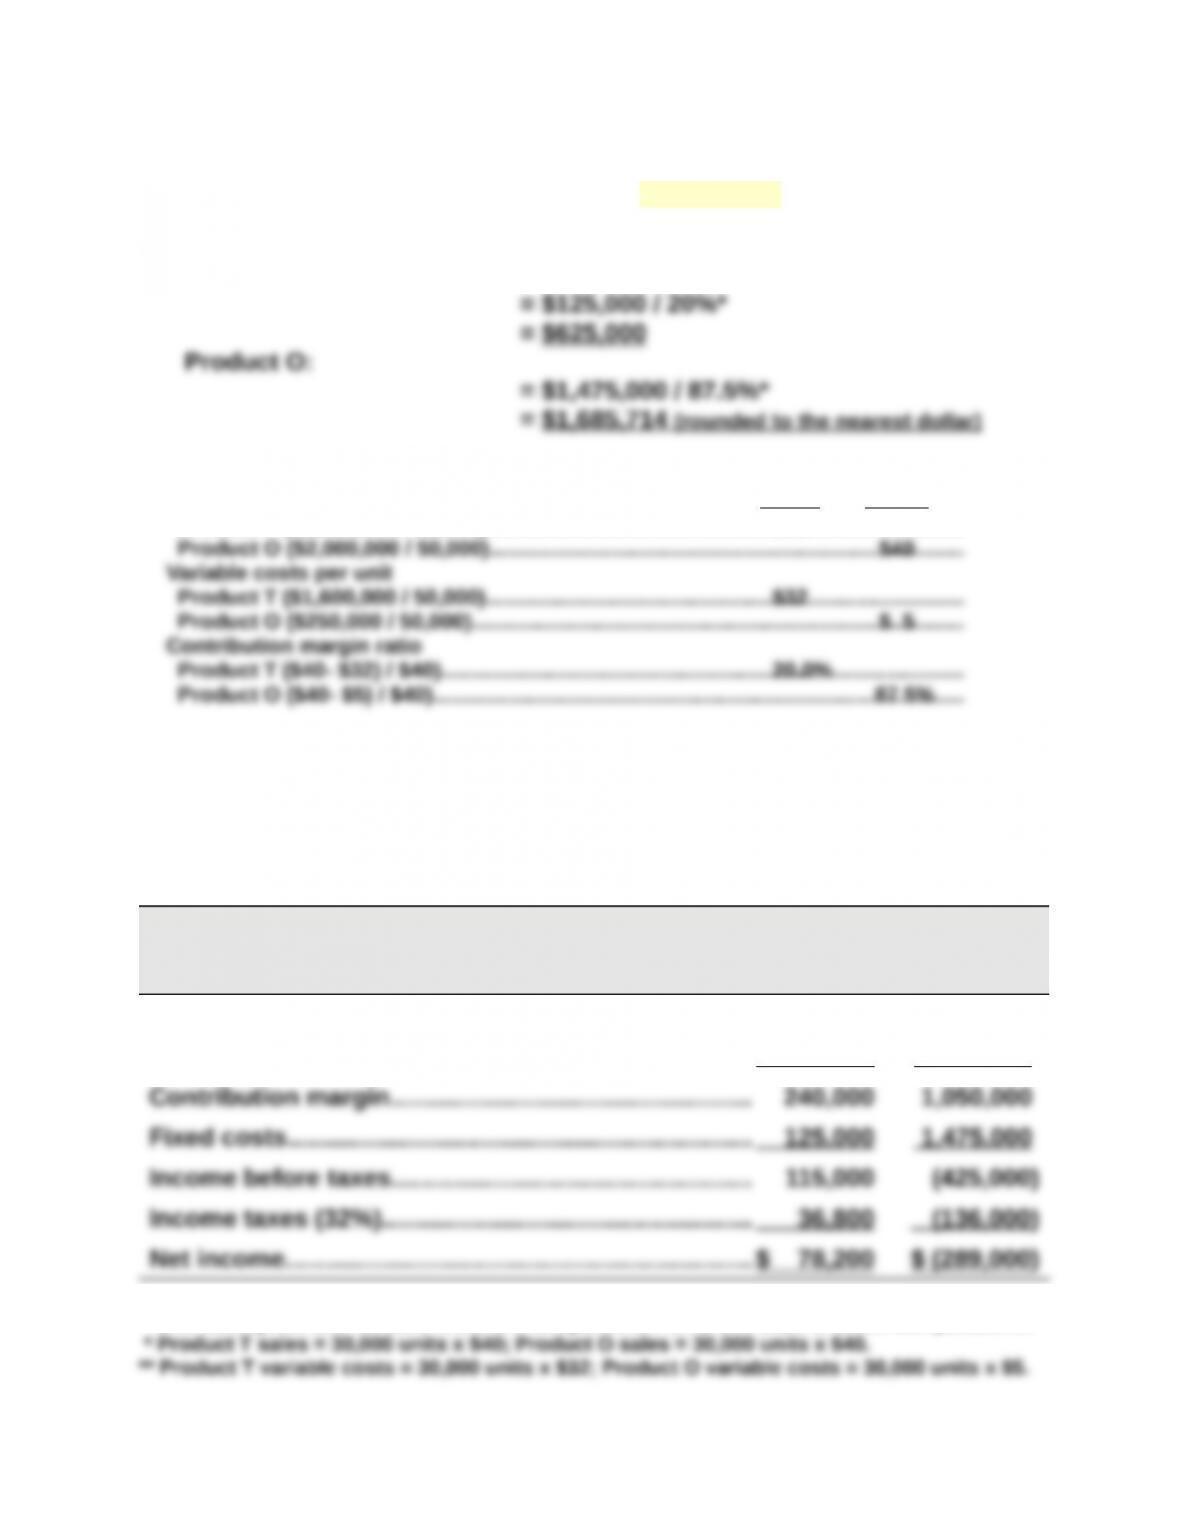
Part 1 Instructor note: Use the equation in Exhibit 21.12
Break-even in dollar sales = Fixed costs / Contribution margin ratio
Product T:
*To compute contribution margin ratio
Sales price per unit
Product T ($2,000,000 / 50,000)……………………………………………………………………….
__T__
$40
__O__
Part 2
Forecasted contribution margin income statements for each product
assuming sales declines to 30,000 units with no change in unit sales price
HENNA CO.
Forecasted Contribution Margin Income Statement
Product T Product O
Sales*………………………………………………………………..$1,200,000 $1,200,000
Variable costs**…………………………………………………. 960,000 150,000
Unit sales price and variable costs are computed in Part 1 and used in these computations: