Chapter 21 – Cost-Volume-Profit Analysis
Exercise 21-6 (20 minutes)
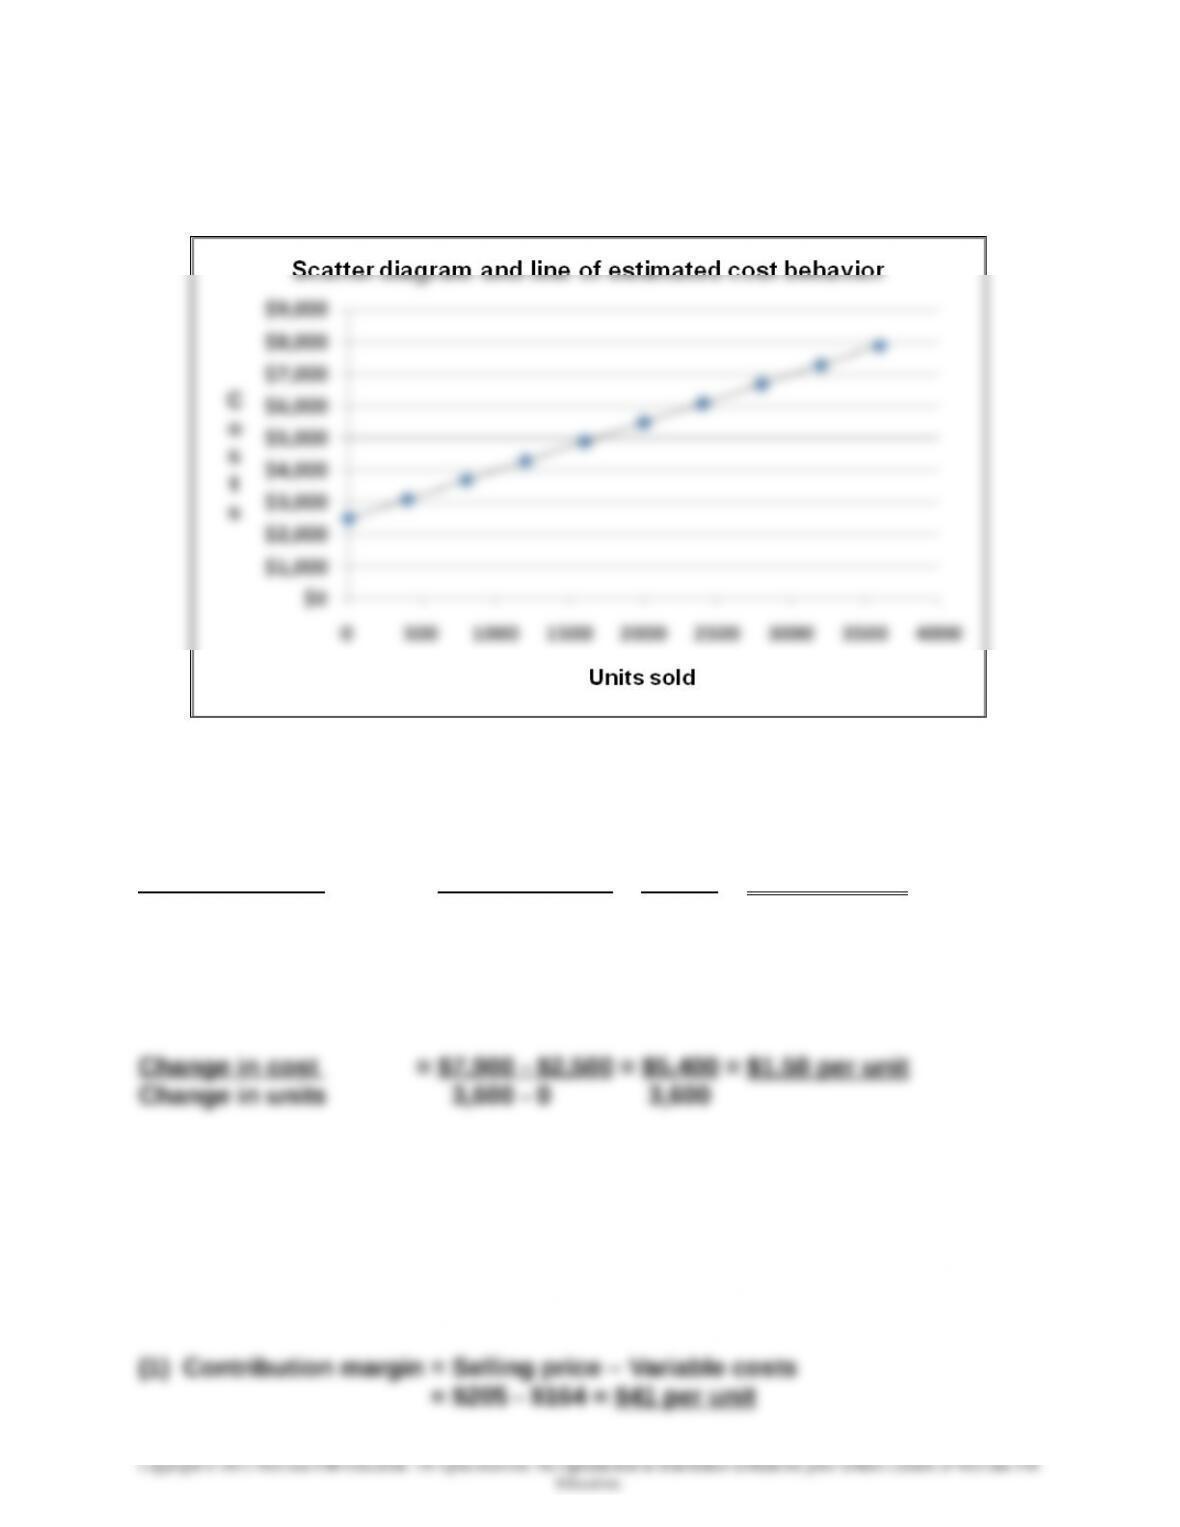
The scatter diagram and line of estimated cost behavior appear below.
Selecting 0 and 2,400 units sold as the activity levels yields $2,500 as the
estimate of fixed costs and the following estimate of variable costs per
unit:
Change in cost = $6,100 – $2,500 = $3,600 = $1.50 per unit
Change in units 2,400 – 0 2,400
Using the high-low method yields $2,500 as the estimate of fixed costs and
variable costs per unit of:
Exercise 21-7A (20 minutes)
Using Excel® to estimate an ordinary least squares regression yields an
intercept of $2,500 and a slope of $1.50. The cost equation is thus $2,500
plus $1.50 per unit sold.Exercise 21-8 (10 minutes)
21-1209
0
$500,00
0
$1,000,0
00
00
$3,500,0
00
$4,000,0
00
0 5,00
0
10,00
0
15,000 20,00
0
25,00
0
Unit
s
Sale
Chapter 21 – Cost-Volume-Profit Analysis
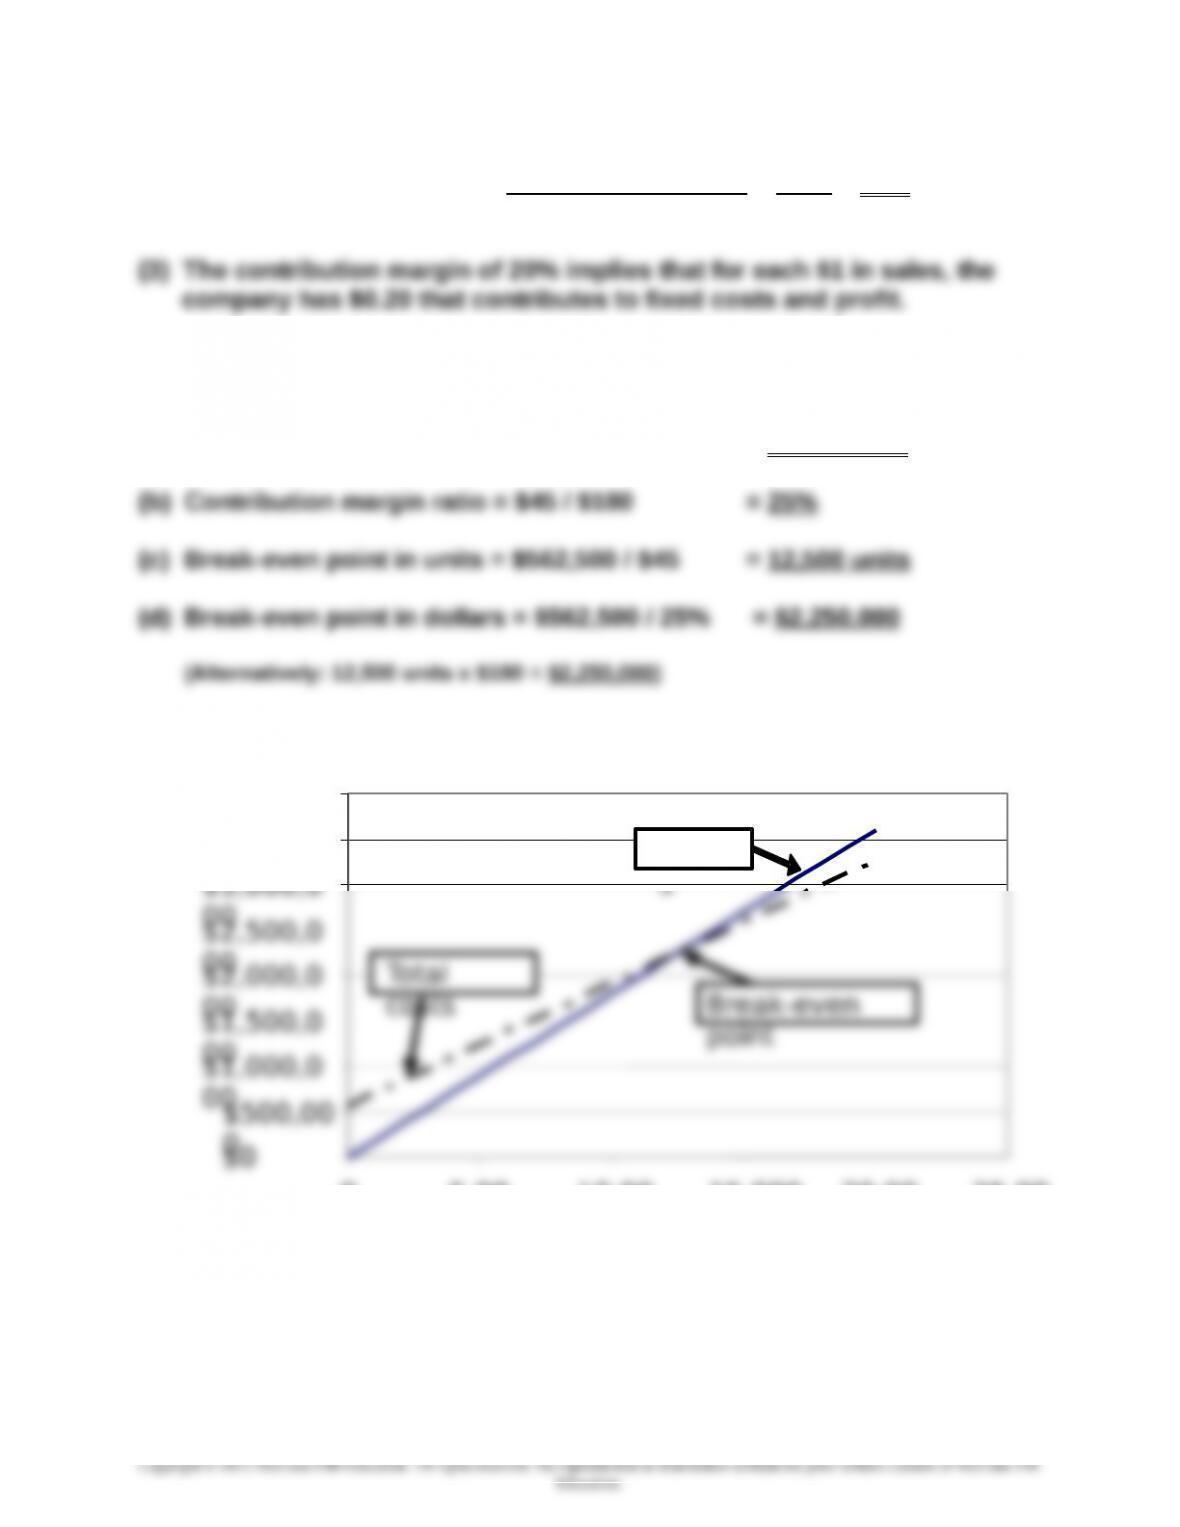
(2) Contribution margin ratio = Contribution margin = $41 = 20%
Sales price $205
Exercise 21-9 (30 minutes)
(a) Contribution margin per unit = $180 – $135 = $45 per unit
Exercise 21-10 (15 minutes)
21-1210
Chapter 21 – Cost-Volume-Profit Analysis
Exercise 21-11 (20 minutes)
1.
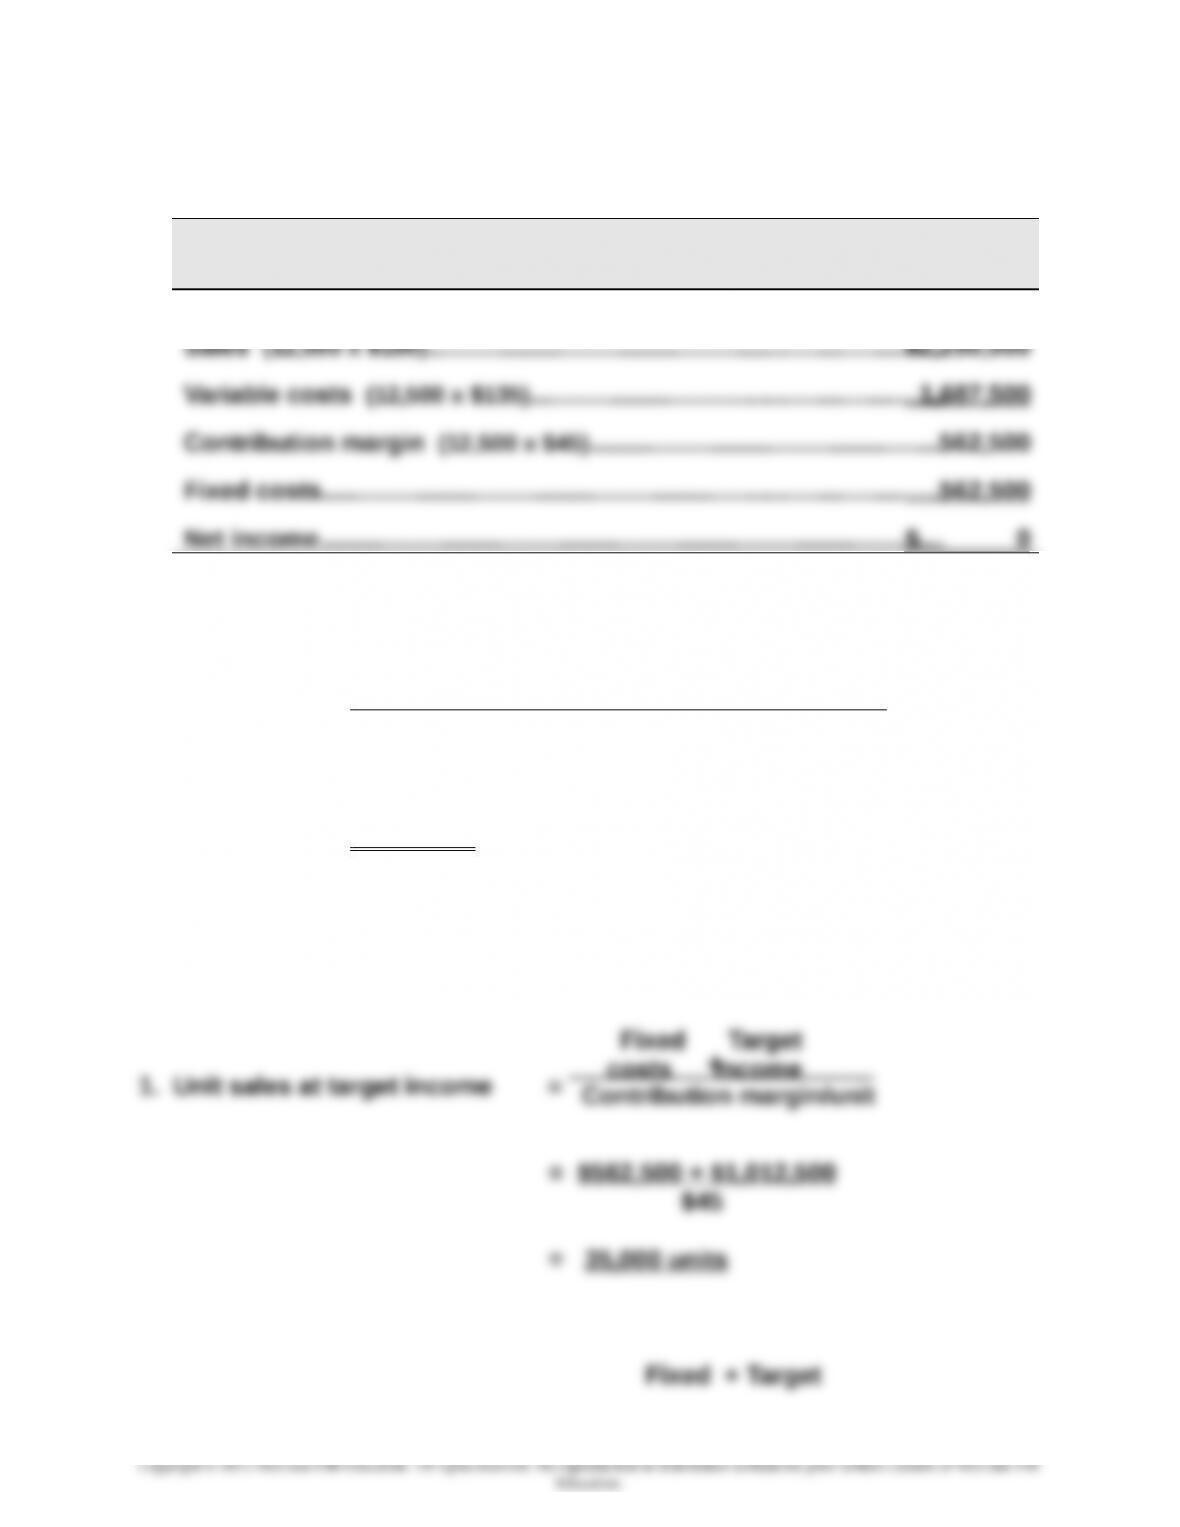
BLANCHARD COMPANY
Contribution Margin Income Statement (at Break-Even)
2. Sales (in dollars) to break even with increased fixed costs
Break-even = (Original fixed costs + Additional fixed costs)
Contribution margin ratio
= ($562,500 + $135,000) / 25%
= $2,790,000
Exercise 21-12 (25 minutes)
21-1211
Copyright © 2015 McGraw-Hill Education. All rights reserved. No reproduction or distribution without the prior written consent of McGraw-Hill
Education.
Fixed Target
costs income
+
Chapter 21 – Cost-Volume-Profit Analysis
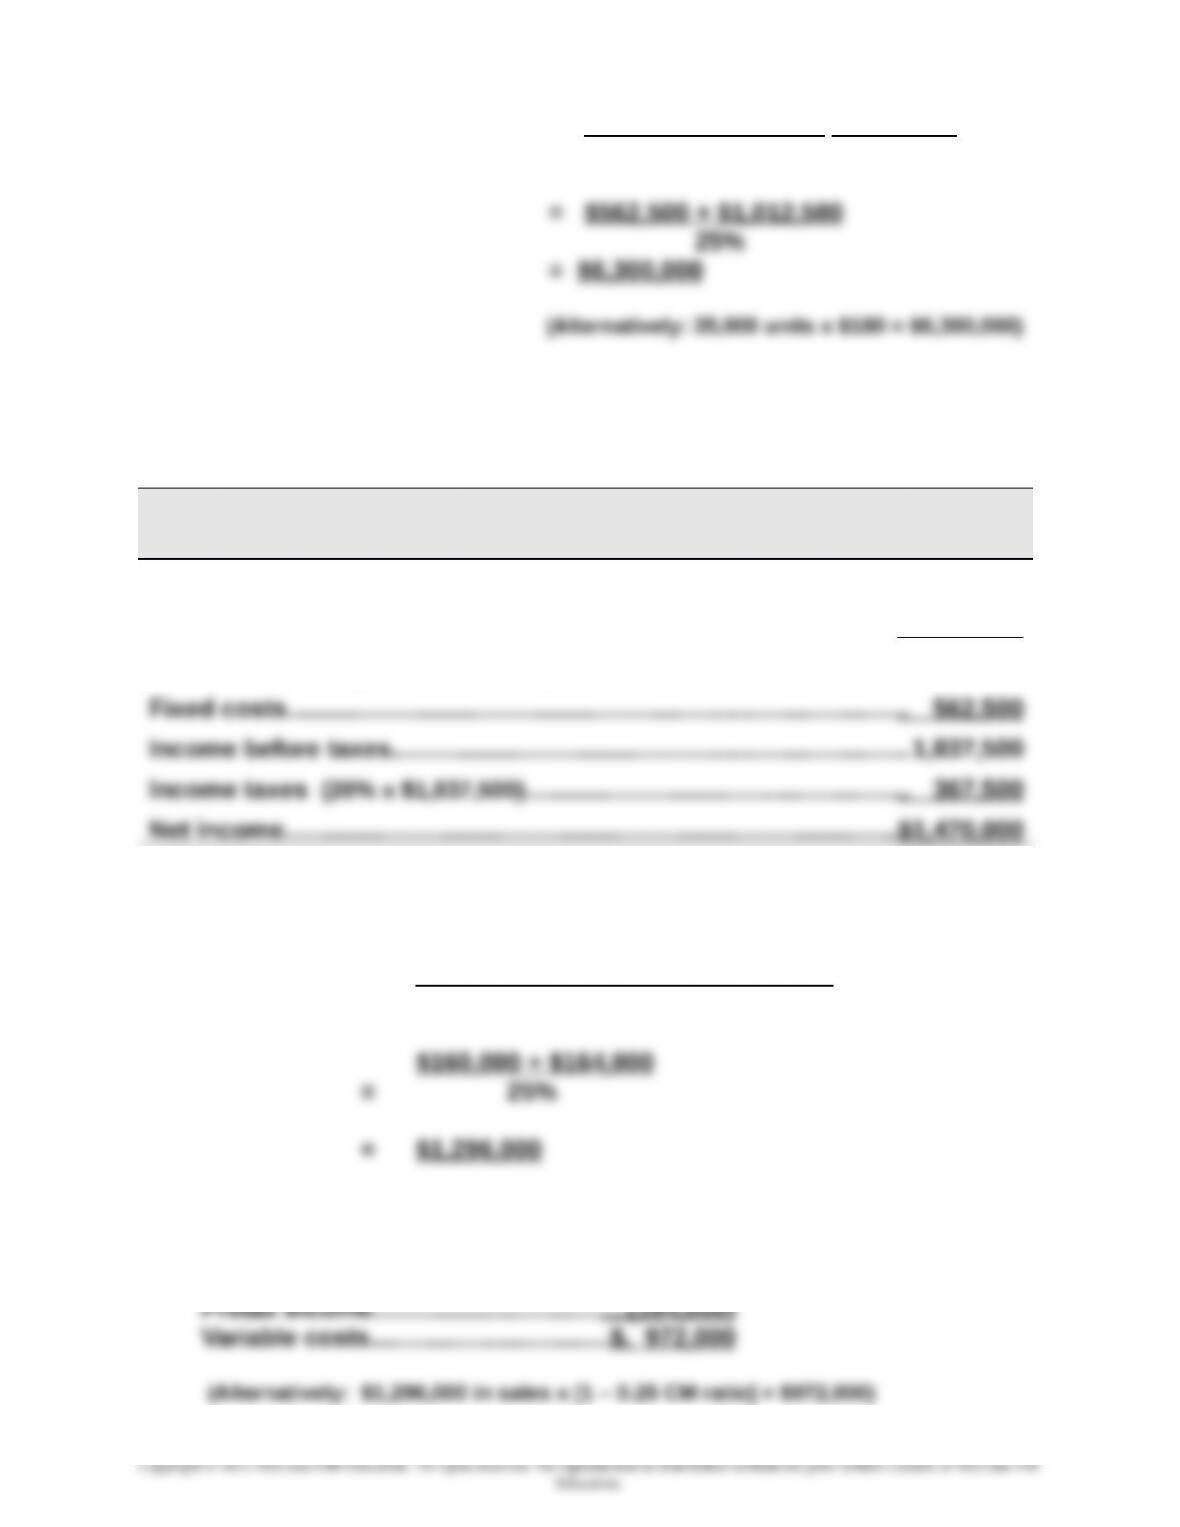
2. Dollar sales at target income = costs income
Contribution margin ratio
Exercise 21-13 (20 minutes)
BLANCHARD COMPANY
Forecasted Contribution Margin Income Statement
Sales (40,000 x $200)……………………………………………..………………...$8,000,000
Variable costs (40,000 x $140)……………………..……………..……………. 5,600,000
Contribution margin (40,000 x $60)……………………………………………2,400,000
Exercise 21-14 (10 minutes)
1. Fixed costs + Target pretax income
Dollar sales = Contribution margin ratio
2.
Sales……………………..…..………………...$1,296,000
Fixed costs………………………………..….(160,000)
21-1212
Chapter 21 – Cost-Volume-Profit Analysis
Exercise 21-15 (30 minutes)
(a) Total expected variable costs
= Variable costs per unit x units produced and sold
= $60* x 200,000 units
= $12,000,000
(b) To solve, set up a brief contribution margin income statement
Sales (given)………………………………………………………..…………$17,000,000
Variable costs (from part a)……………………………………………..(12,000,000)
Fixed costs……………………………………………………..……………..( ? )
Pretax income (given)……………………………………………………..$ 1,250,000
Exercise 21-16 (10 minutes)
1. Break-even in units = Fixed costs / Contribution margin per unit
= $324,000 / ($225 – $180) = 7,200 units
Exercise 21-17 (15 minutes)
1. Dollar sales for target income = Fixed costs + Target income
Contribution margin ratio
21-1213
Chapter 21 – Cost-Volume-Profit Analysis
2. Margin of safety (%) = Expected sales – breakeven sales
Expected sales
Exercise 21-18 (15 minutes)
HUDSON CO.
Forecasted Contribution Margin Income Statement
For Year Ended December 31, 2016
Sales (9,600 x $225)……………………………………………..………………....$2,160,000
Variable costs (9,600 x $171*)…………………………………………..……… 1,641,600
*Revised variable costs = $180 – $9 = $171 per unit
Exercise 21-19 (10 minutes)
1. Revised contribution margin per unit = $240 – $180 = $60
Exercise 21-20 (15 minutes)
HUDSON CO.
Forecasted Contribution Margin Income Statement
For Year Ended December 31, 2016
21-1214
Chapter 21 – Cost-Volume-Profit Analysis
Sales (11,000 x $225)……………………………………….…………..………….$2,475,000
Variable costs (11,000 x $180)………………………..………………..……… 1,980,000
Exercise 21-21 (20 minutes)
1. Pretax income = Sales – Variable costs – Fixed costs
2. Instructor note: Use equation in Exhibit 21.23;
Unit sales = Fixed costs + Target pretax income
Contribution margin per unit
Exercise 21-22 (25 minutes)
1. Selling price per composite unit
8 windows @ $200 per unit…………………………………..………………....$1,600
2 doors @ $500 per unit…………………………………………..……………… 1,000
Selling price per composite unit………………..…..………………..………$2,600
2. Variable costs per composite unit
21-1215
3. Break-even point in composite units
4. Unit sales of windows and doors at break-even point
Windows: 8 x 1,000 units (from 3)..……….......8,000 units
21-1216
Chapter 21 – Cost-Volume-Profit Analysis
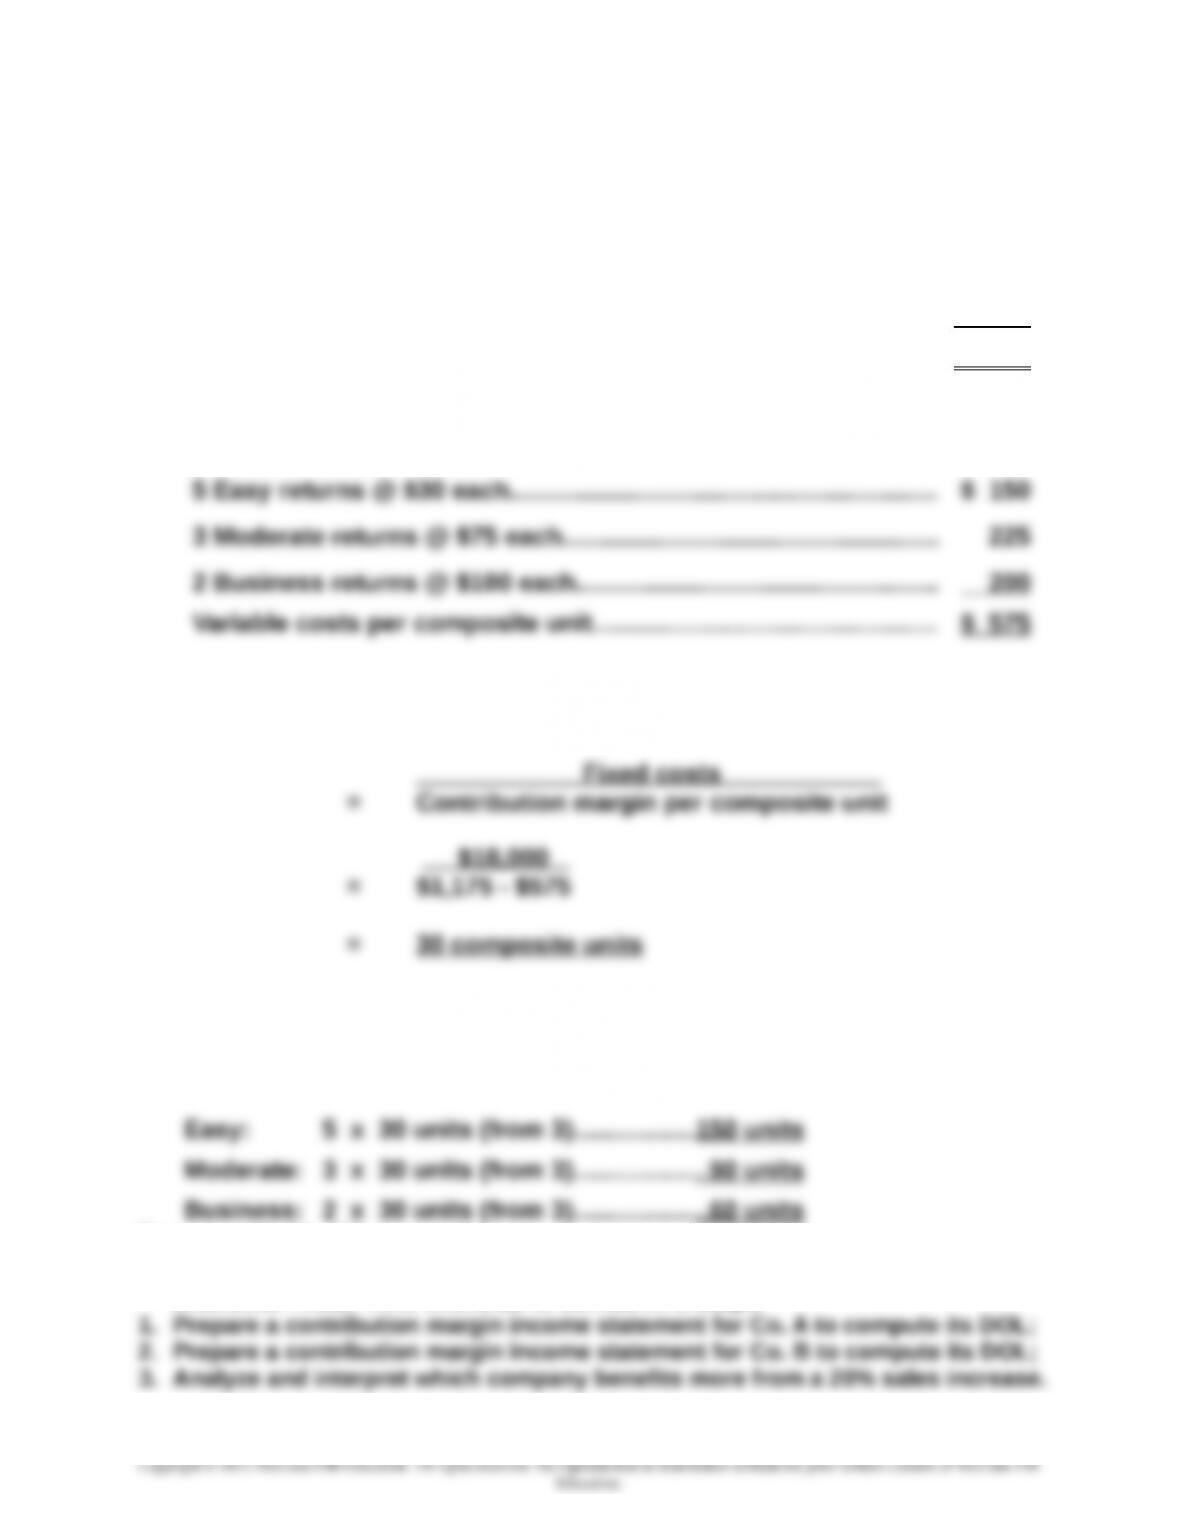
Exercise 21-23 (25 minutes)
1. Selling price per composite unit
5 Easy returns @ $50 each…………………………..……………..………… $ 250
3 Moderate returns @ $125 each………………………………………...…. 375
2 Business returns @ $275 each………………………………………...….
Selling price per composite unit…………………………..………………..
550
$1,175
2. Variable costs per composite unit
3. Break-even point in composite units
4. Unit sales of Easy, Moderate, and Business returns at break-even point
Exercise 21-24 (30 minutes)
Instructor note: This exercise is solved in 3 steps
21-1217
Chapter 21 – Cost-Volume-Profit Analysis
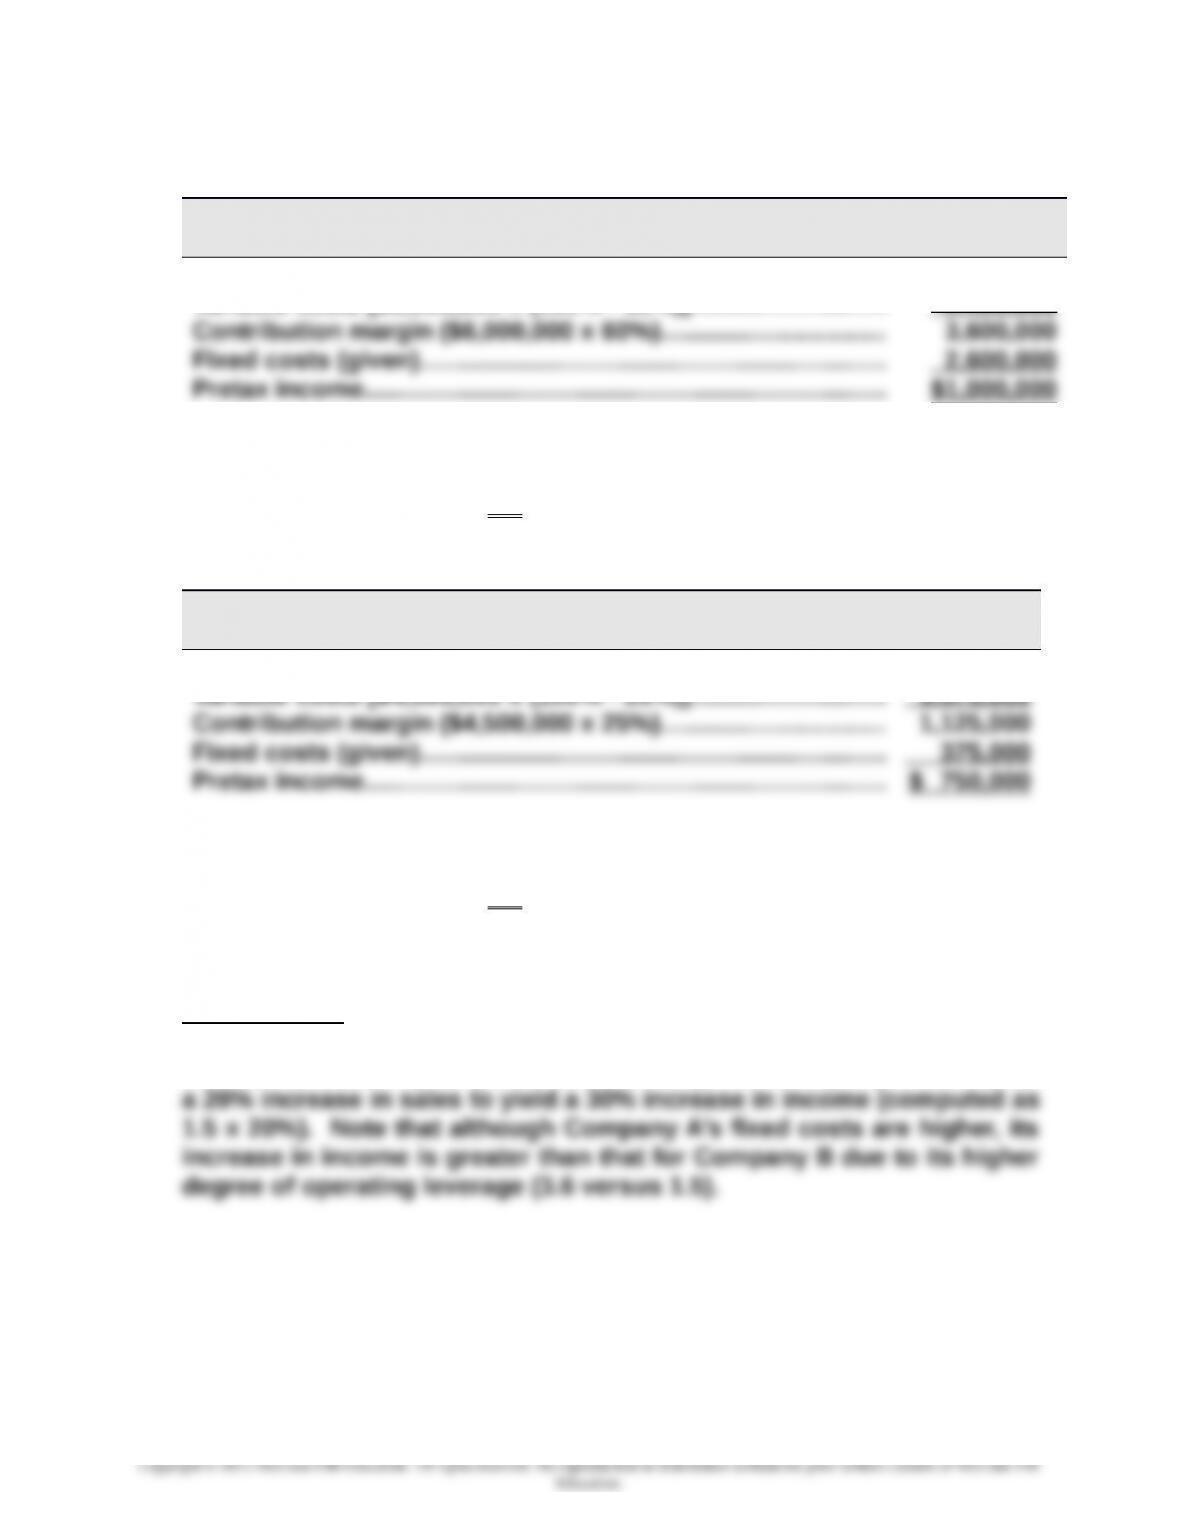
Step 1.
Company A
Contribution Margin Income Statement
Sales (given)……………………………………………..………………..…. $6,000,000
Variable costs [$6,000,000 x (100% – 60%)]…………………….... 2,400,000
Company A’s DOL = Contribution margin in dollars / Pretax income
= $3,600,000 / $1,000,000
= 3.6
Step 2.
Company B
Contribution Margin Income Statement
Sales (given)……………………………………………..………………..…. $4,500,000
Company B’s DOL = Contribution margin in dollars / Pretax income
= $1,125,000 / $750,000
= 1.5
Step 3.
Interpretation: Company A benefits more from a 20% increase in sales.
This is because we expect a 20% increase in sales to yield a 72%
increase in income (computed as 3.6 x 20%). For Company B we expect
21-1218