Exercise 21-6 (20 minutes)
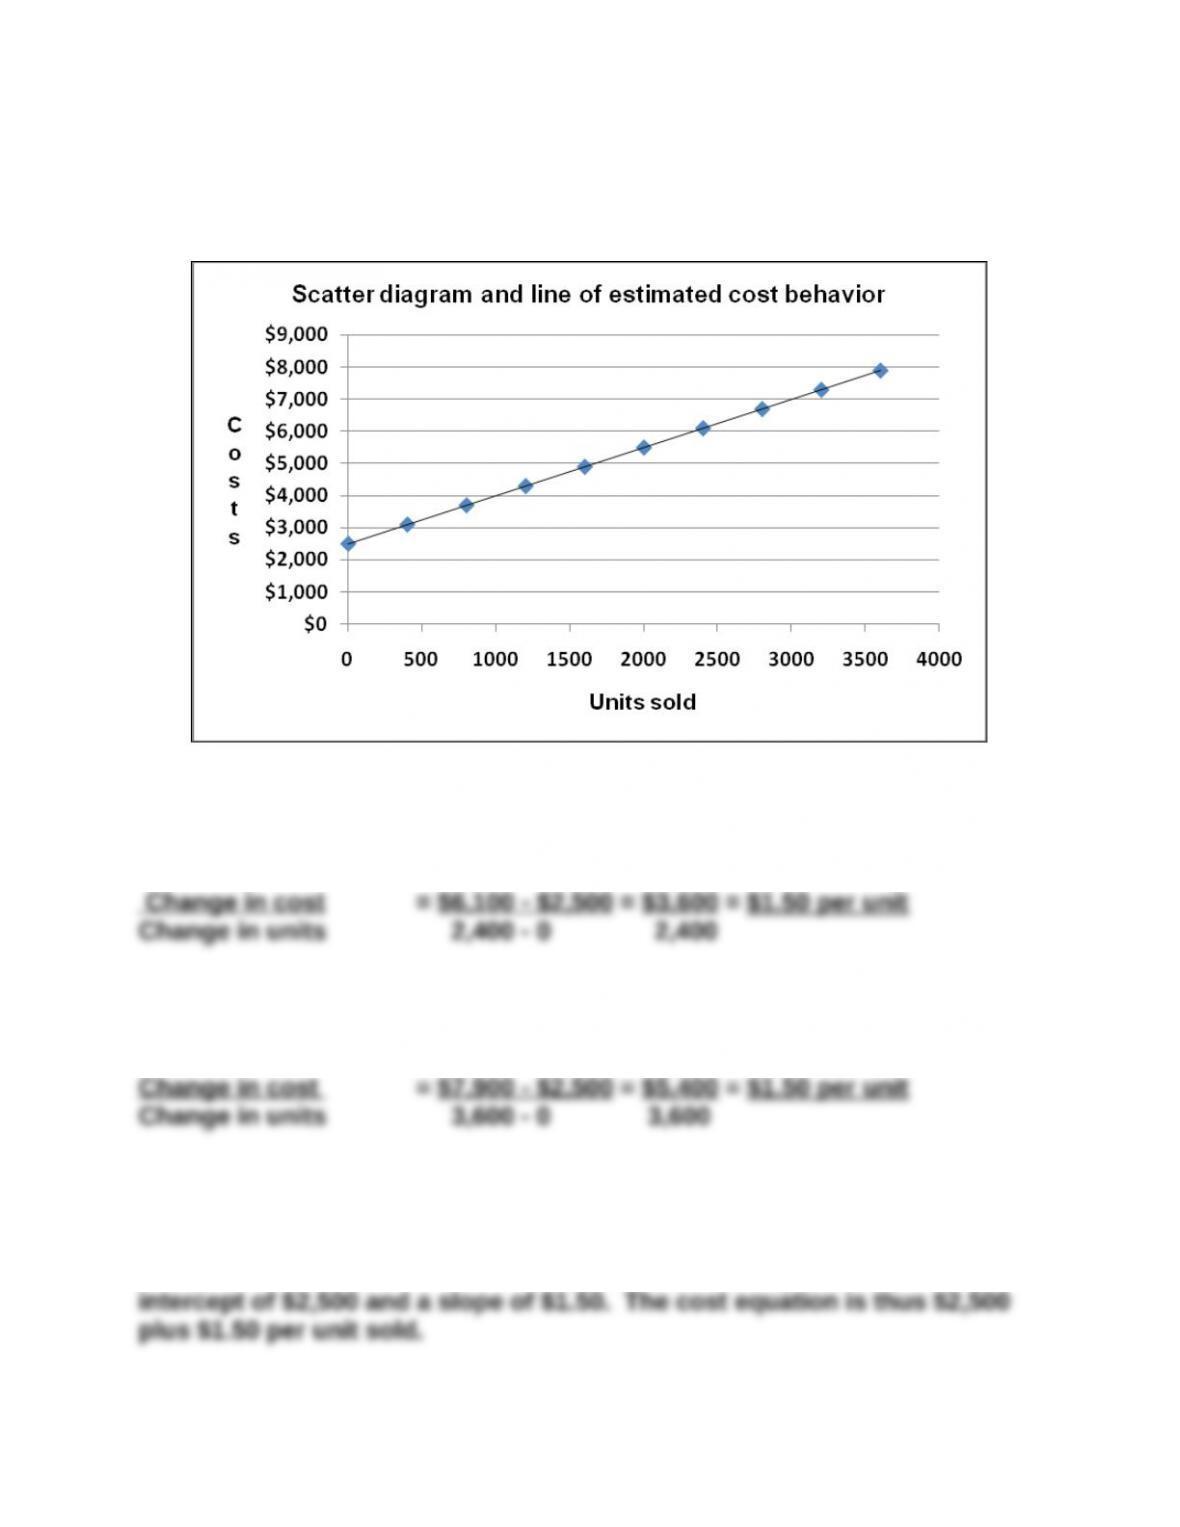
The scatter diagram and line of estimated cost behavior appear below.
Selecting 0 and 2,400 units sold as the activity levels yields $2,500 as the
estimate of fixed costs and the following estimate of variable costs per
unit:
Using the high-low method yields $2,500 as the estimate of fixed costs and
variable costs per unit of:
Exercise 21-7A (20 minutes)
Using Excel® to estimate an ordinary least squares regression yields an
Exercise 21-8 (10 minutes)
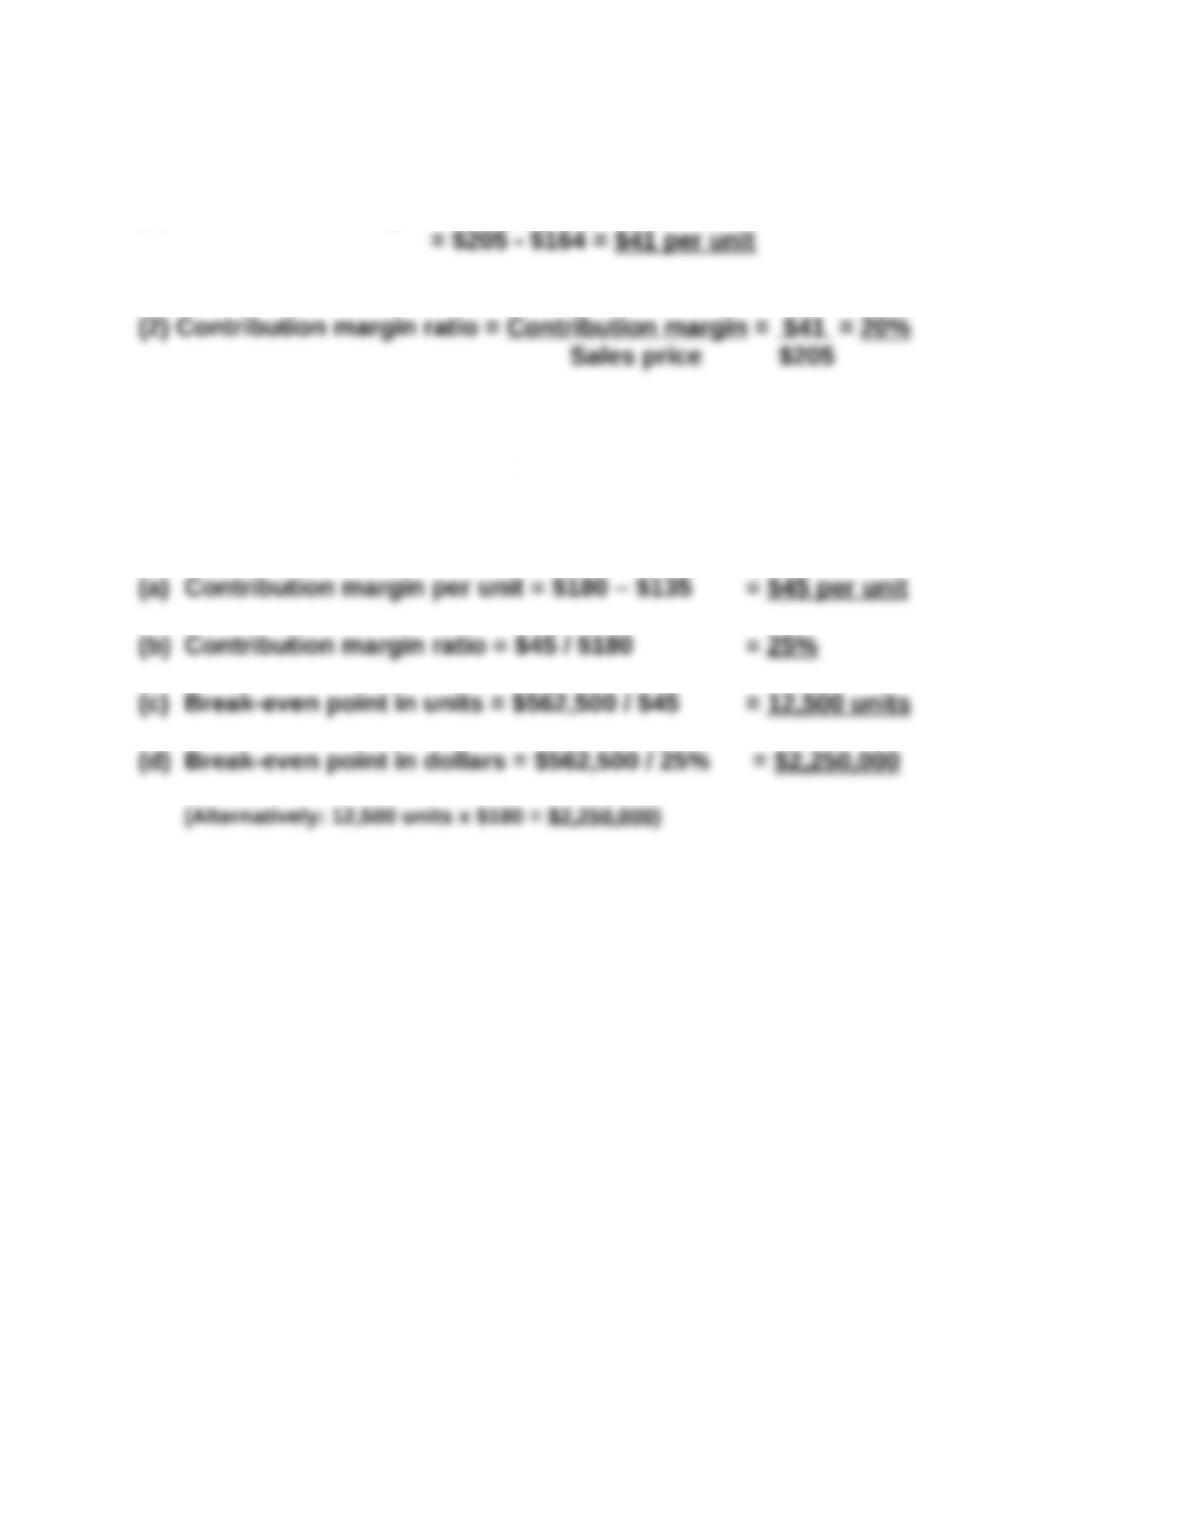
(1) Contribution margin = Selling price – Variable costs
(3) The contribution margin of 20% implies that for each $1 in sales, the
company has $0.20 that contributes to fixed costs and profit.
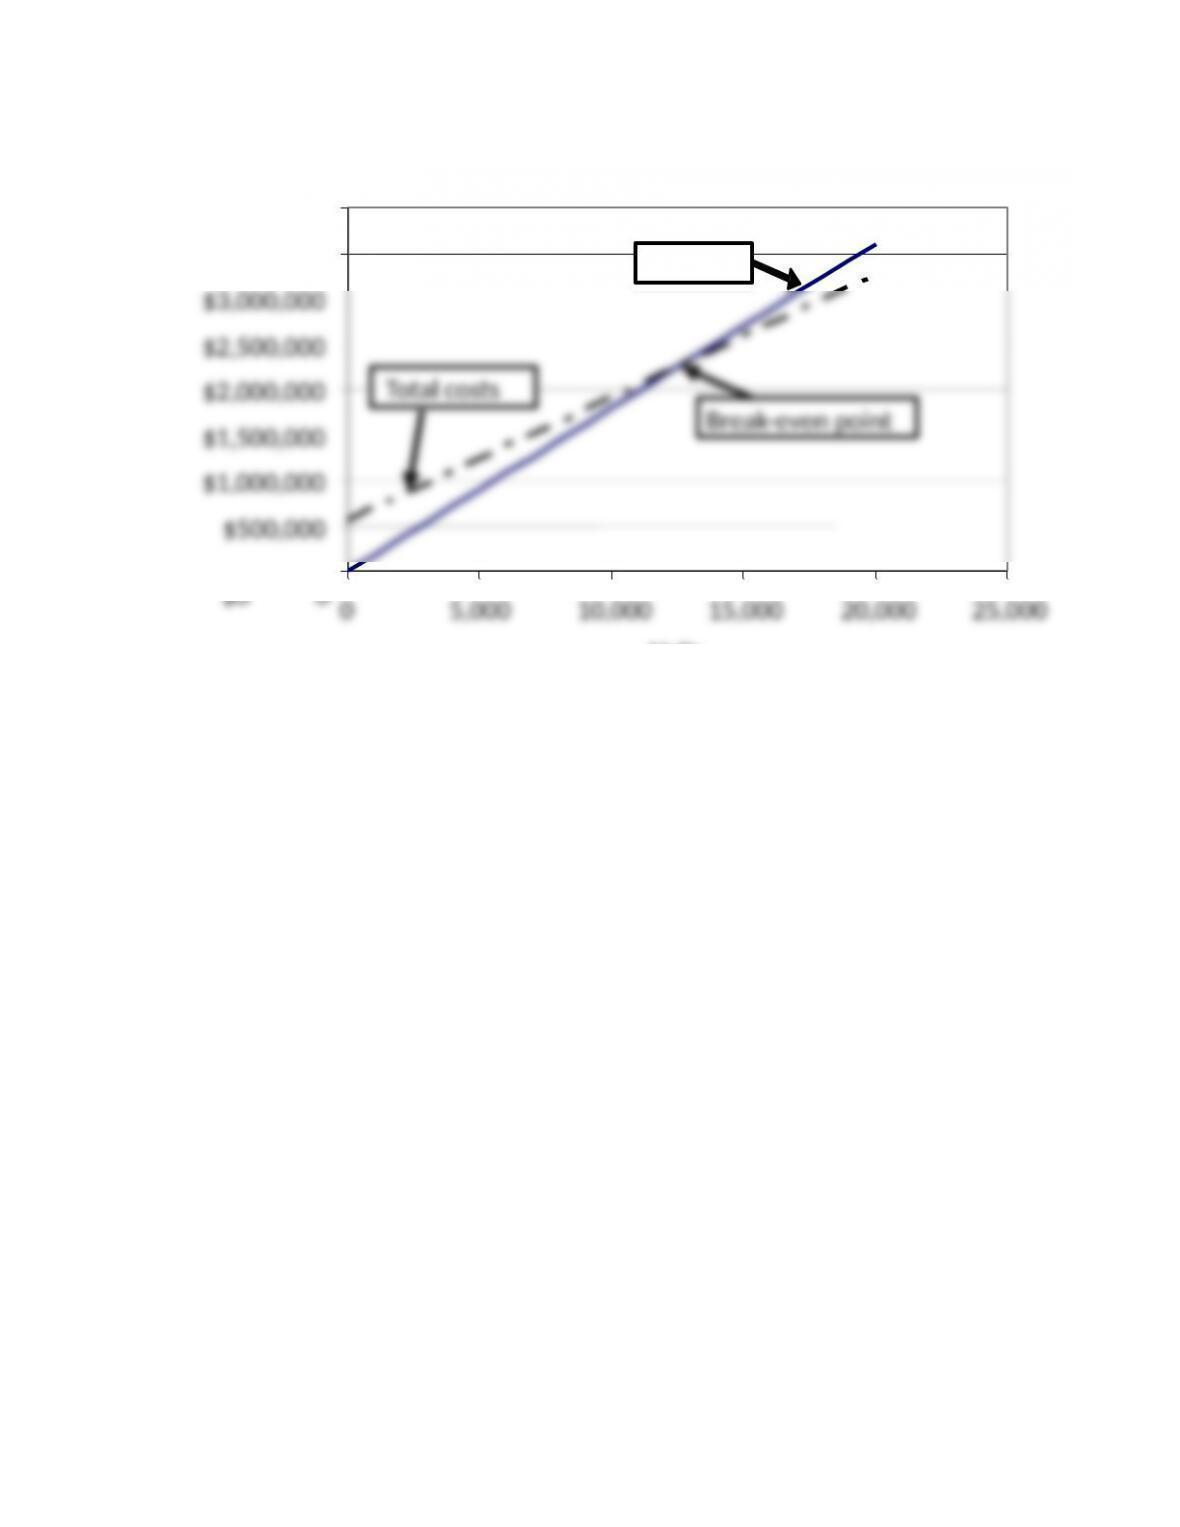
Exercise 21-9 (30 minutes)
$1,000,000
$1,500,000
$2,000,000
$2,500,000
$3,000,000
$3,500,000
$4,000,000
Units
Sales
Total costs
Break-even point
Exercise 21-10 (15 minutes)
Exercise 21-11 (20 minutes)
1.
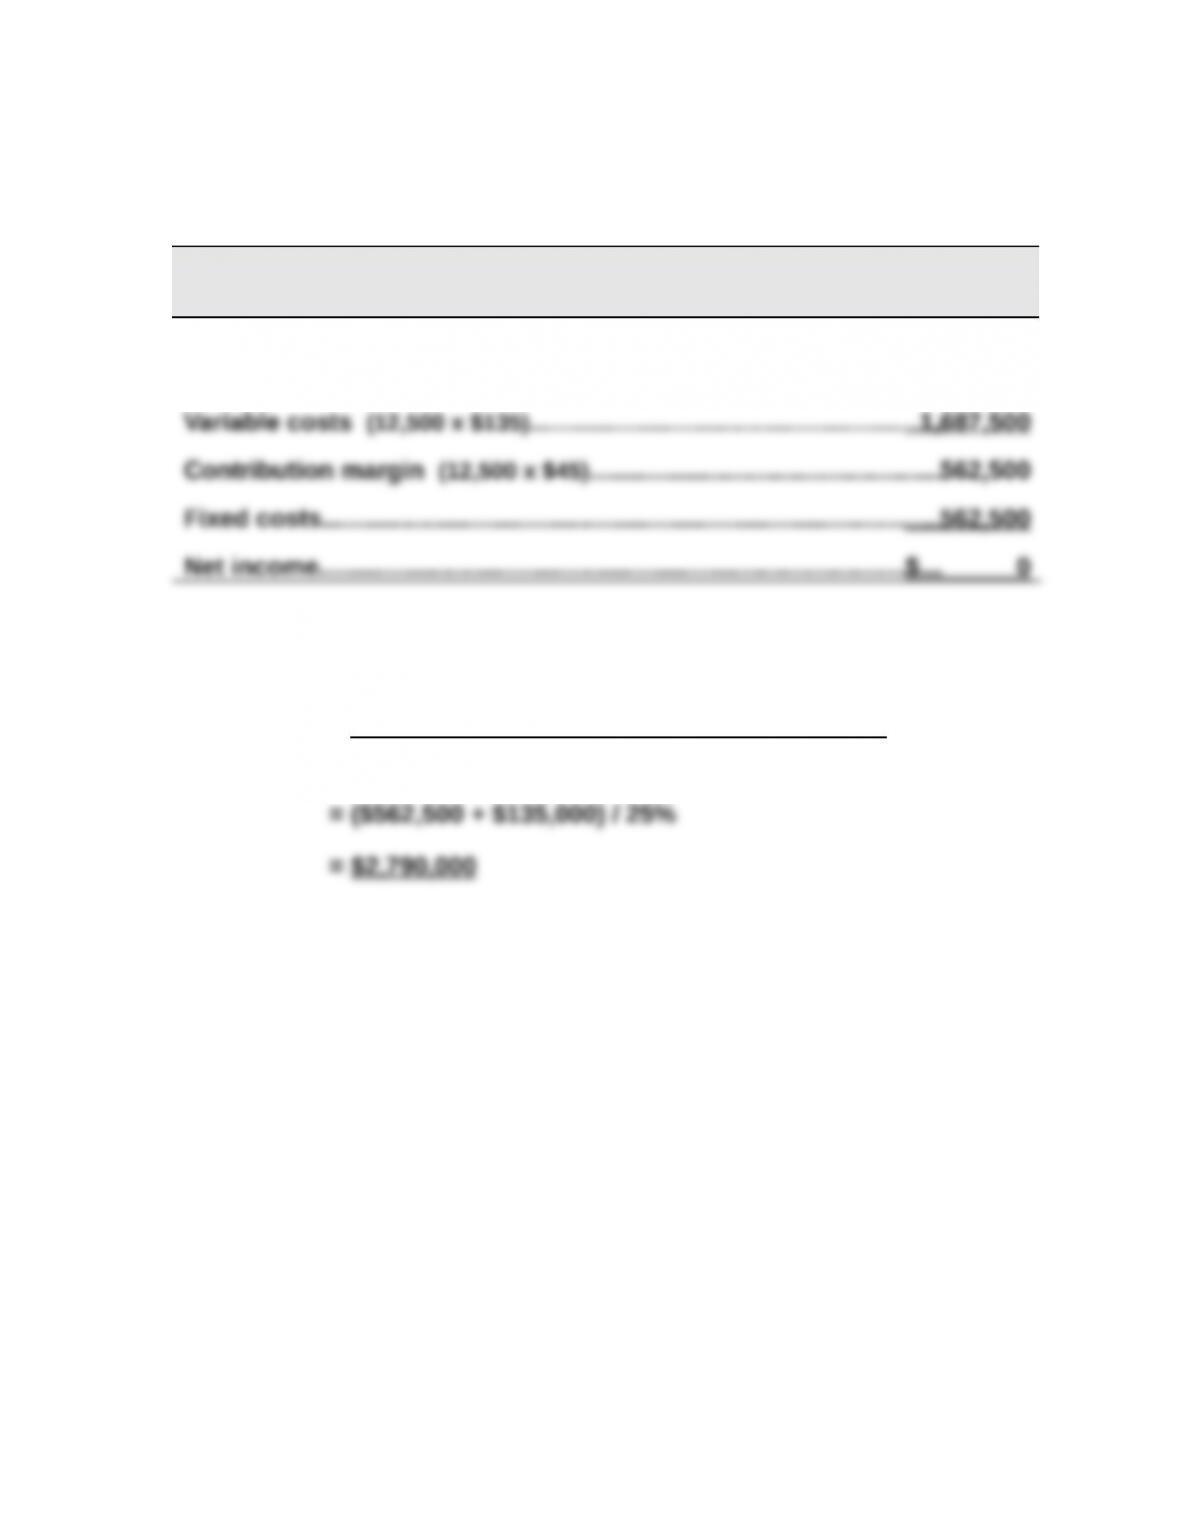
BLANCHARD COMPANY
Contribution Margin Income Statement (at Break-Even)
Sales (12,500 x $180)………………………………………………………………$2,250,000
2. Sales (in dollars) to break even with increased fixed costs
Break-even = (Original fixed costs + Additional fixed costs)
Contribution margin ratio
Exercise 21-12 (25 minutes)
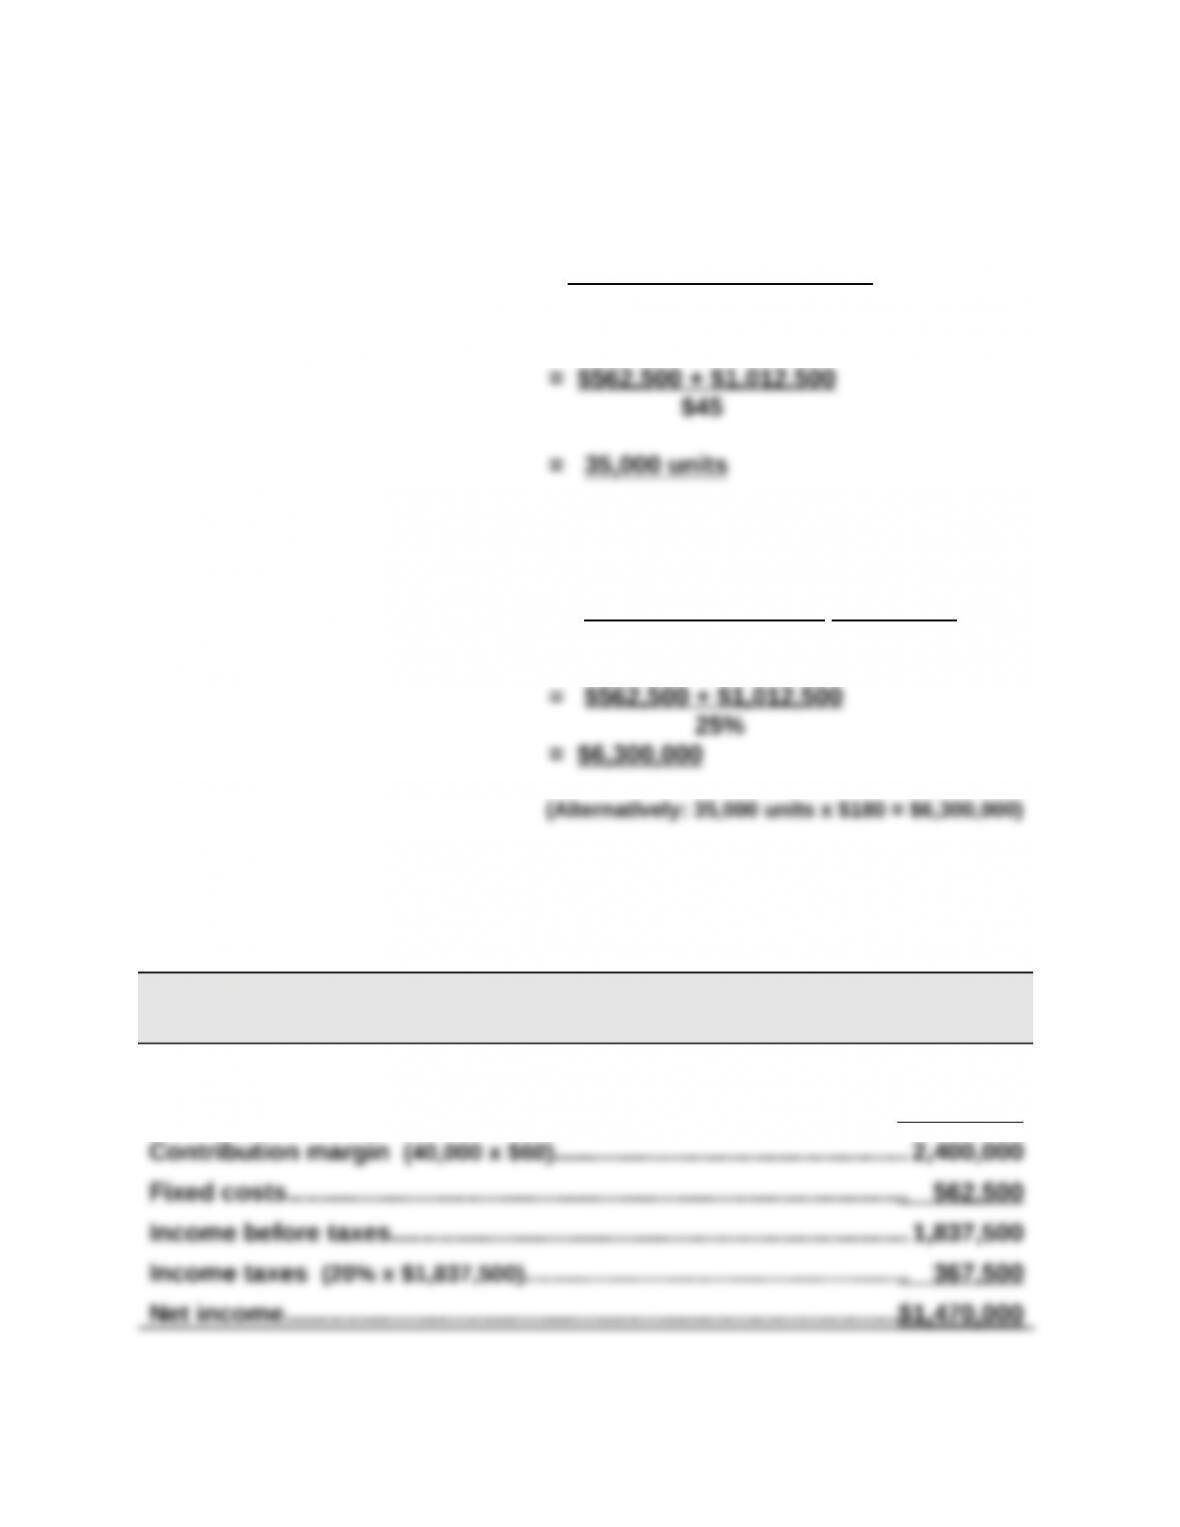
1. Unit sales at target income =
Fixed + Target
2. Dollar sales at target income = costs income
Contribution margin ratio
Exercise 21-13 (20 minutes)
BLANCHARD COMPANY
Forecasted Contribution Margin Income Statement
Sales (40,000 x $200)………………………………………………………………$8,000,000
Variable costs (40,000 x $140)…………………………………………………. 5,600,000
Fixed Target
costs income
Contribution margin/unit
+
Exercise 21-14 (10 minutes)
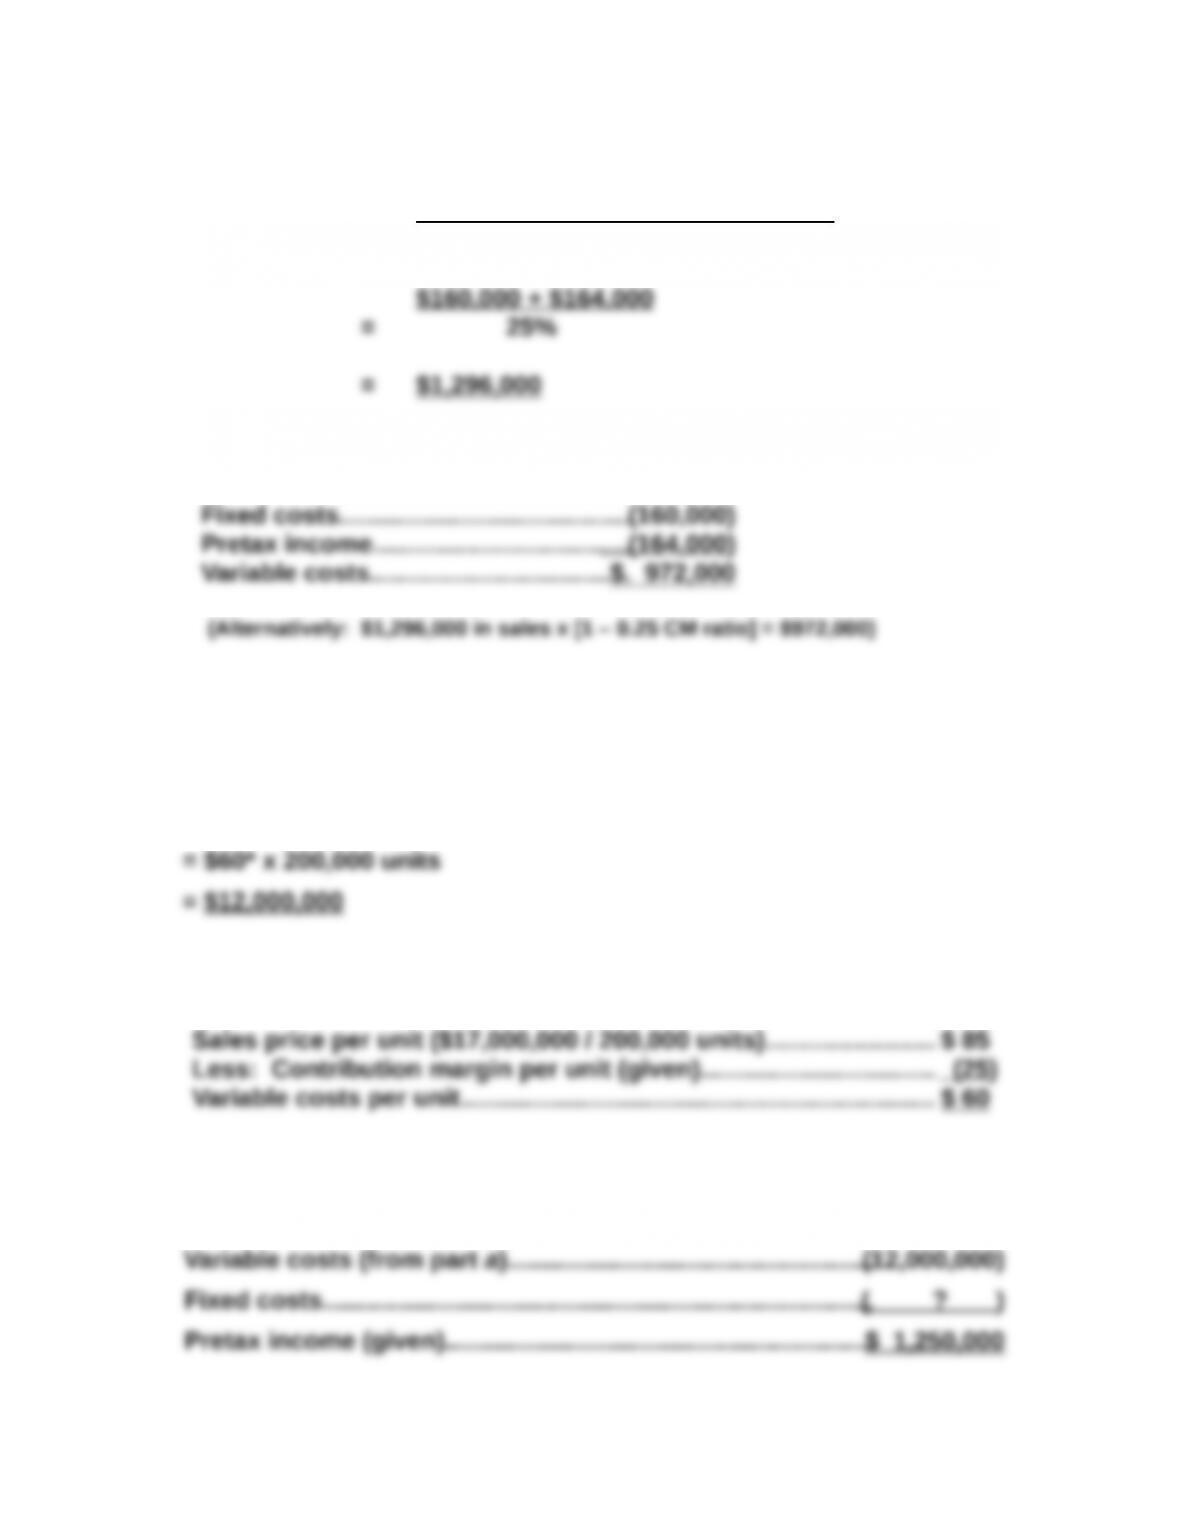
1. Fixed costs + Target pretax income
Dollar sales = Contribution margin ratio
2.
Sales……………………………………………$1,296,000
Exercise 21-15 (30 minutes)
(a) Total expected variable costs
= Variable costs per unit x units produced and sold
*The $60 variable costs per unit is computed by determining (i) sales
price per unit and (ii) subtracting contribution margin per unit:
(b) To solve, set up a brief contribution margin income statement
Sales (given)…………………………………………………………………$17,000,000
Exercise 21-16 (10 minutes)
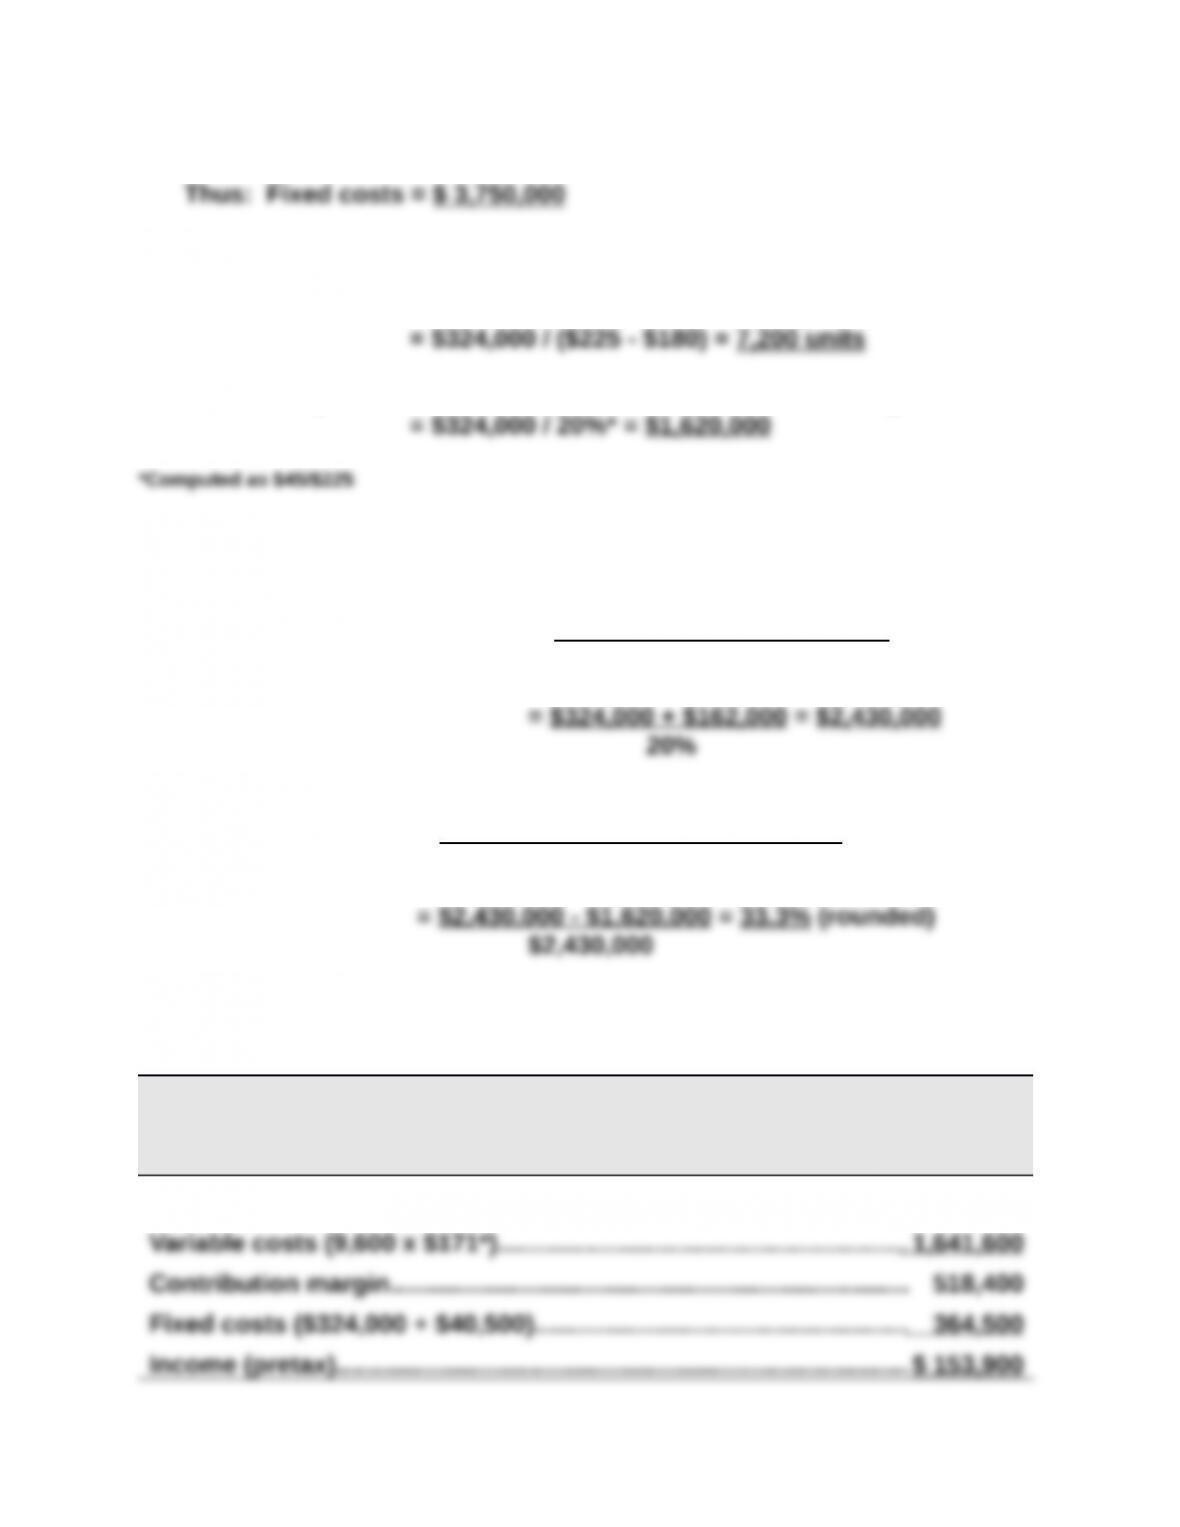
1. Break-even in units = Fixed costs / Contribution margin per unit
2. Break-even point in dollars = Fixed costs / Contribution margin ratio
Exercise 21-17 (15 minutes)
1. Dollar sales for target income = Fixed costs + Target income
Contribution margin ratio
2. Margin of safety (%) = Expected sales – breakeven sales
Expected sales
Exercise 21-18 (15 minutes)
HUDSON CO.
Forecasted Contribution Margin Income Statement
For Year Ended December 31, 2016
Sales (9,600 x $225)……………………………………………………………….$2,160,000
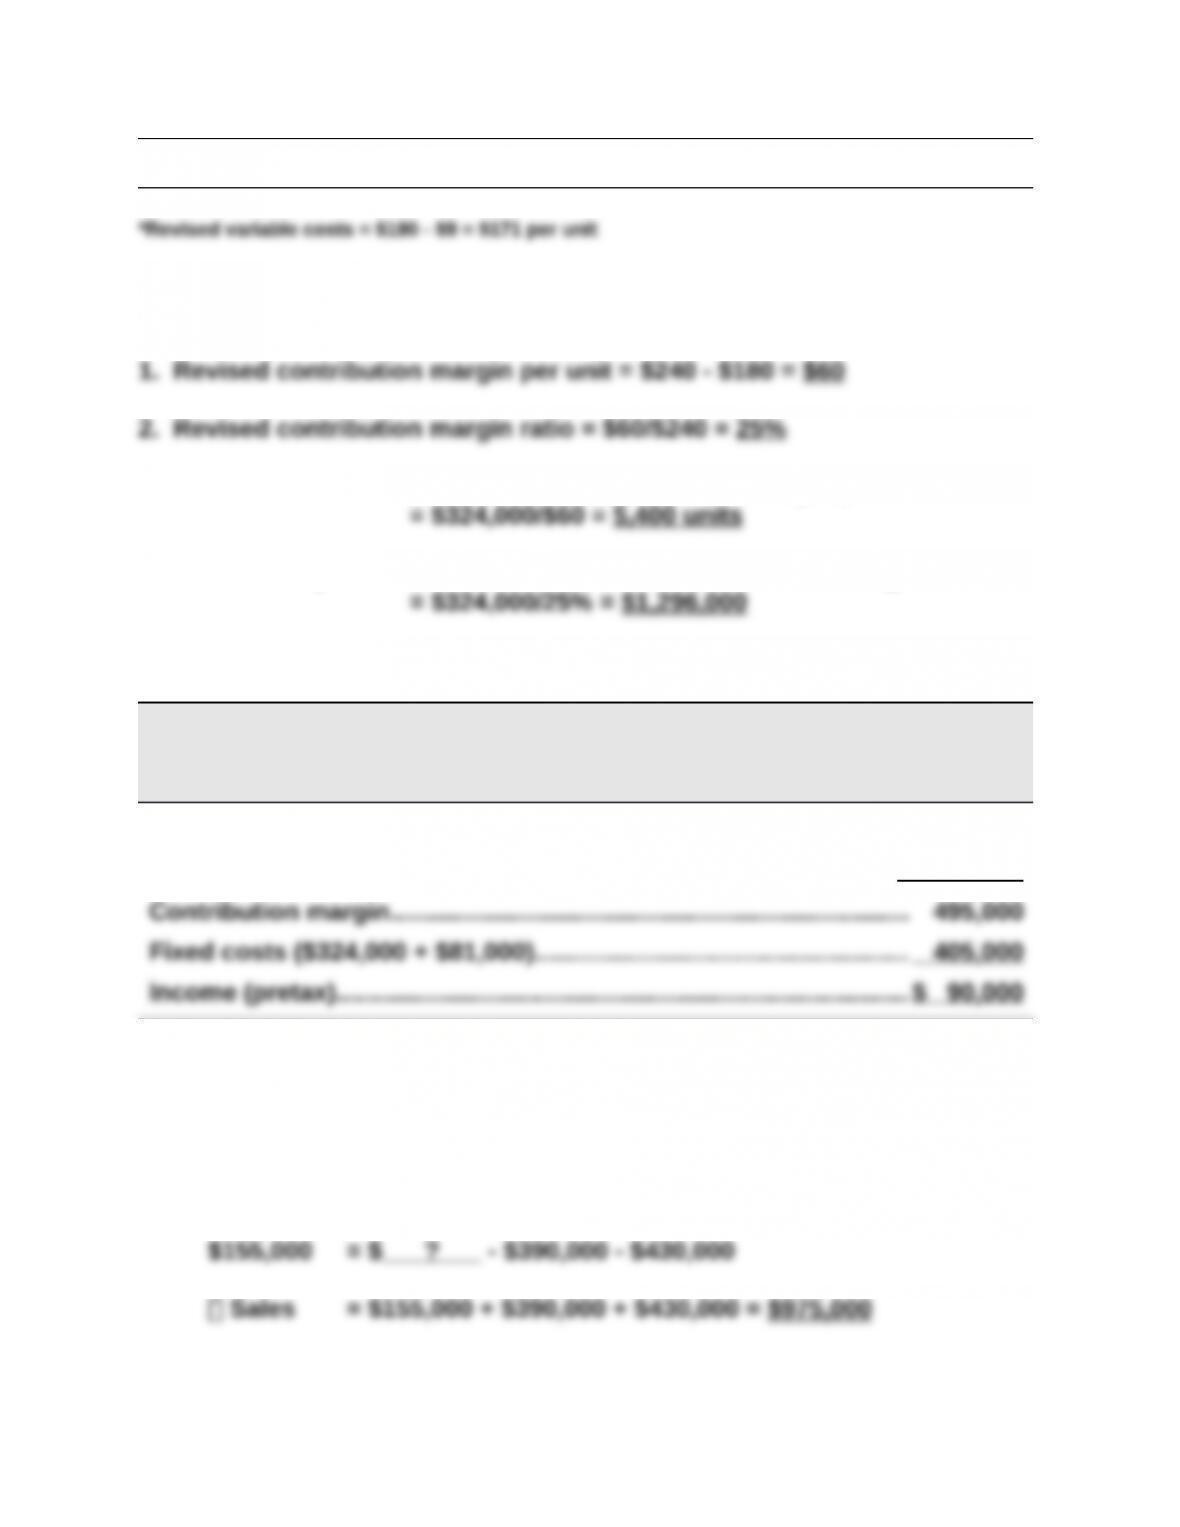
Exercise 21-19 (10 minutes)
3. Break-even in units = Fixed costs / Contribution margin per unit
4. Break-even point in dollars = Fixed costs / Contribution margin ratio
Exercise 21-20 (15 minutes)
HUDSON CO.
Forecasted Contribution Margin Income Statement
For Year Ended December 31, 2016
Sales (11,000 x $225)………………………………………………………………$2,475,000
Variable costs (11,000 x $180)………………………………………………… 1,980,000
Exercise 21-21 (20 minutes)
1. Pretax income = Sales – Variable costs – Fixed costs
2. Instructor note: Use equation in Exhibit 21.23;
Unit sales = Fixed costs + Target pretax income
Contribution margin per unit
Exercise 21-22 (25 minutes)
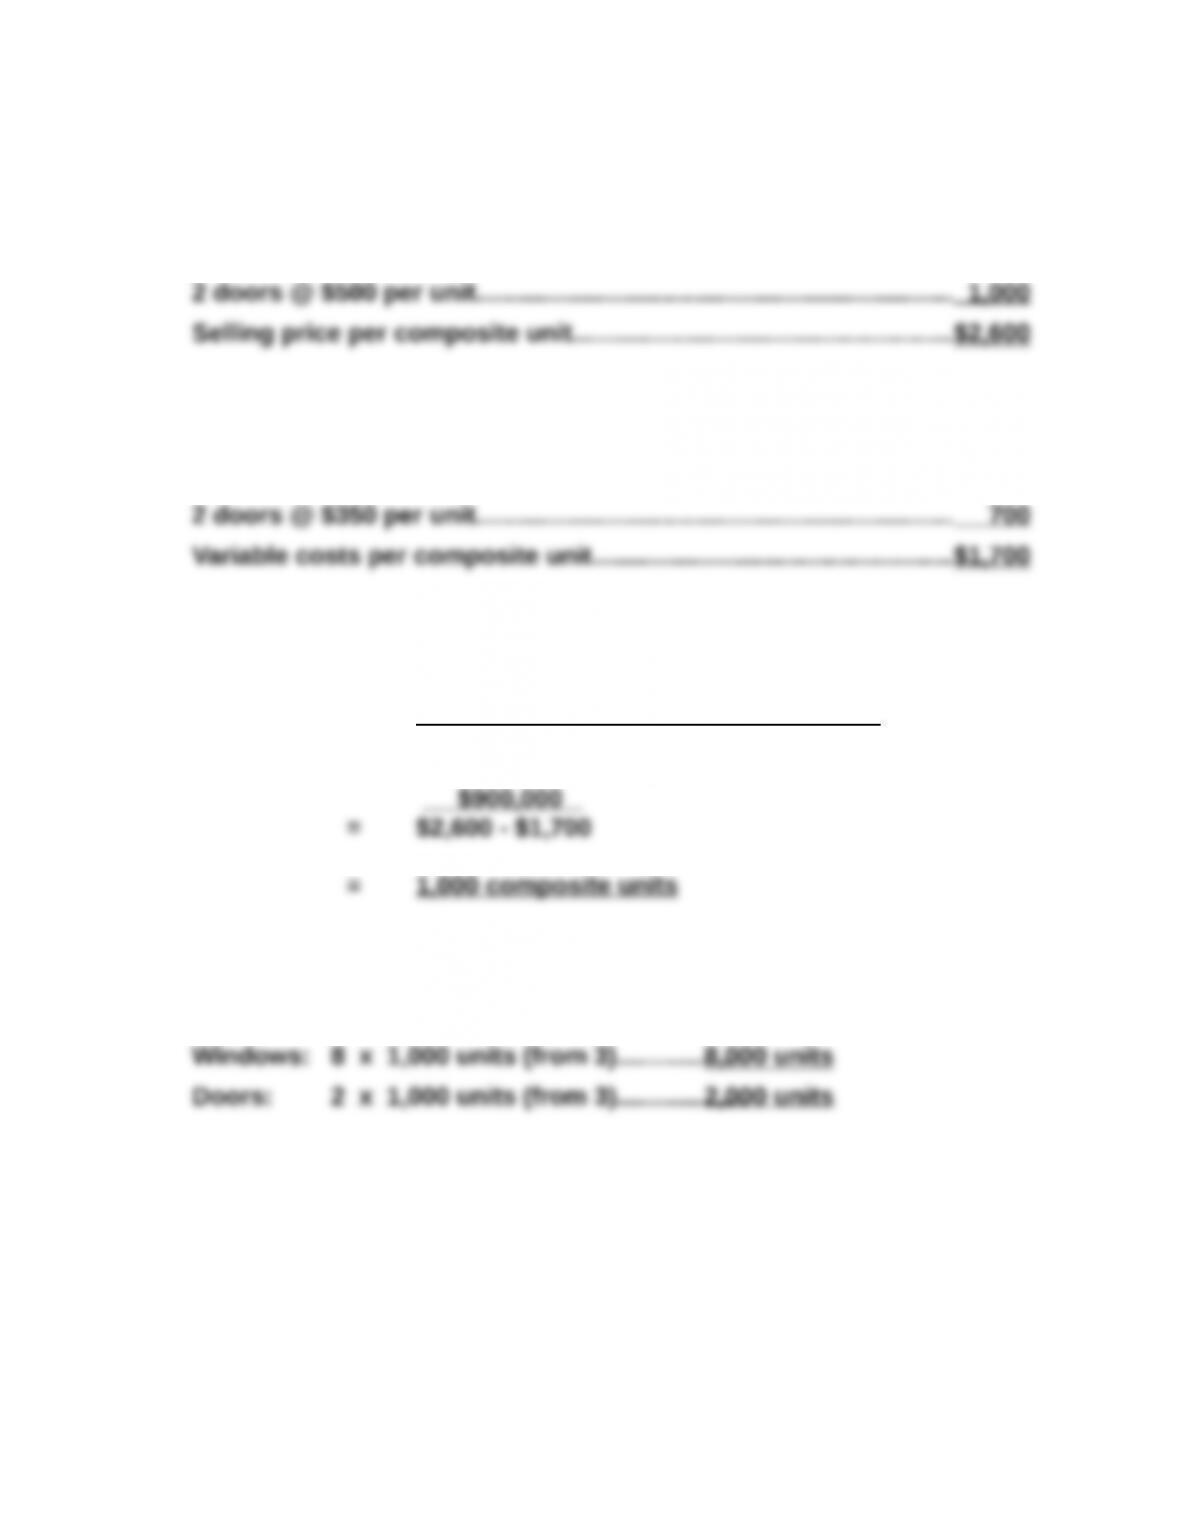
1. Selling price per composite unit
8 windows @ $200 per unit…………………………………………………….$1,600
2. Variable costs per composite unit
8 windows @ $125 per unit…………………………………………………….$1,000
3. Break-even point in composite units
Fixed costs .
= Contribution margin per composite unit
4. Unit sales of windows and doors at break-even point