Chapter 17 – Analysis of Financial Statements
PROBLEM SET B
Problem 17-1B (120 minutes)
Part 1
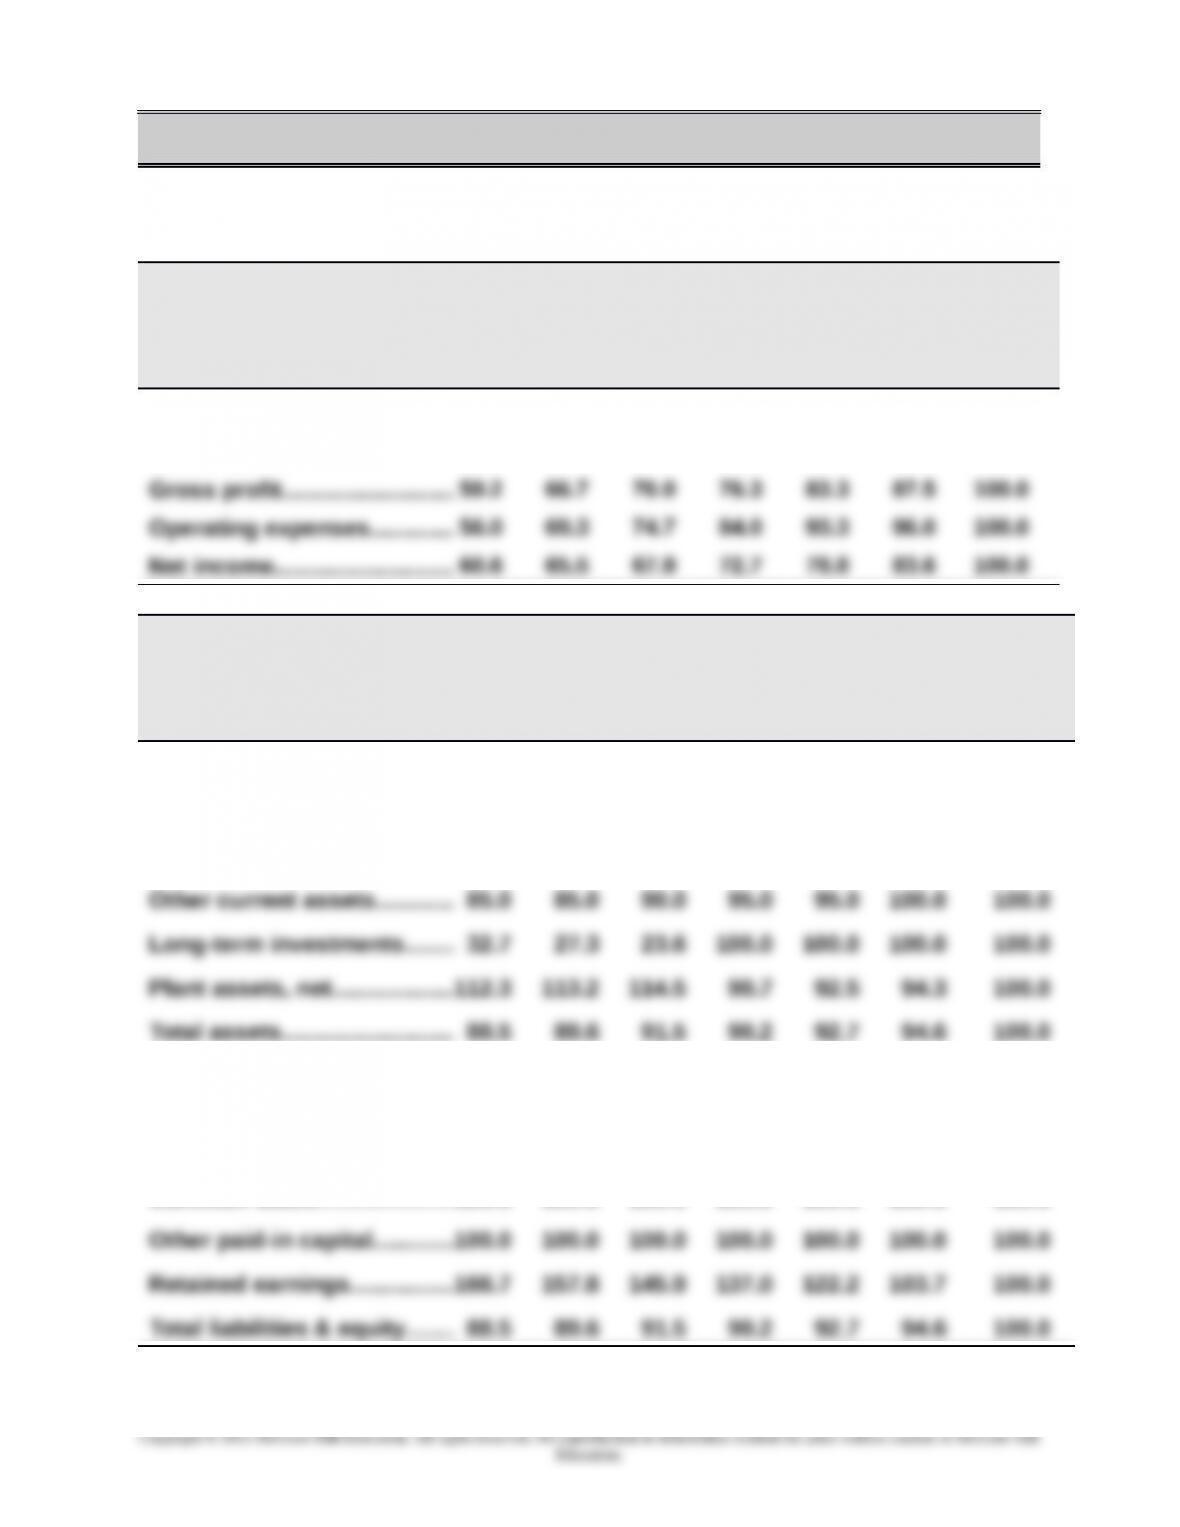
TRIPOLY COMPANY
Income Statement Trends
For Years Ended December 31, 2015-2009
2015 2014 2013 2012 2011 2010 2009
Sales…..………………….….….... 65.1% 70.9% 73.3% 79.1% 86.0% 89.5% 100.0%
Cost of goods sold…………… 72.6 76.3 77.4 82.6 89.5 92.1 100.0
TRIPOLY COMPANY
Balance Sheet Trends
December 31, 2015-2009
2015 2014 2013 2012 2011 2010 2009
Cash……………………..…..…... 64.7% 67.6% 76.5% 79.4% 88.2% 91.2% 100.0%
Accounts recble., net……..… 81.3 85.0 87.5 90.0 93.8 96.3 100.0
Merchandise inventory…..... 79.8 82.7 85.6 86.5 89.4 91.3 100.0
Current liabilities……………… 52.9 55.7 66.4 67.9 75.0 92.9 100.0
Long-term liabilities….…...... 35.4 46.2 54.6 56.9 74.6 82.3 100.0
Common stock…..….…..…....100.0 100.0 100.0 100.0 100.0 100.0 100.0
17-963
Chapter 17 – Analysis of Financial Statements
Problem 17-1B (Concluded)
Part 2
Analysis and Interpretation
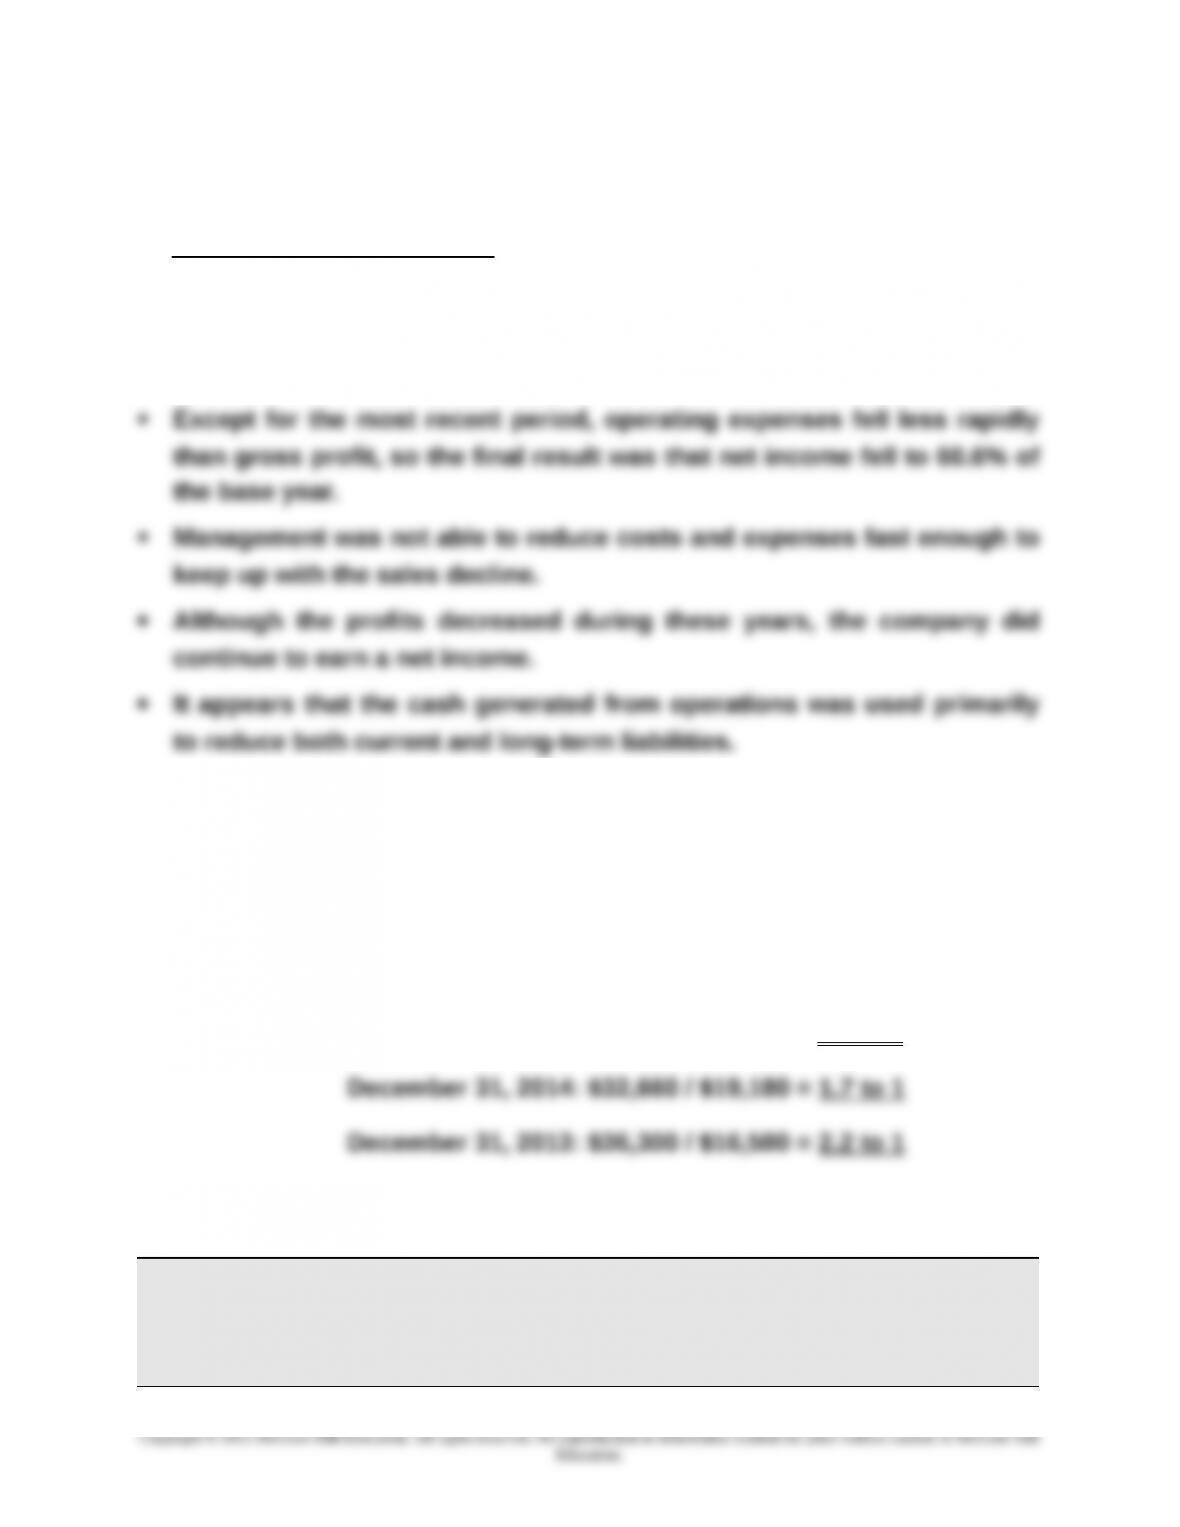
The statements and the trend percent data show that sales declined
every year. However, cost of goods sold did not fall as rapidly as sales.
As a result, gross profit fell more rapidly than sales.
The company made a large expansion of its plant assets during 2013,
financing this expansion primarily through the liquidation of long-term
investments.
Problem 17-2B (60 minutes)
Part 1
Current ratio: December 31, 2015: $54,860 / $22,370 = 2.5 to 1
Part 2
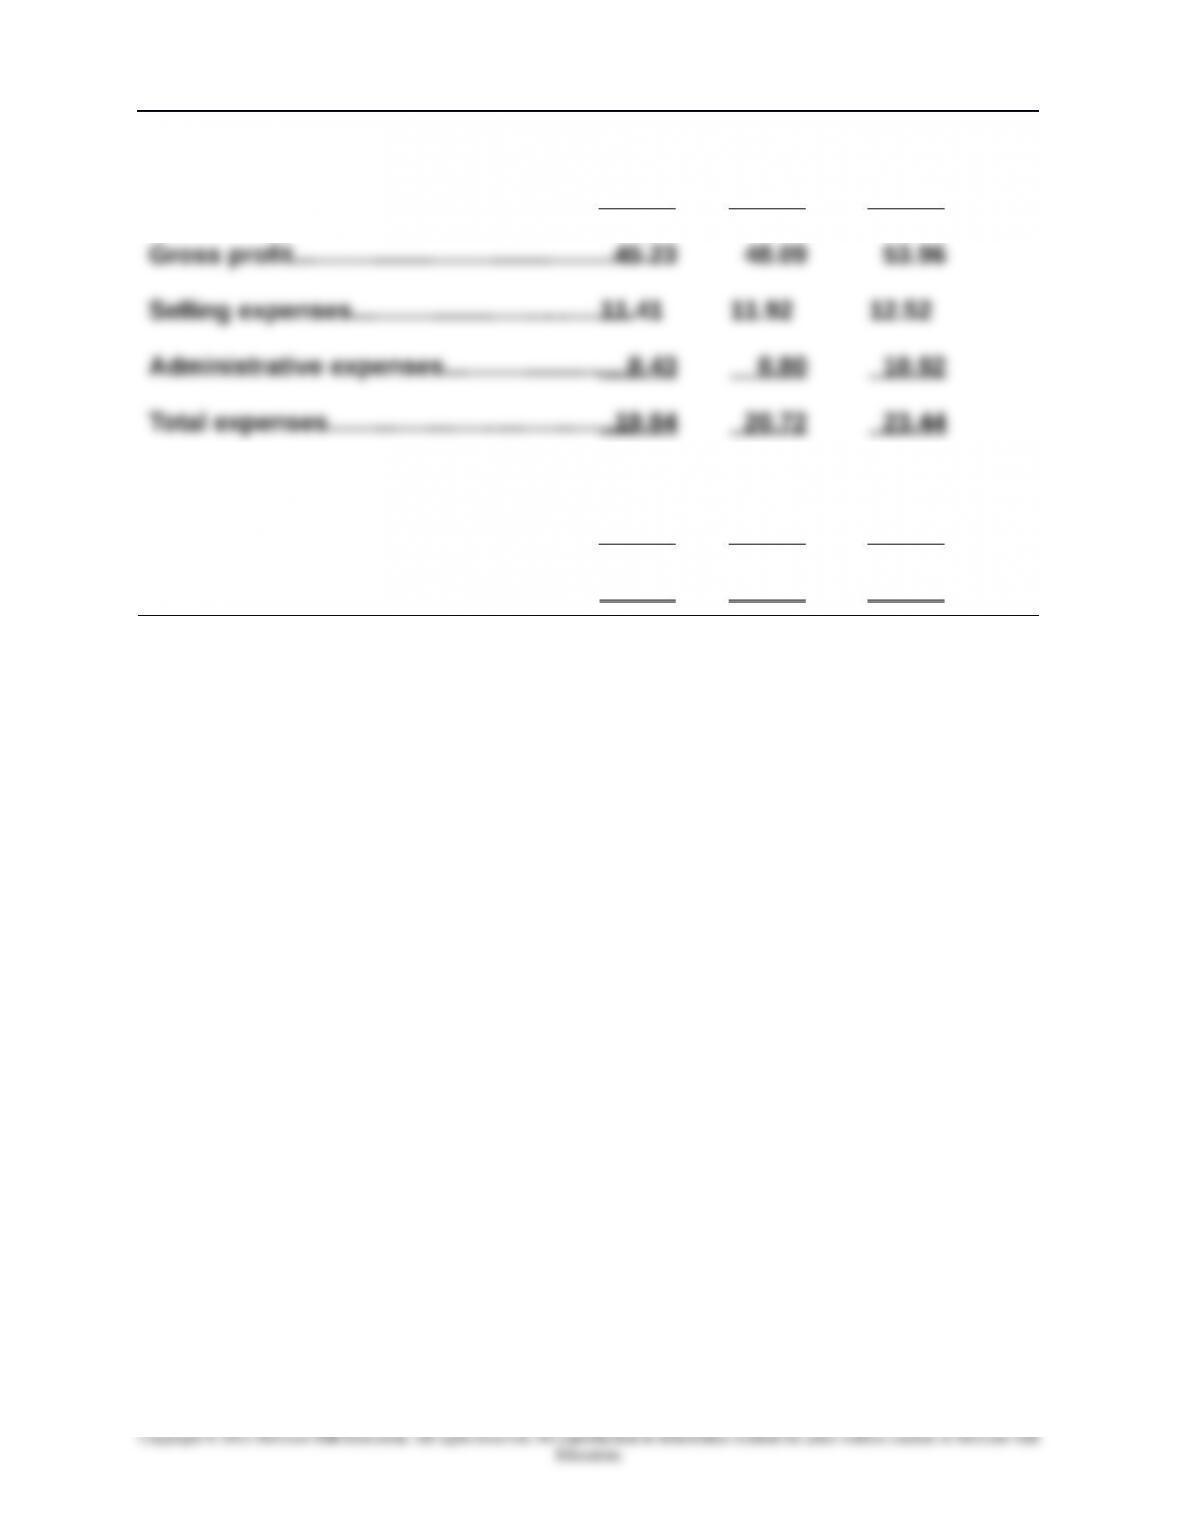
BLUEGRASS CORPORATION
Common-Size Comparative Income Statements
For Years Ended December 31, 2015, 2014, and 2013
2015 2014 2013
17-964
Chapter 17 – Analysis of Financial Statements
Sales…………………………………………….……..100.00% 100.00% 100.00%
Cost of goods sold………………………………. 54.77 51.91 46.04
Income before taxes…………………………….25.39 27.36 30.53
Income taxes……………..……………………….. 3.04 3.56 3.69
Net income………………………………………….. 22.34% 23.80% 26.84%
* Some totals do not reconcile due to rounding.
17-965
Chapter 17 – Analysis of Financial Statements
Problem 17-2B (Concluded)
Part 3
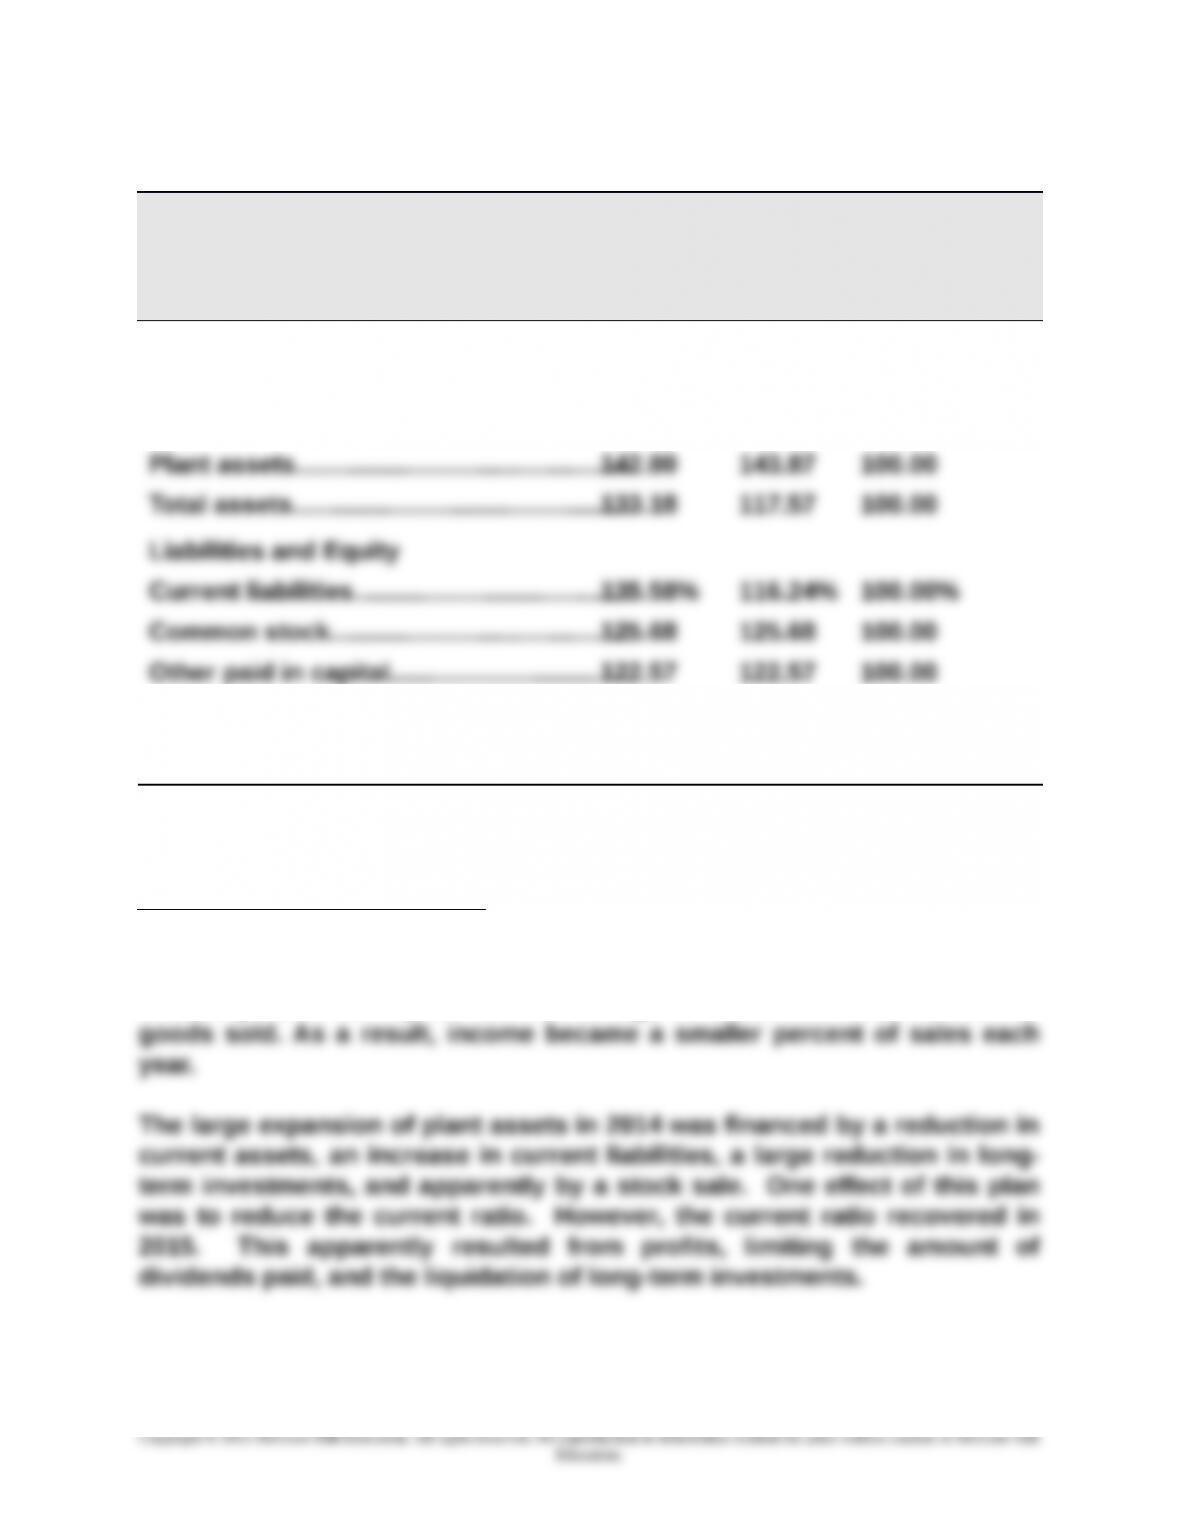
BLUEGRASS CORPORATION
Balance Sheet Data in Trend Percents
December 31, 2015, 2014, and 2013
2015 2014 2013
Assets
Current assets……………………………………..151.13% 89.97% 100.00%
Long-term investments………………………..0.00 16.04 100.00
Retained earnings………………………………..139.03 112.09 100.00
Total liabilities and equity….………….........133.18 117.57 100.00
Part 4
Significant relations revealed
Bluegrass’s cost of goods sold took a larger percent of sales each year.
Selling and administrative expenses and income taxes took a somewhat
smaller portion each year, but not enough to offset the effect of cost of
17-966
Chapter 17 – Analysis of Financial Statements
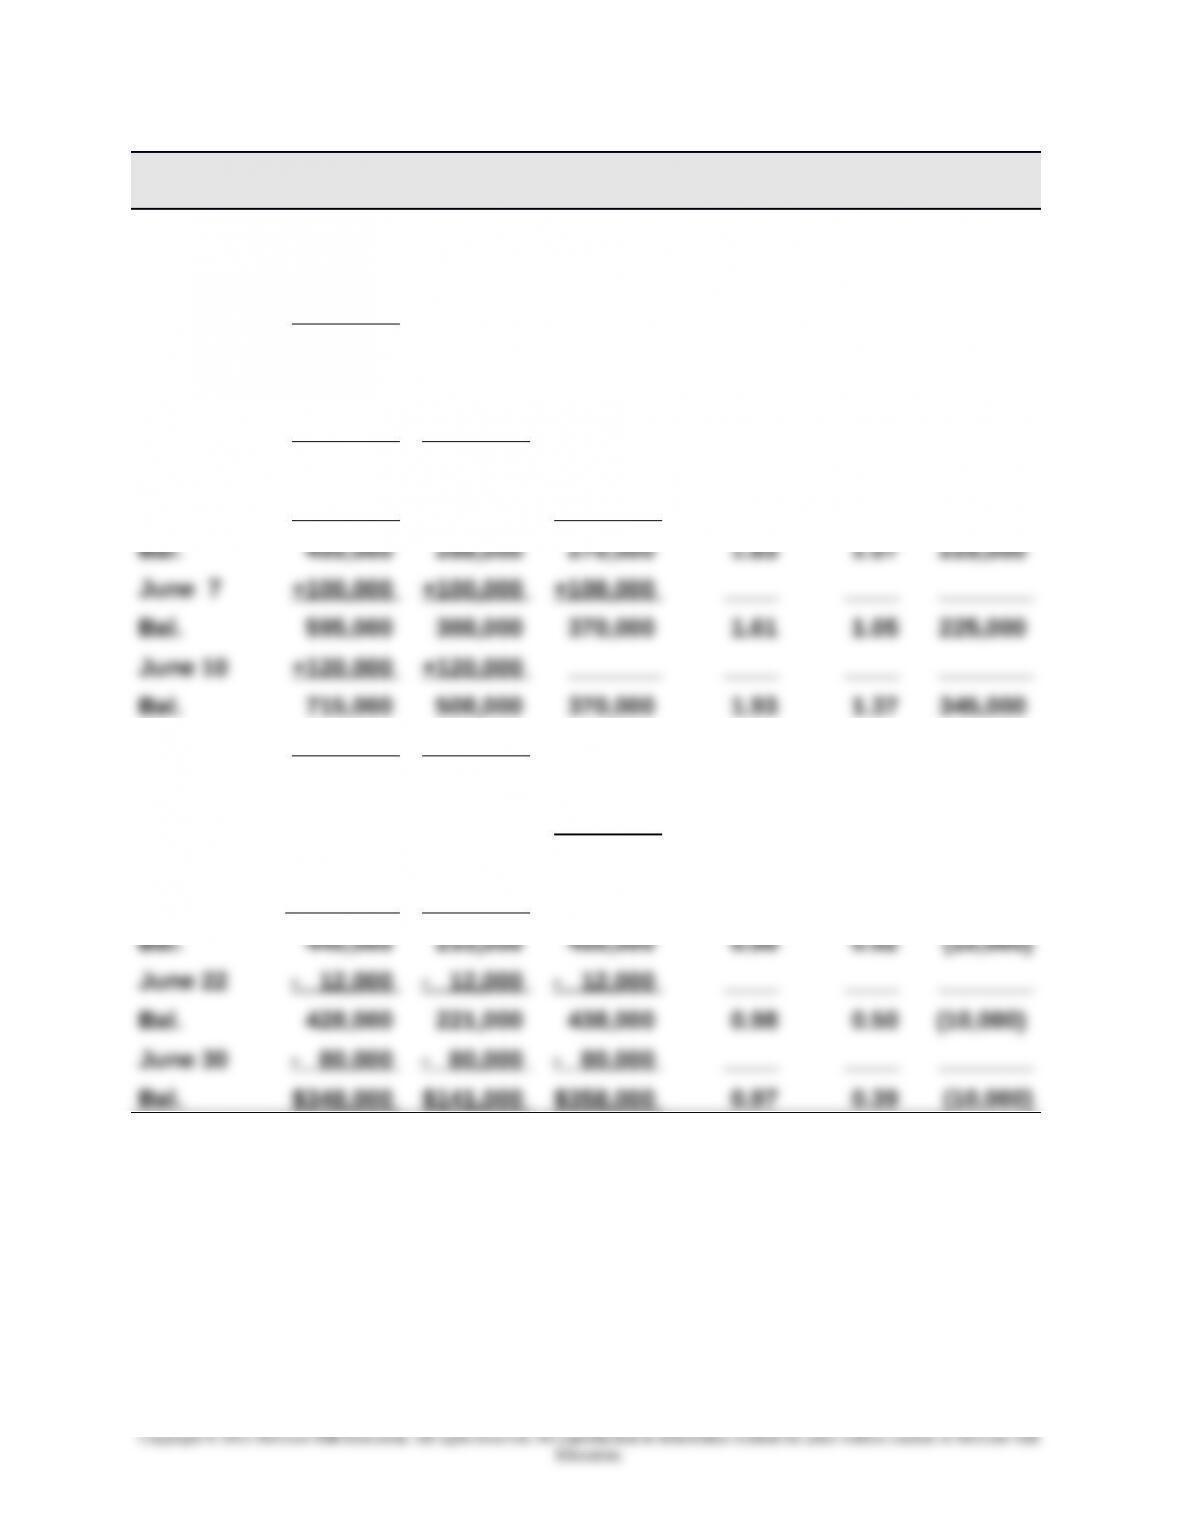
Problem 17-3B (60 minutes)
Trans-
action
Current
Assets
Quick
Assets
Current
Liabilities
Current
Ratio
Acid-Test
Ratio
Working
Capital
Beginning* $300,000 $168,000 $120,000 2.50 1.40 $180,000
June 1 +120,000 +120,000
– 75,000 _______ ________ ____ ____ _______
Bal. 345,000 288,000 120,000 2.88 2.40 225,000
June 3 + 88,000 + 88,000
– 88,000 – 88,000 ________ ____ ____ _______
Bal. 345,000 288,000 120,000 2.88 2.40 225,000
June 5 +150,000 ________ +150,000 ____ ____ _______
June 12 – 275,000 – 275,000 ________ ____ ____ _______
Bal. 440,000 233,000 370,000 1.19 0.63 70,000
June 15 ________ ________ + 80,000 ____ ____ _______
Bal. 440,000 233,000 450,000 0.98 0.52 (10,000)
June 19 +0 +0 ________ ____ ____ _______
*Beginning balances
Current assets (given)……………….……….................$300,000
Current liabilities ($300,000 / 2.50).........................120,000
Quick assets ($120,000 x 1.40)…………………………..168,000
17-967
Chapter 17 – Analysis of Financial Statements
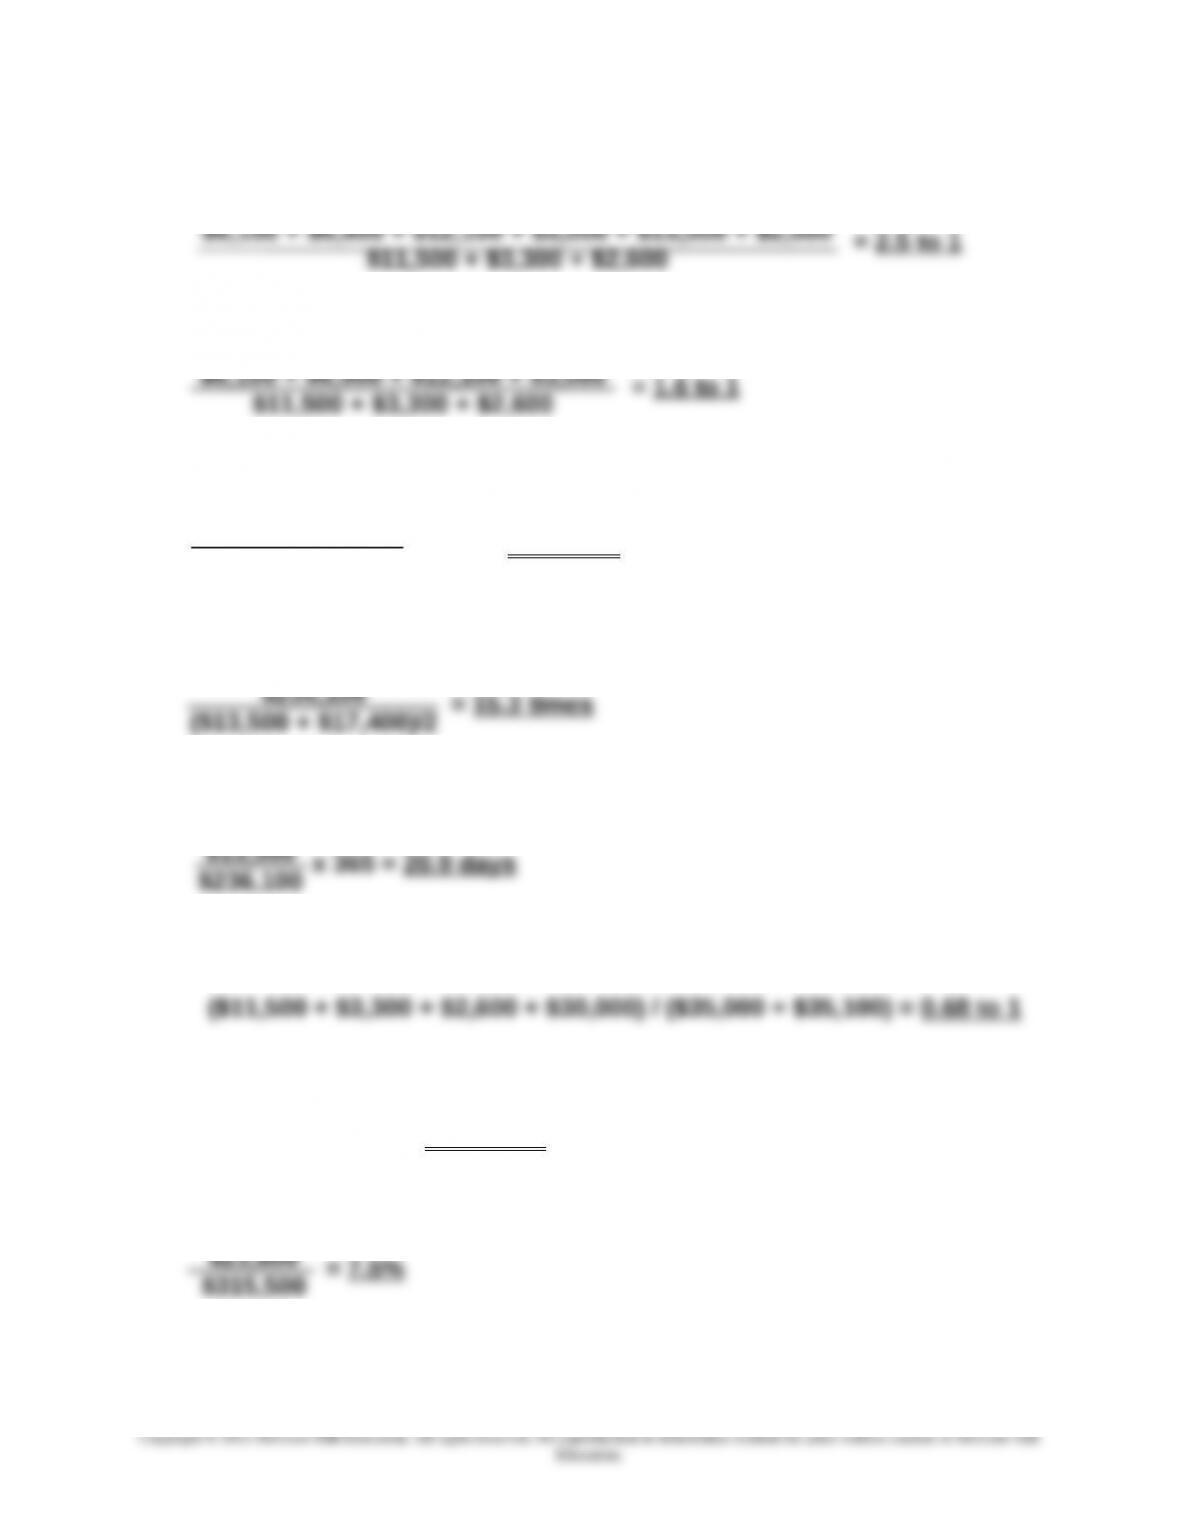
Problem 17-4B (50 minutes)
1. Current ratio
2. Acid-test ratio
3. Days’ sales uncollected
x 365 = 17.5 days
4. Inventory turnover
17-968
Copyright © 2015 McGraw-Hill Education. All rights reserved. No reproduction or distribution without the prior written consent of McGraw-Hill
Education.
$6,100 + $6,900 + $12,100 + $3,000 + $13,500 + $2,000
$11,500 + $3,300 + $2,600
$6,100 + $6,900 + $12,100 + $3,000
$11,500 + $3,300 + $2,600
$12,100 + $3,000
$315,500
Chapter 17 – Analysis of Financial Statements
Problem 17-4B (Concluded)
9. Total asset turnover
10. Return on total assets
11. Return on common stockholders’ equity
Problem 17-5B (60 minutes)
Part 1
Fargo Company Ball Company
a. Current ratio
= 2.3 to 1 = 2.1 to 1
b. Acid-test ratio
c. Accounts (and notes) receivable turnover
= 4.9 times = 8.7 times
d. Inventory turnover
17-969
Copyright © 2015 McGraw-Hill Education. All rights reserved. No reproduction or distribution without the prior written consent of McGraw-Hill
Education.
$315,500
($117,500 + $94,900)/2
$23,800
($117,500 + $94,900)/2
$23,800
($70,100 + $54,300)/2
$208,100
$97,000
$205,200
$90,500
$667,500
($70,500 + $9,000 + $73,300)/2
$393,600
($77,100 + $11,600 + $72,200)/2
Chapter 17 – Analysis of Financial Statements
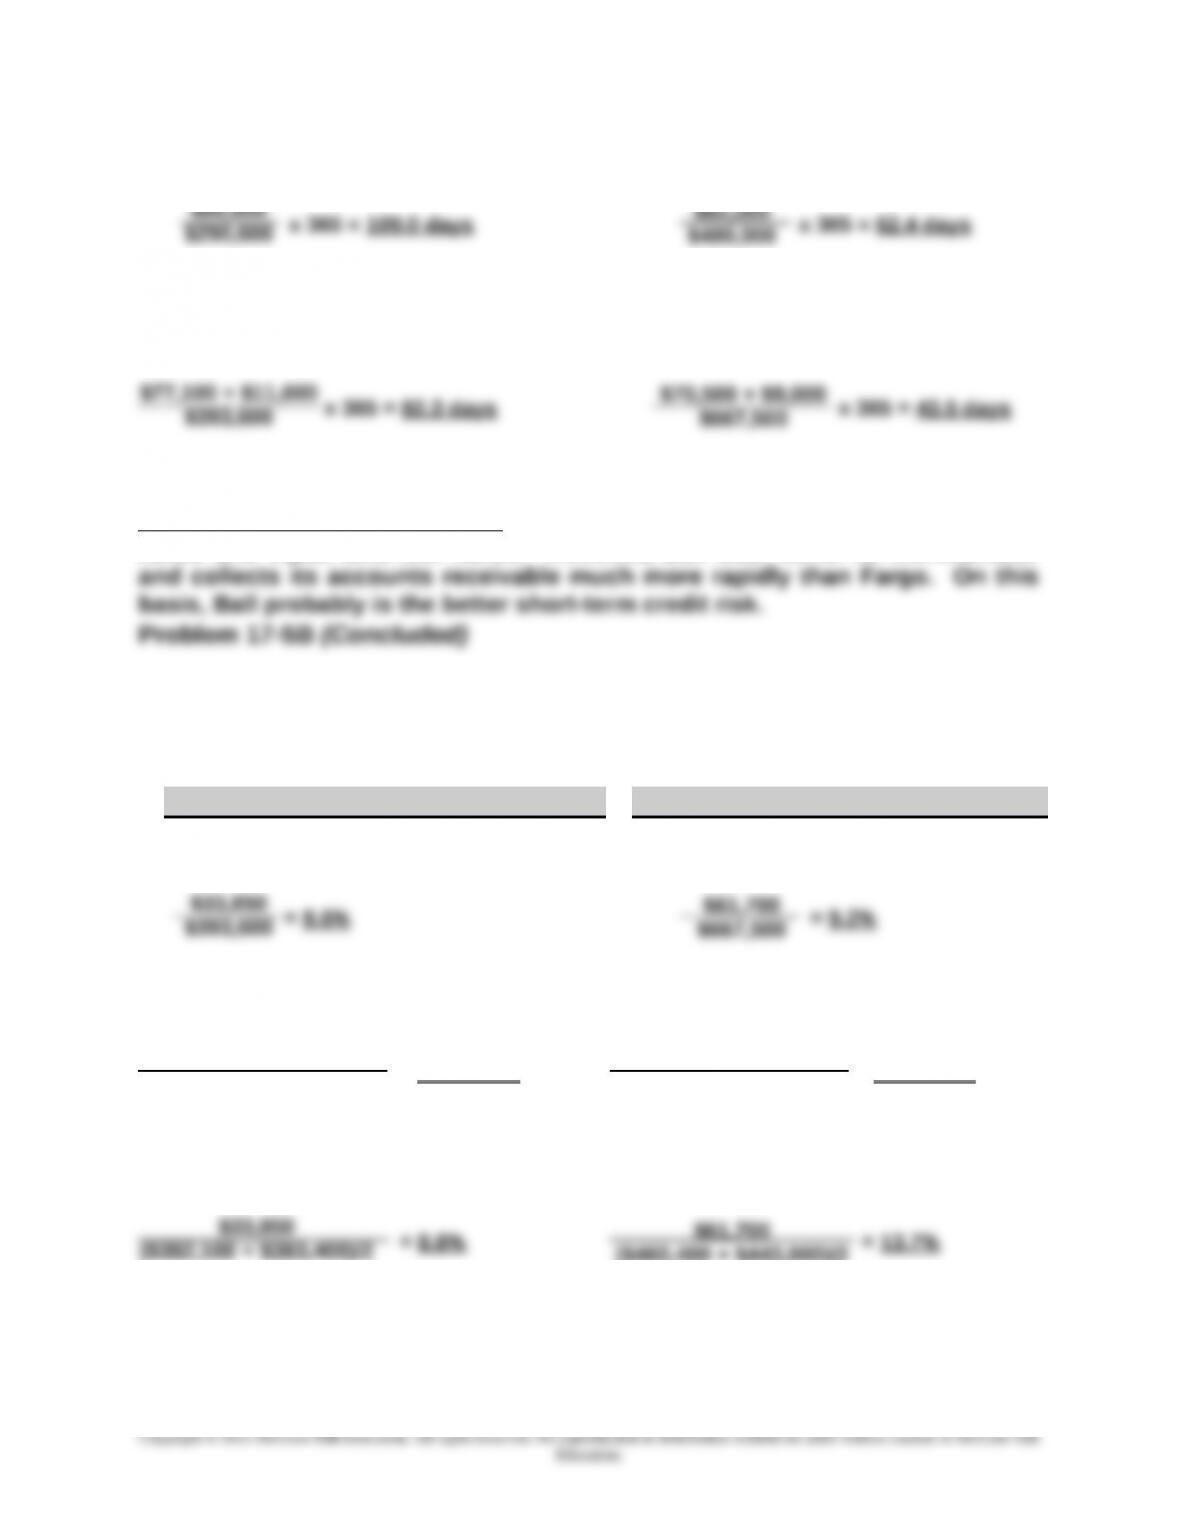
e. Days’ sales in inventory
f. Days’ sales uncollected
Short-term credit risk analysis: Fargo and Ball have nearly equal current
ratios and equal acid-test ratios. However, Ball both turns its merchandise
Part 2
Fargo Company Ball Company
a. Profit margin ratio
b. Total asset turnover
= 1.03 times = 1.48 times
c. Return on total assets
d. Return on common stockholders’ equity
17-970
Copyright © 2015 McGraw-Hill Education. All rights reserved. No reproduction or distribution without the prior written consent of McGraw-Hill
Education.
$82,000
$480,000
$86,800
$290,600
$70,500 + $9,000
$667,500
$77,100 + $11,600
$393,600
$61,700
$667,500
$33,850
$393,600
$667,500
($460,400 + $443,000)/2
$393,600
($382,100 + $383,400)/2
$61,700
($270,100 + $250,700)/2
$33,850
($198,600 + $182,100)/2
Chapter 17 – Analysis of Financial Statements
= 17.8% = 23.7%
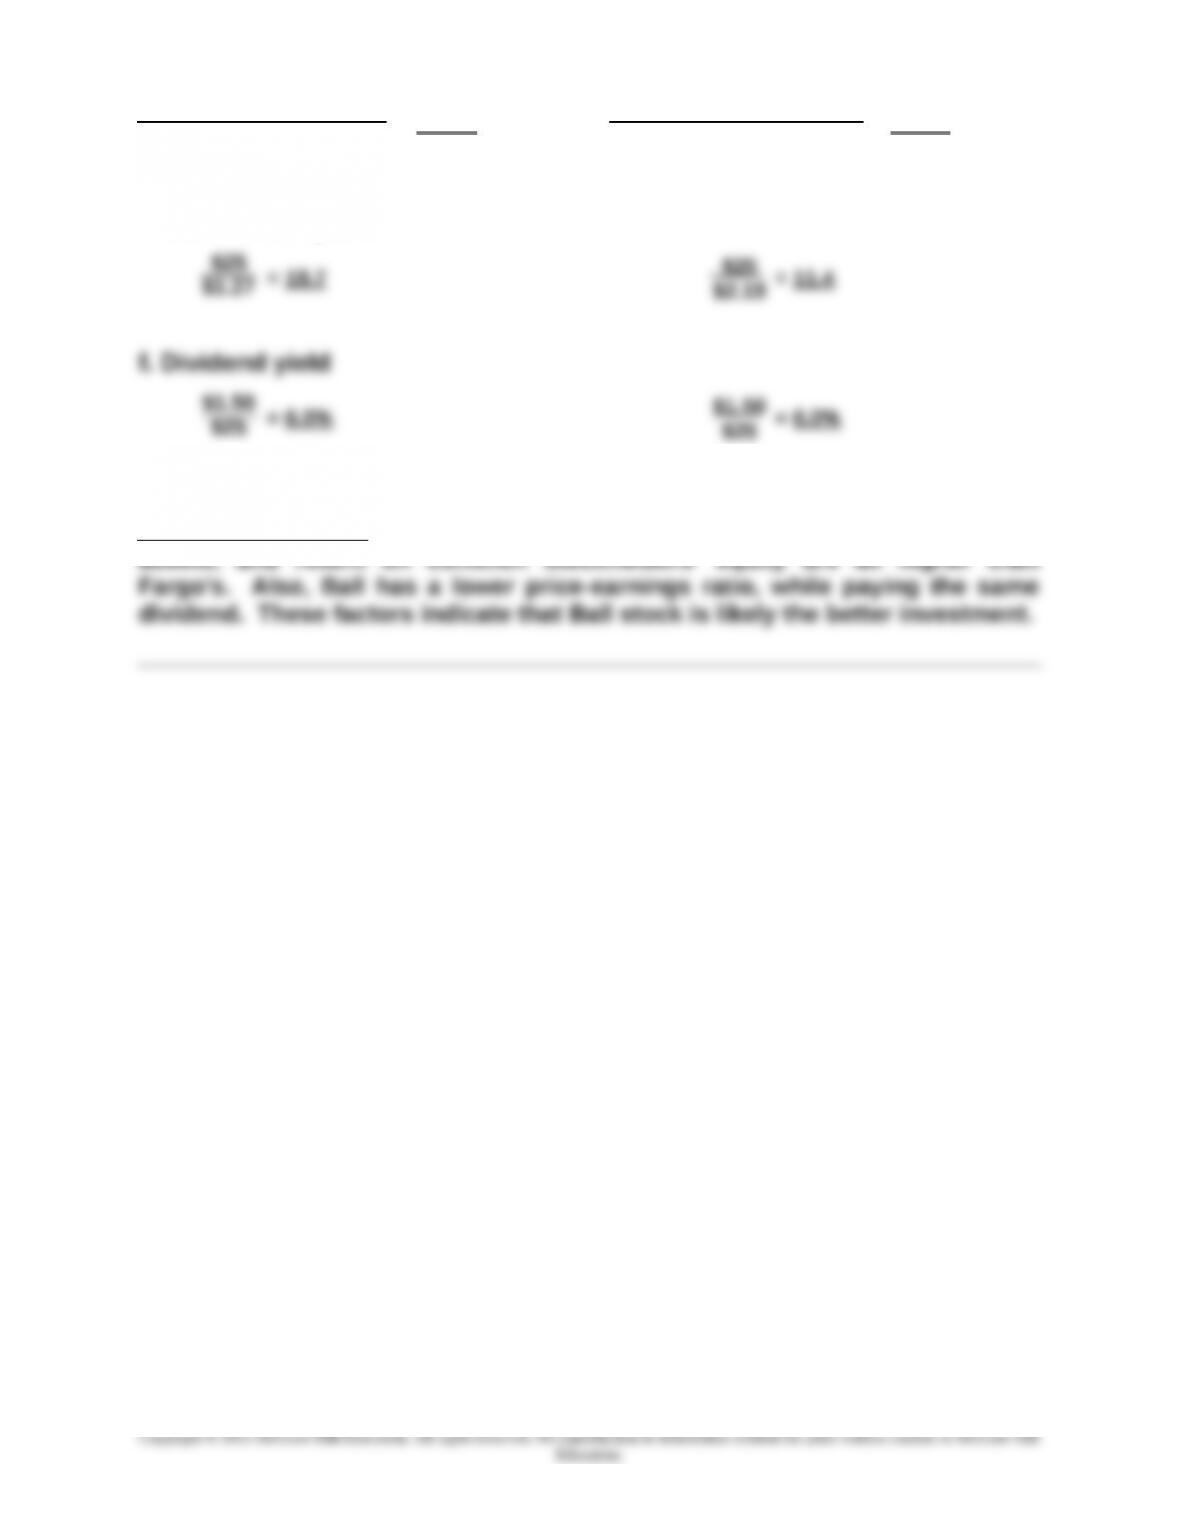
e. Price-earnings ratio
Investment analysis: Ball’s profit margin, total asset turnover, return on total
17-971
Copyright © 2015 McGraw-Hill Education. All rights reserved. No reproduction or distribution without the prior written consent of McGraw-Hill
Education.
$25
$25
$25
$25