Problem 17-2A (Concluded)
Part 3
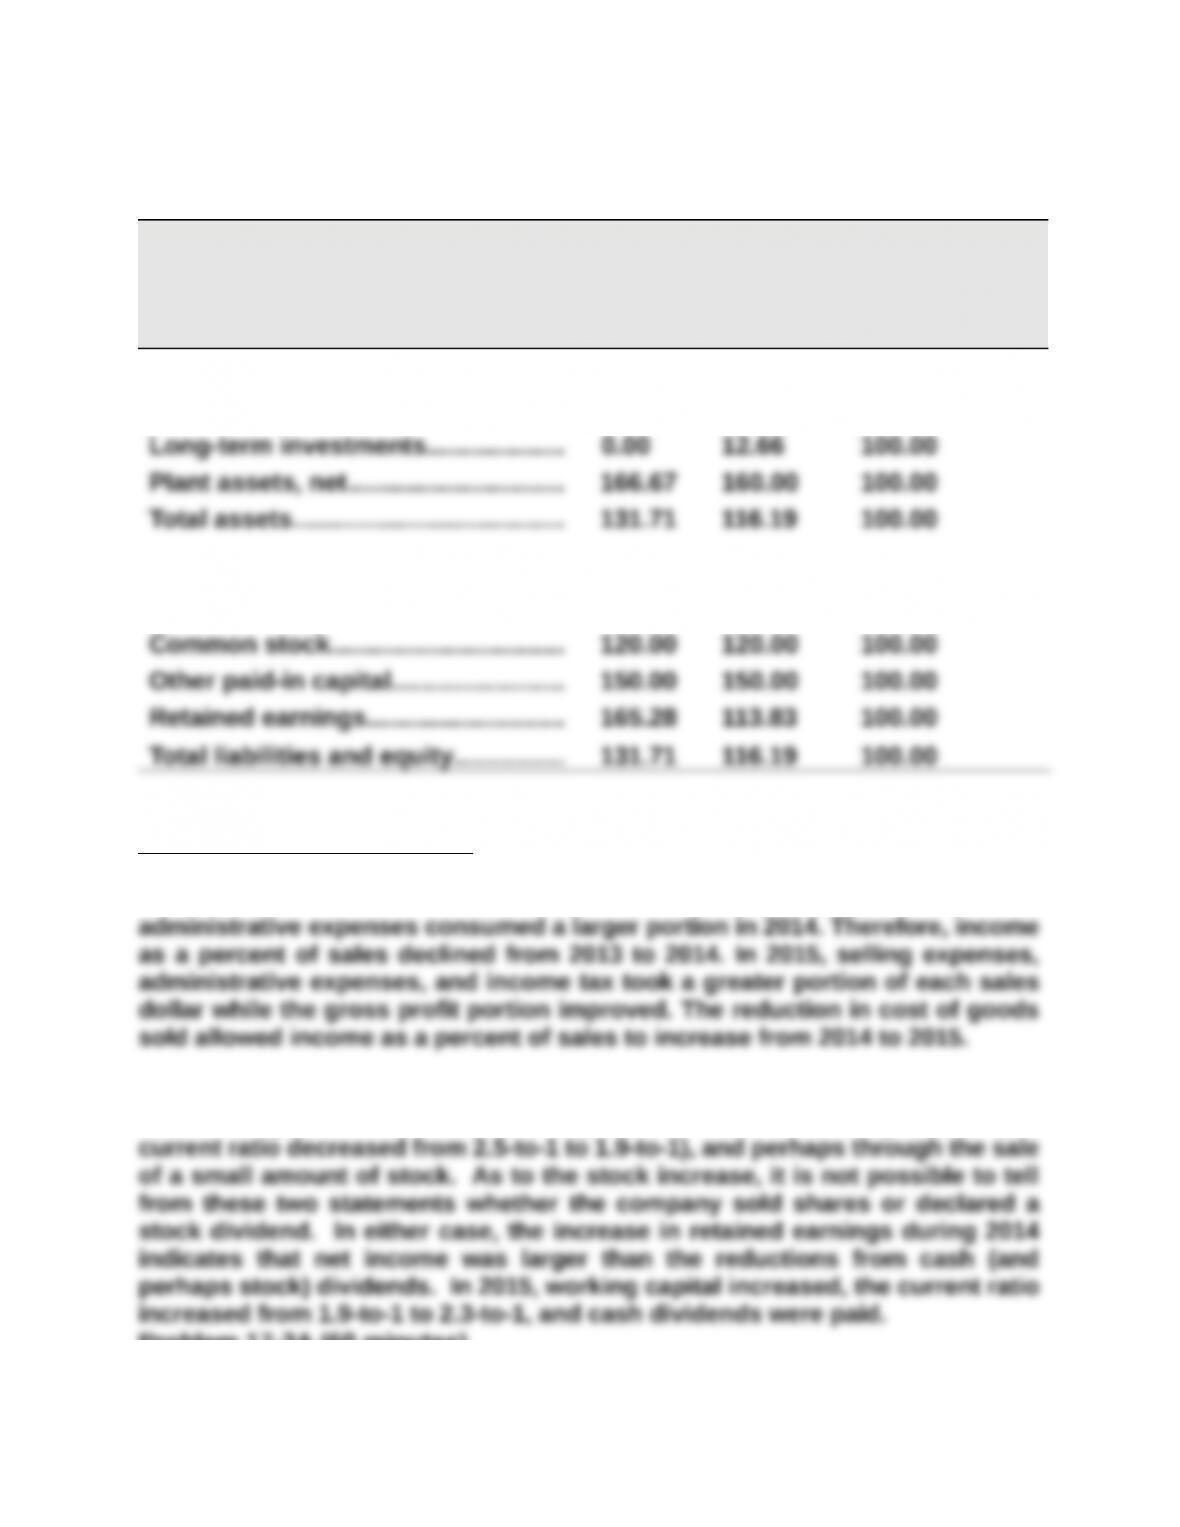
KORBIN COMPANY
Balance Sheet Data in Trend Percents
December 31, 2015, 2014, and 2013
2015 2014 2013
Assets
Current assets…………………………… 101.24% 73.29% 100.00%
Liabilities and Equity
Current liabilities……………………….. 112.32% 98.33% 100.00%
Part 4
Significant relations revealed
Korbin’s selling expenses and income taxes consumed smaller portions of
each sales dollar in 2014 than 2013. However, cost of goods sold and
Korbin expanded its plant assets in 2014, financing the expansion through the
sale of long-term investments, through a reduction in working capital (the
Problem 17-3A (60 minutes)
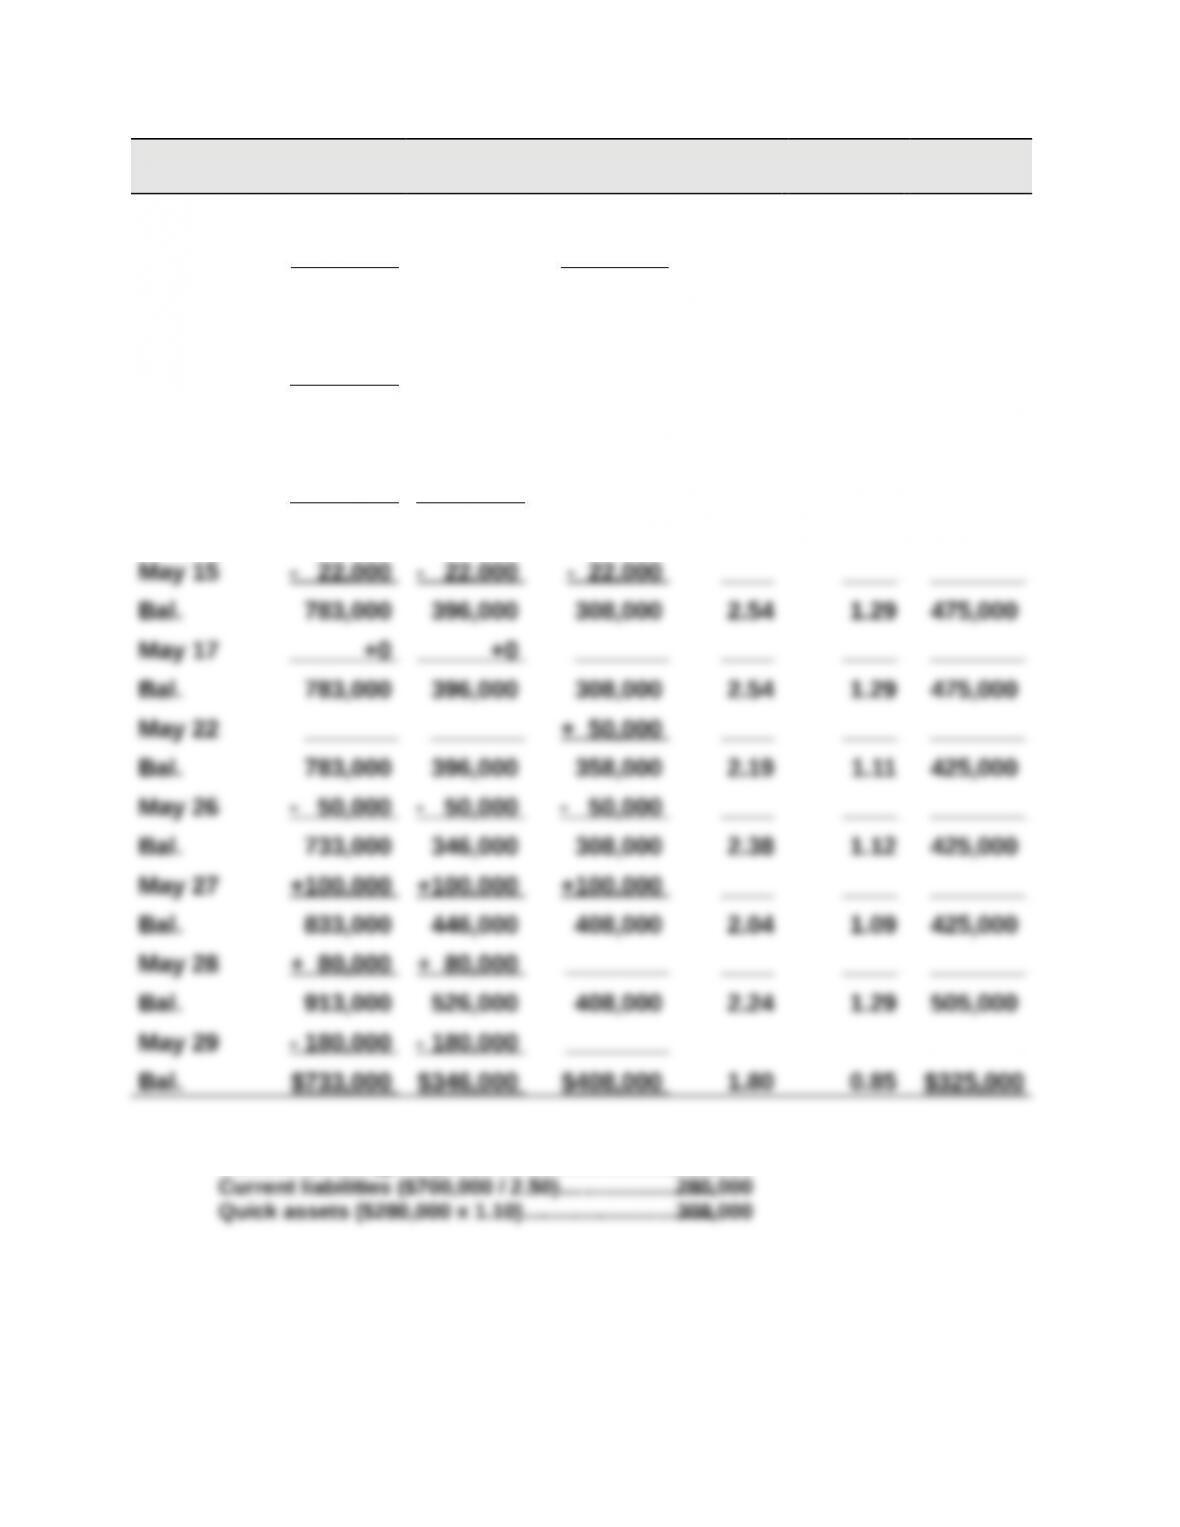
Transaction Current
Assets
Quick
Assets
Current
Liabilities
Current
Ratio
Acid-Test
Ratio
Working
Capital
Beginning* $700,000 $308,000 $280,000 2.50 1.10 $420,000
May 2 + 50,000 _______ + 50,000 ____ ____ _______
Bal. 750,000 308,000 330,000 2.27 0.93 420,000
May 8 +110,000 +110,000
– 55,000 _______ _______ ____ ____ _______
Bal. 805,000 418,000 330,000 2.44 1.27 475,000
May 10 + 20,000 + 20,000
– 20,000 – 20,000 _______ ____ ____ _______
Bal. 805,000 418,000 330,000 2.44 1.27 475,000
*Beginning balances
Current assets (given)……..…….…………………………..$700,000
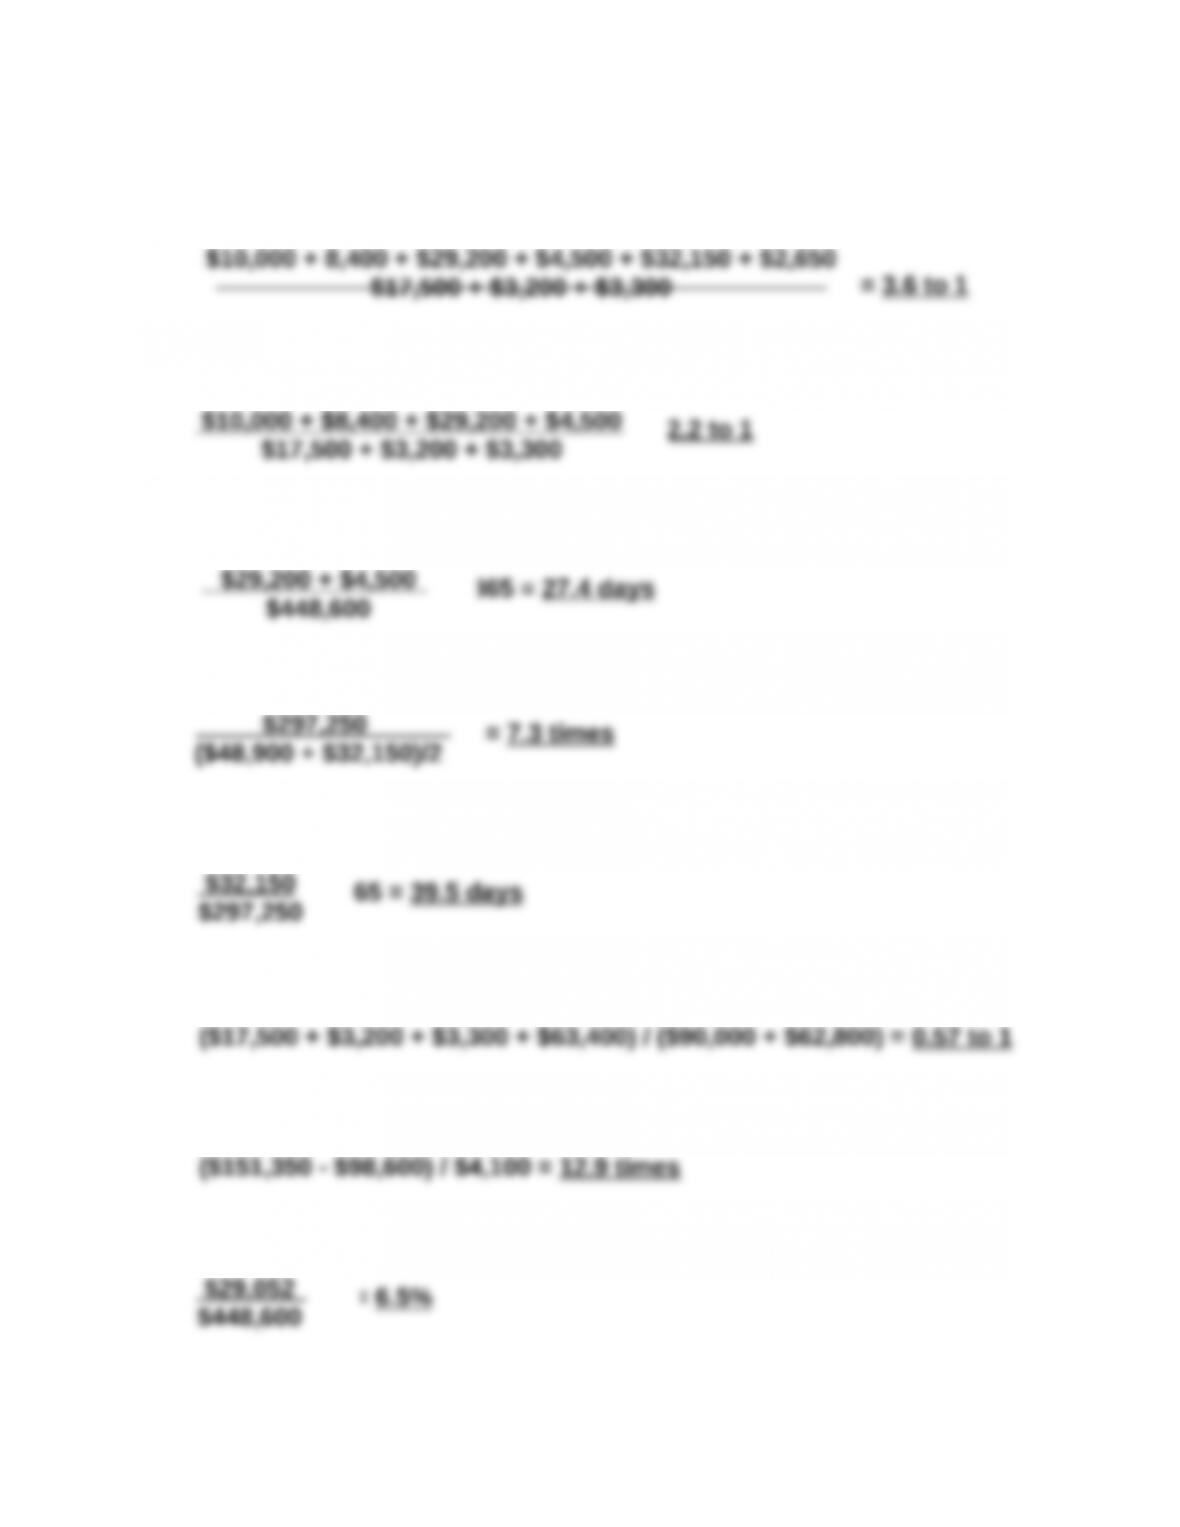
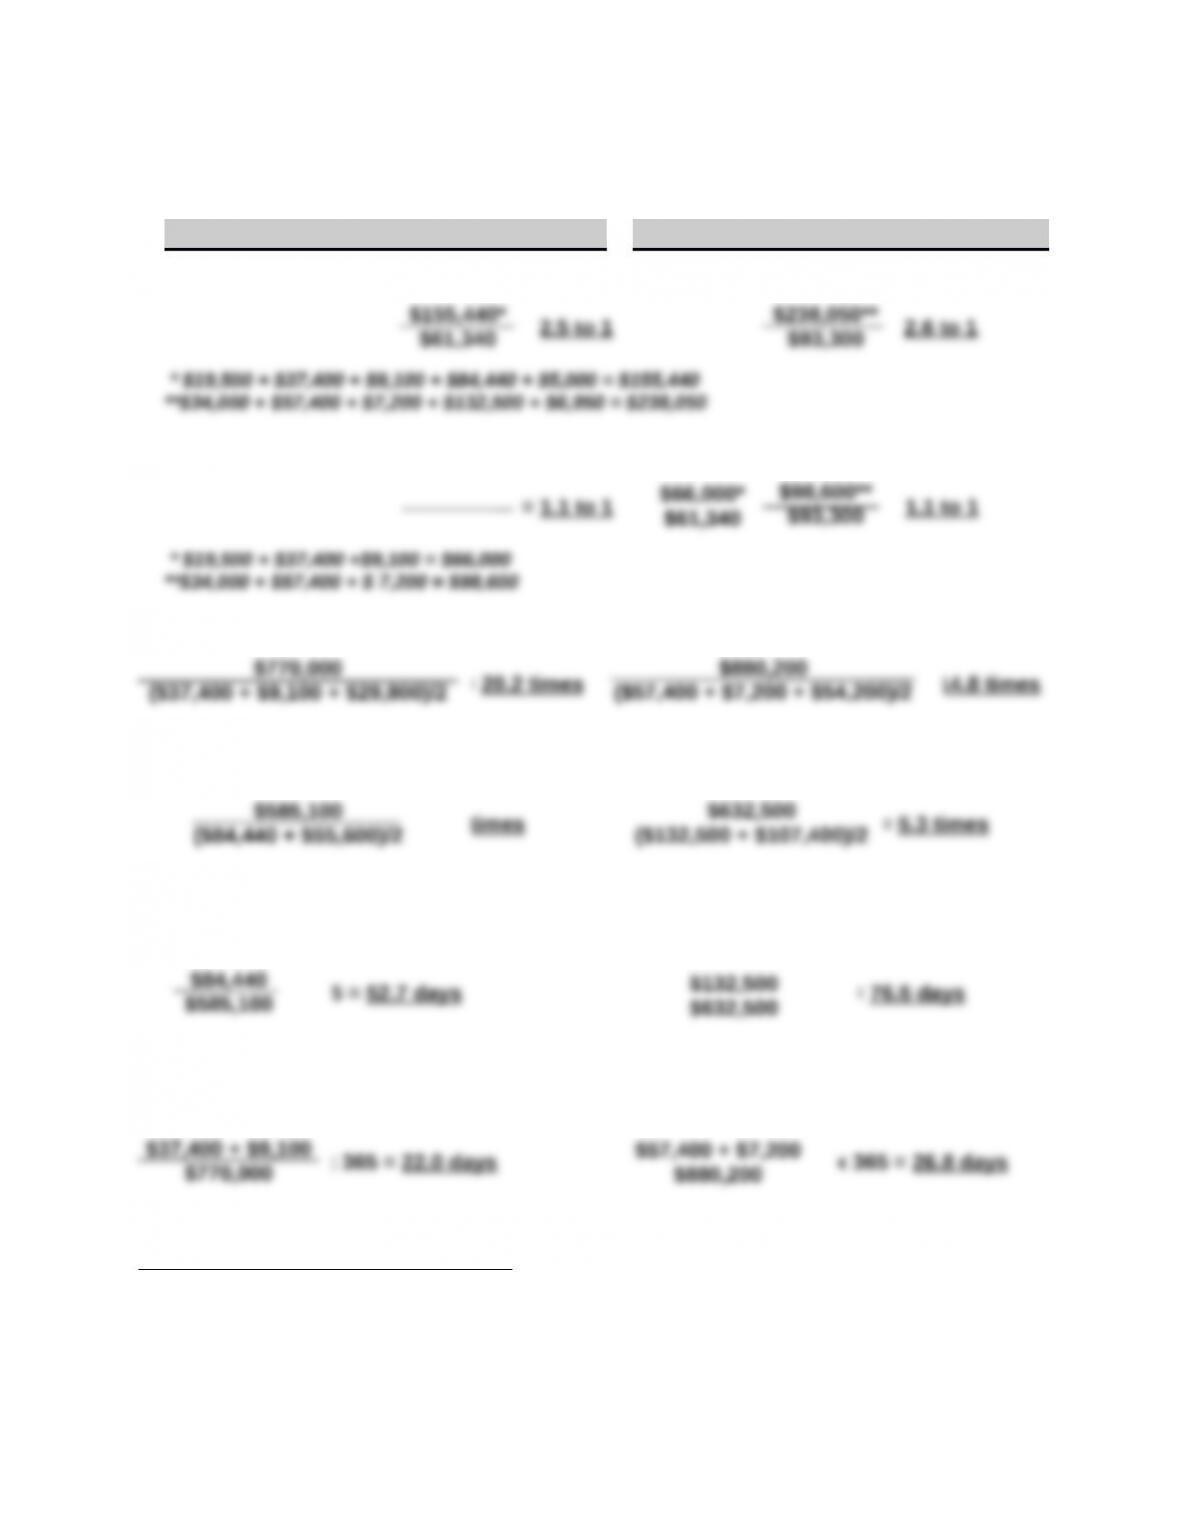
Problem 17-4A (50 minutes)
1. Current ratio
2. Acid-test ratio
3. Days’ sales uncollected
4. Inventory turnover
5. Days’ sales in inventory
6. Debt-to-equity ratio
7. Times interest earned
8. Profit margin ratio
$10,000 + 8,400 + $29,200 + $4,500 + $32,150 + $2,650
$10,000 + $8,400 + $29,200 + $4,500
$17,500 + $3,200 + $3,300
$29,200 + $4,500
$448,600
$297,250
($48,900 + $32,150)/2
$32,150
$297,250
$29,052
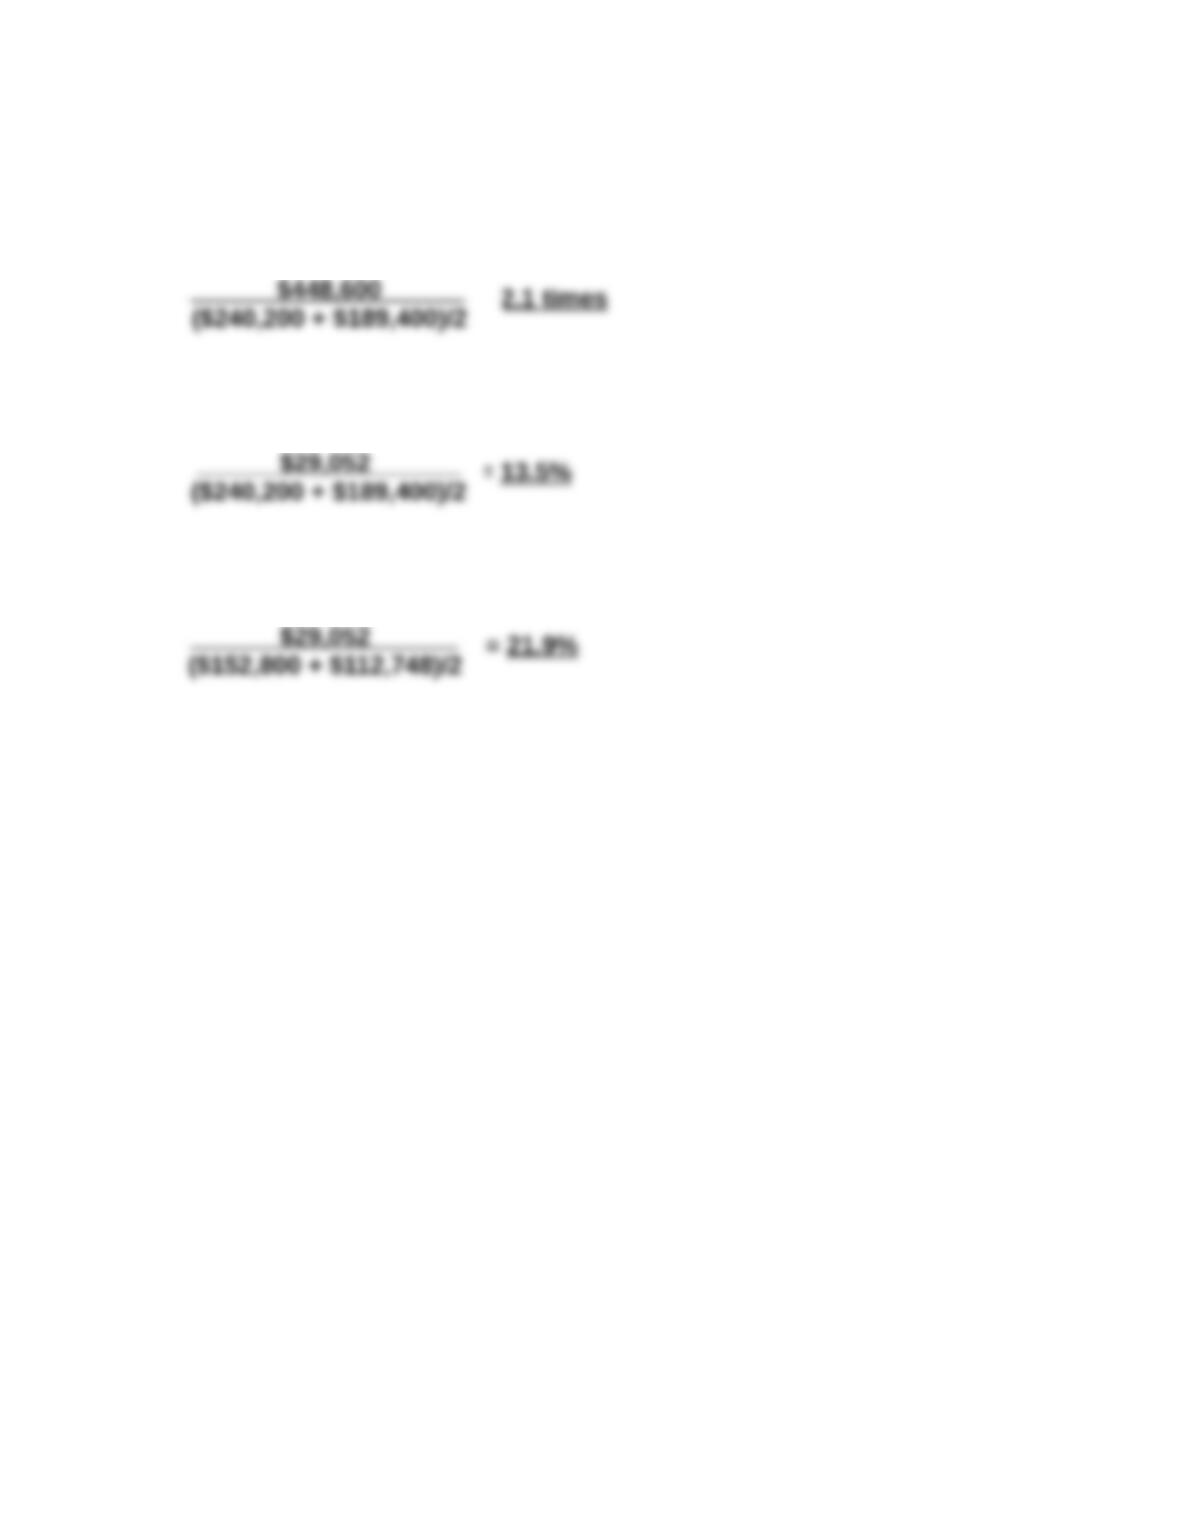
Problem 17-4A (Concluded)
9. Total asset turnover
10. Return on total assets
11. Return on common stockholders’ equity
$448,600
($240,200 + $189,400)/2
$29,052
($240,200 + $189,400)/2
$29,052
Problem 17-5A (60 minutes)
Part 1
Barco Company Kyan Company
a. Current ratio
b. Acid-test ratio
c. Accounts receivable turnover
Short-term credit risk analysis: Barco and Kyan have essentially equal
current ratios and equal acid-test ratios. However, Barco both turns its
merchandise and collects its accounts receivable more rapidly than does
Kyan. On this basis, Barco probably is the better short-term credit risk.
$155,440*
$66,000*
$238,050**
$98,600**
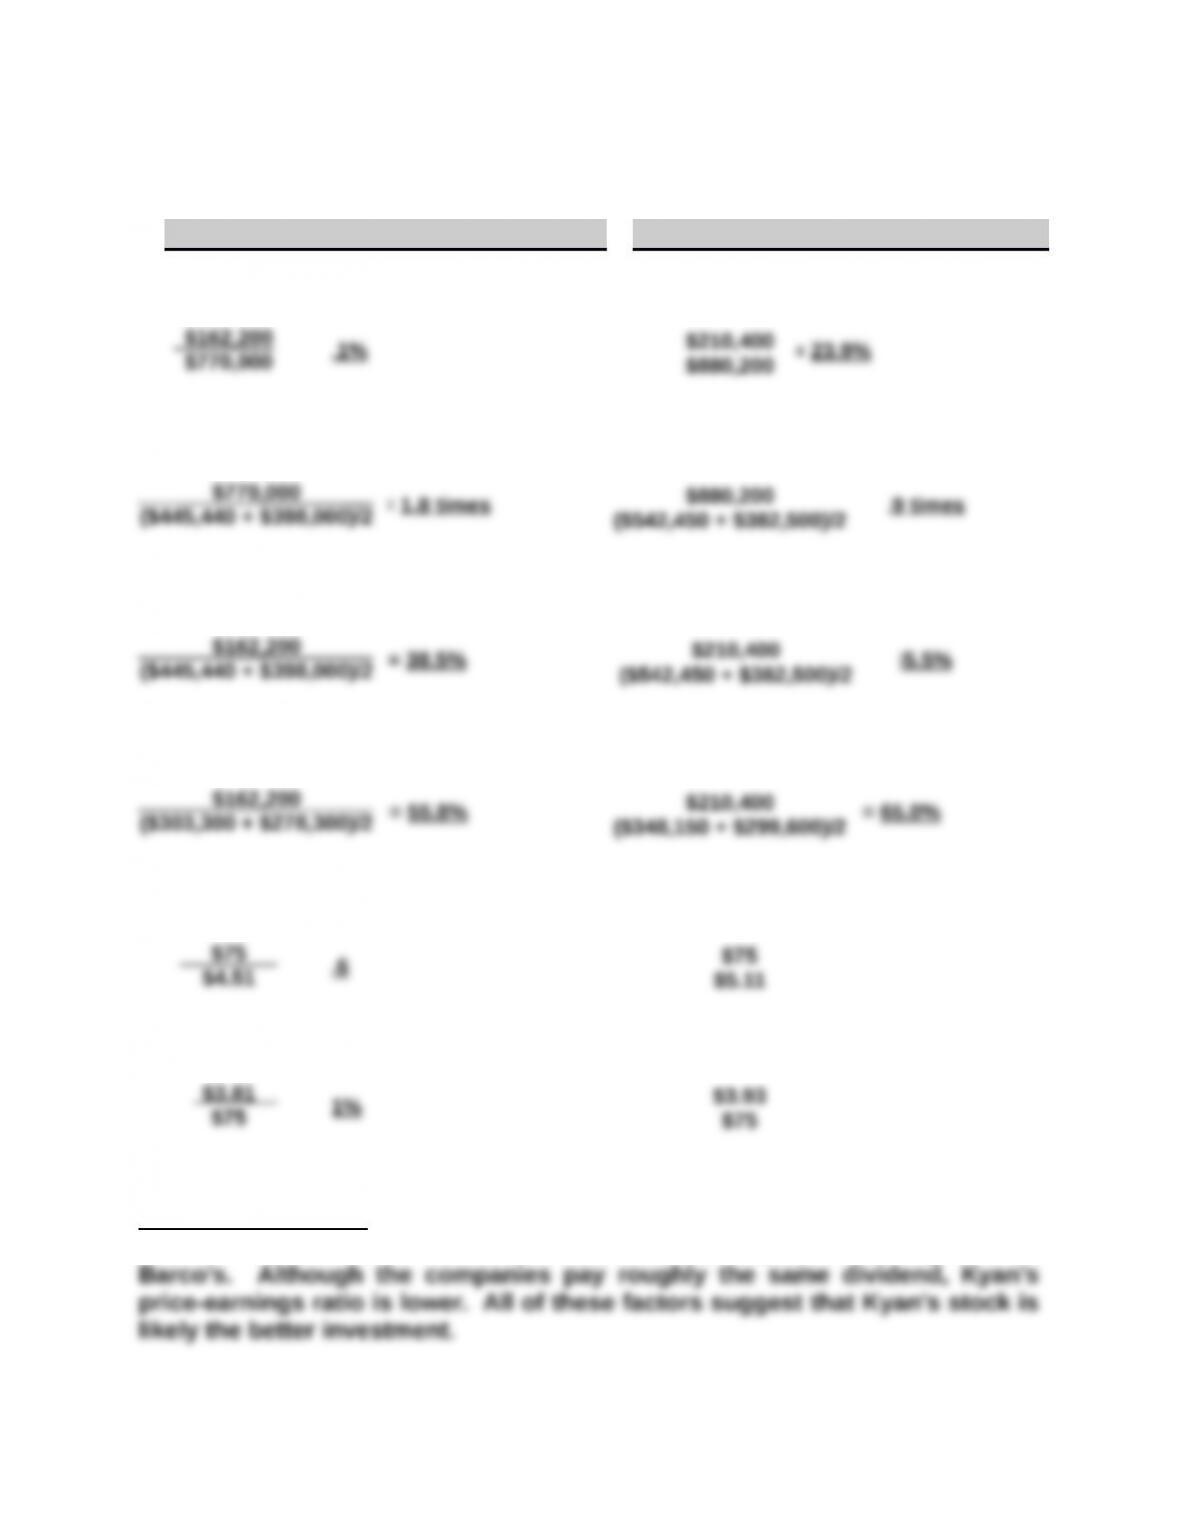
Problem 17-5A (Concluded)
Part 2
Barco Company Kyan Company
a. Profit margin ratio
b. Total asset turnover
c. Return on total assets
d. Return on common stockholders’ equity
e. Price-earnings ratio
f. Dividend yield
Investment analysis: Kyan’s profit margin ratio, total asset turnover, return on
total assets, and return on common stockholders’ equity are all higher than
Barco’s. Although the companies pay roughly the same dividend, Kyan’s
price-earnings ratio is lower. All of these factors suggest that Kyan’s stock is
likely the better investment.
$162,200
$770,000
$770,000
($445,440 + $398,000)/2
$162,200
($445,440 + $398,000)/2
$162,200
($303,300 + $278,300)/2
$75
$4.51
$3.81
$75
$210,400
$880,200
$880,200
($542,450 + $382,500)/2
$210,400
($542,450 + $382,500)/2
$210,400
($348,150 + $299,600)/2
$75
$5.11
$3.93
$75
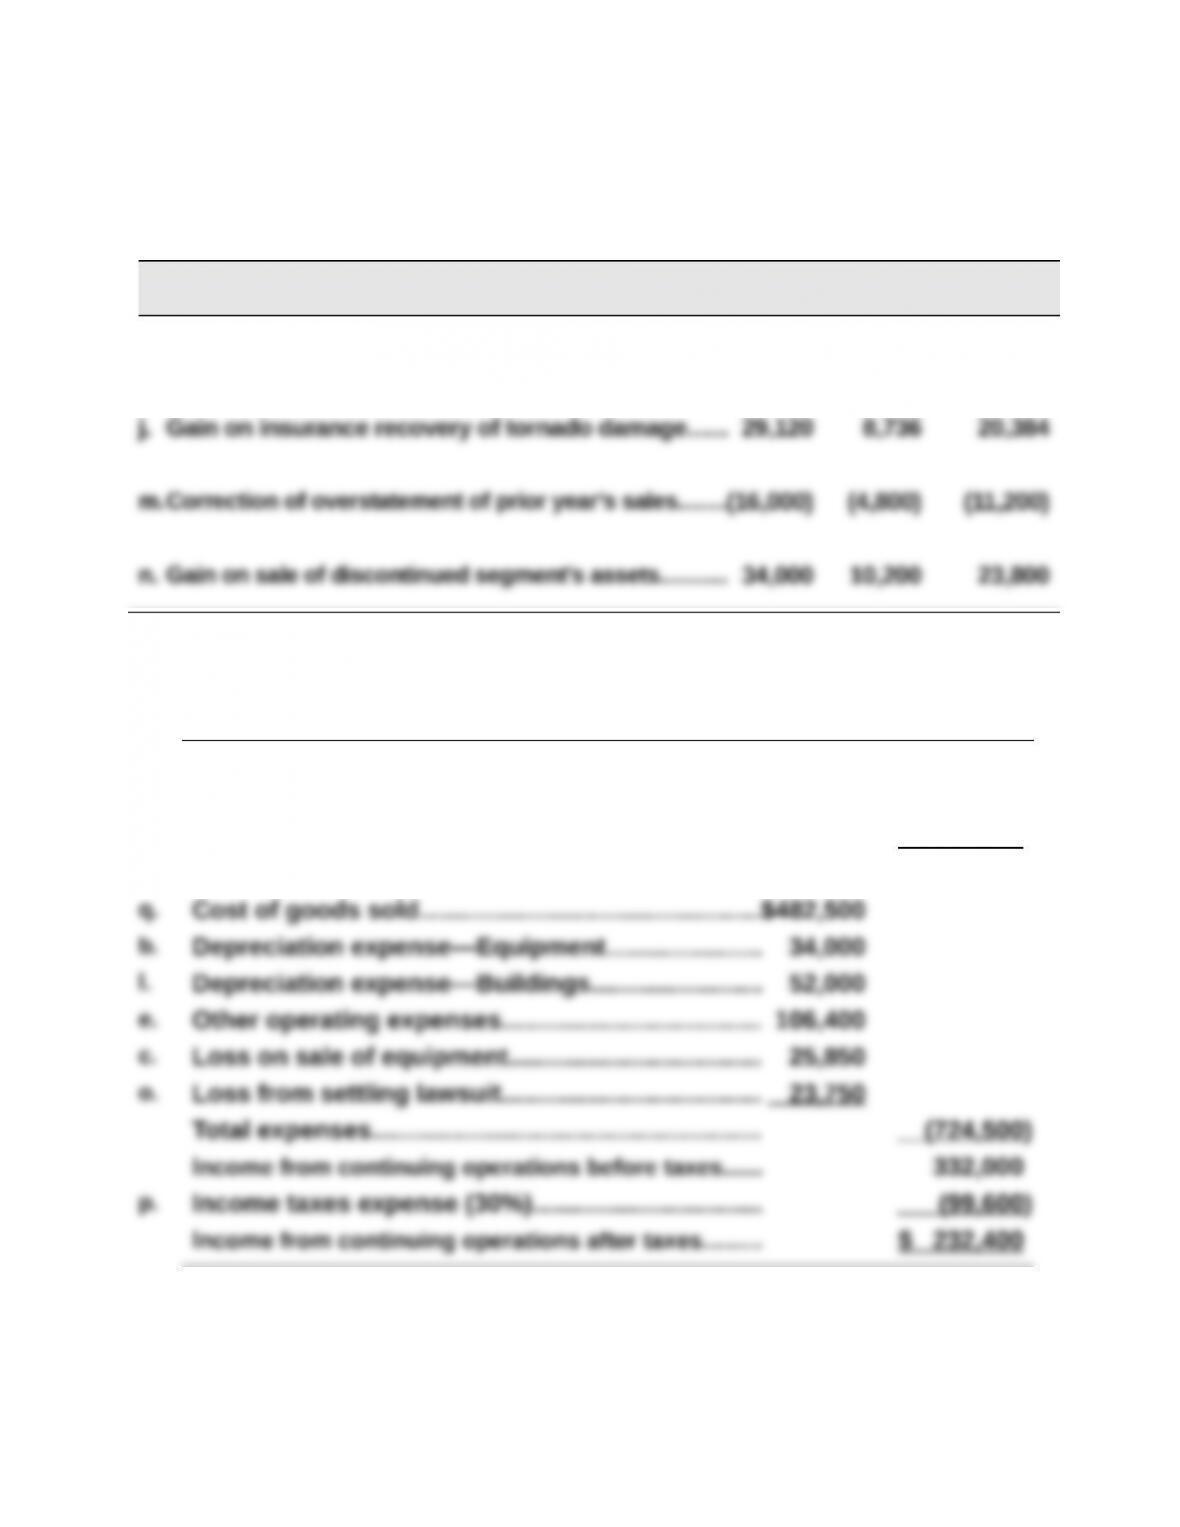
Problem 17-6AA (60 minutes)
Part 1
Effect of income taxes (debits or losses in parentheses)
Pretax
30% Tax
Effect After-Tax
i. Loss from operating a discontinued segment………….(18,250) (5,475) (12,775)
Part 2 Income from continuing operations (and its components)
k. Net sales………………………………………………………. $ 998,500
a. Interest revenue……………………………………………. 14,000
g. Gain from settling lawsuit………………………………. 44,000
Total revenues and gains……………………………….. 1,056,500
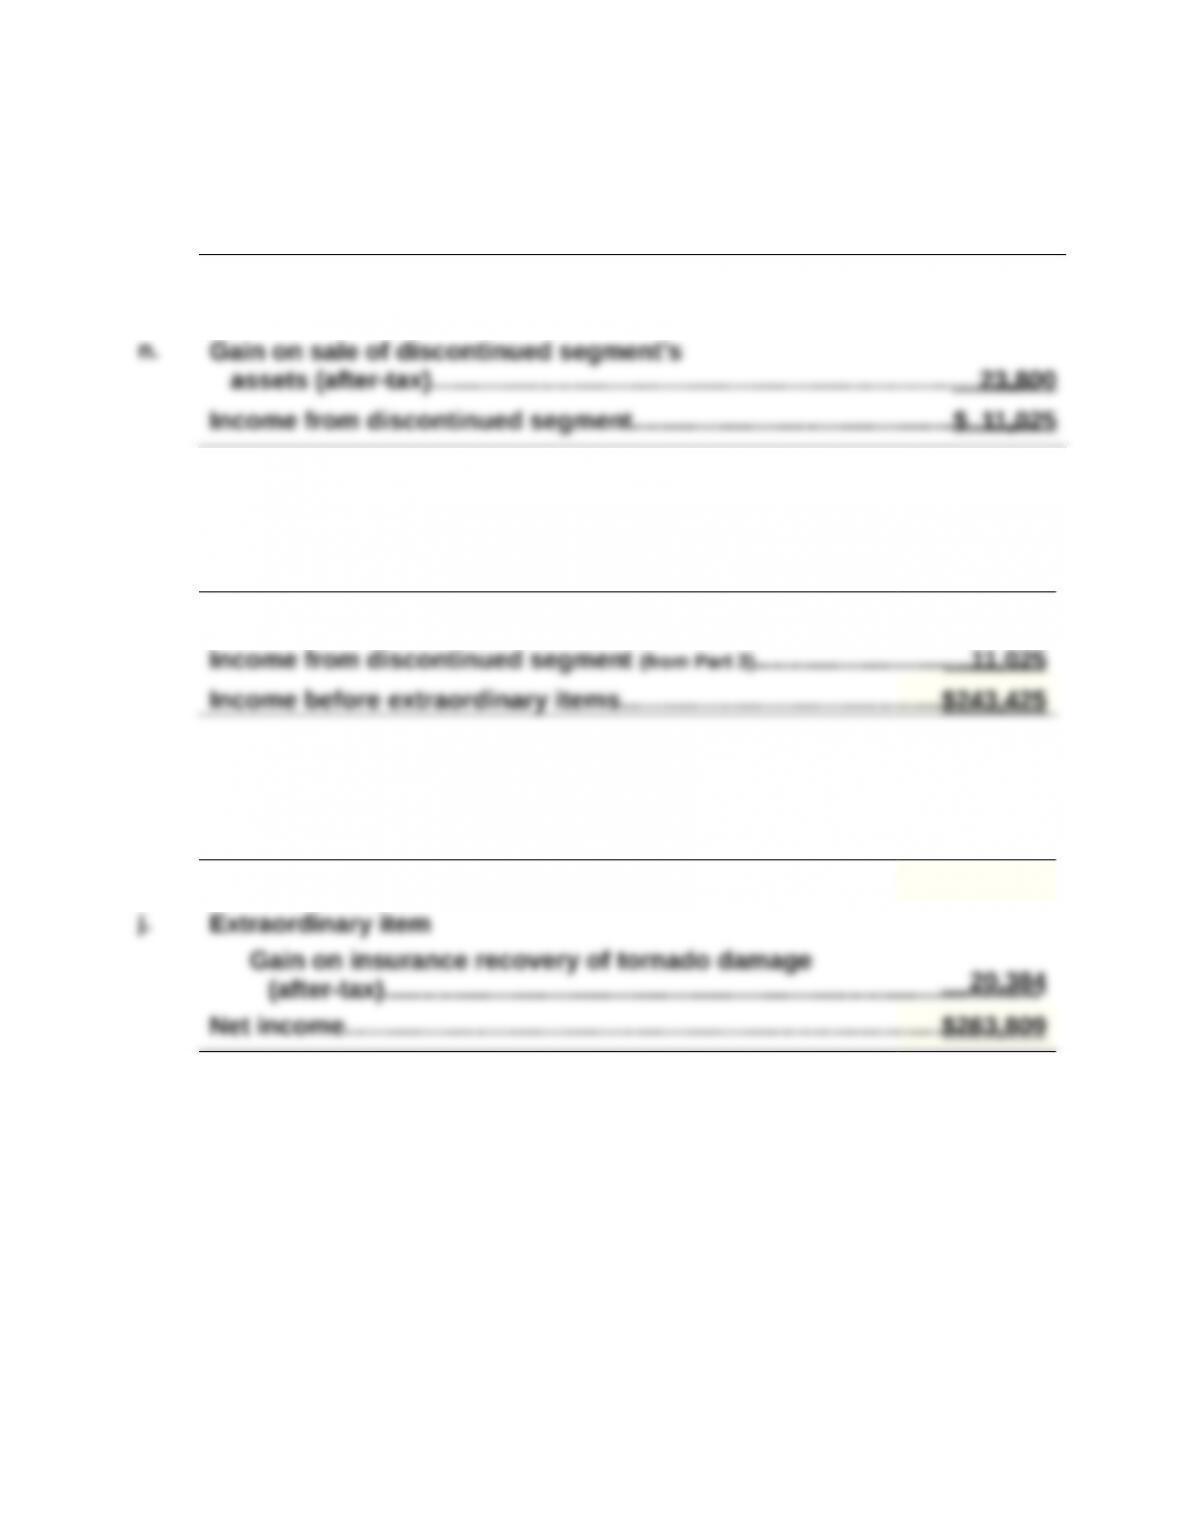
Problem 17-6AA (Concluded)
Part 3 Income from discontinued segment
i. Loss from operating a discontinued
segment (after-tax)……………………………………………………………………….$ (12,775)
Part 4 Income before extraordinary items
Income from continuing oper. after taxes (from Part 2)………………………….$232,400
Part 5 Net income
Income before extraordinary items…………………………………………………..$243,425
PROBLEM SET B
Problem 17-1B (120 minutes)
Part 1
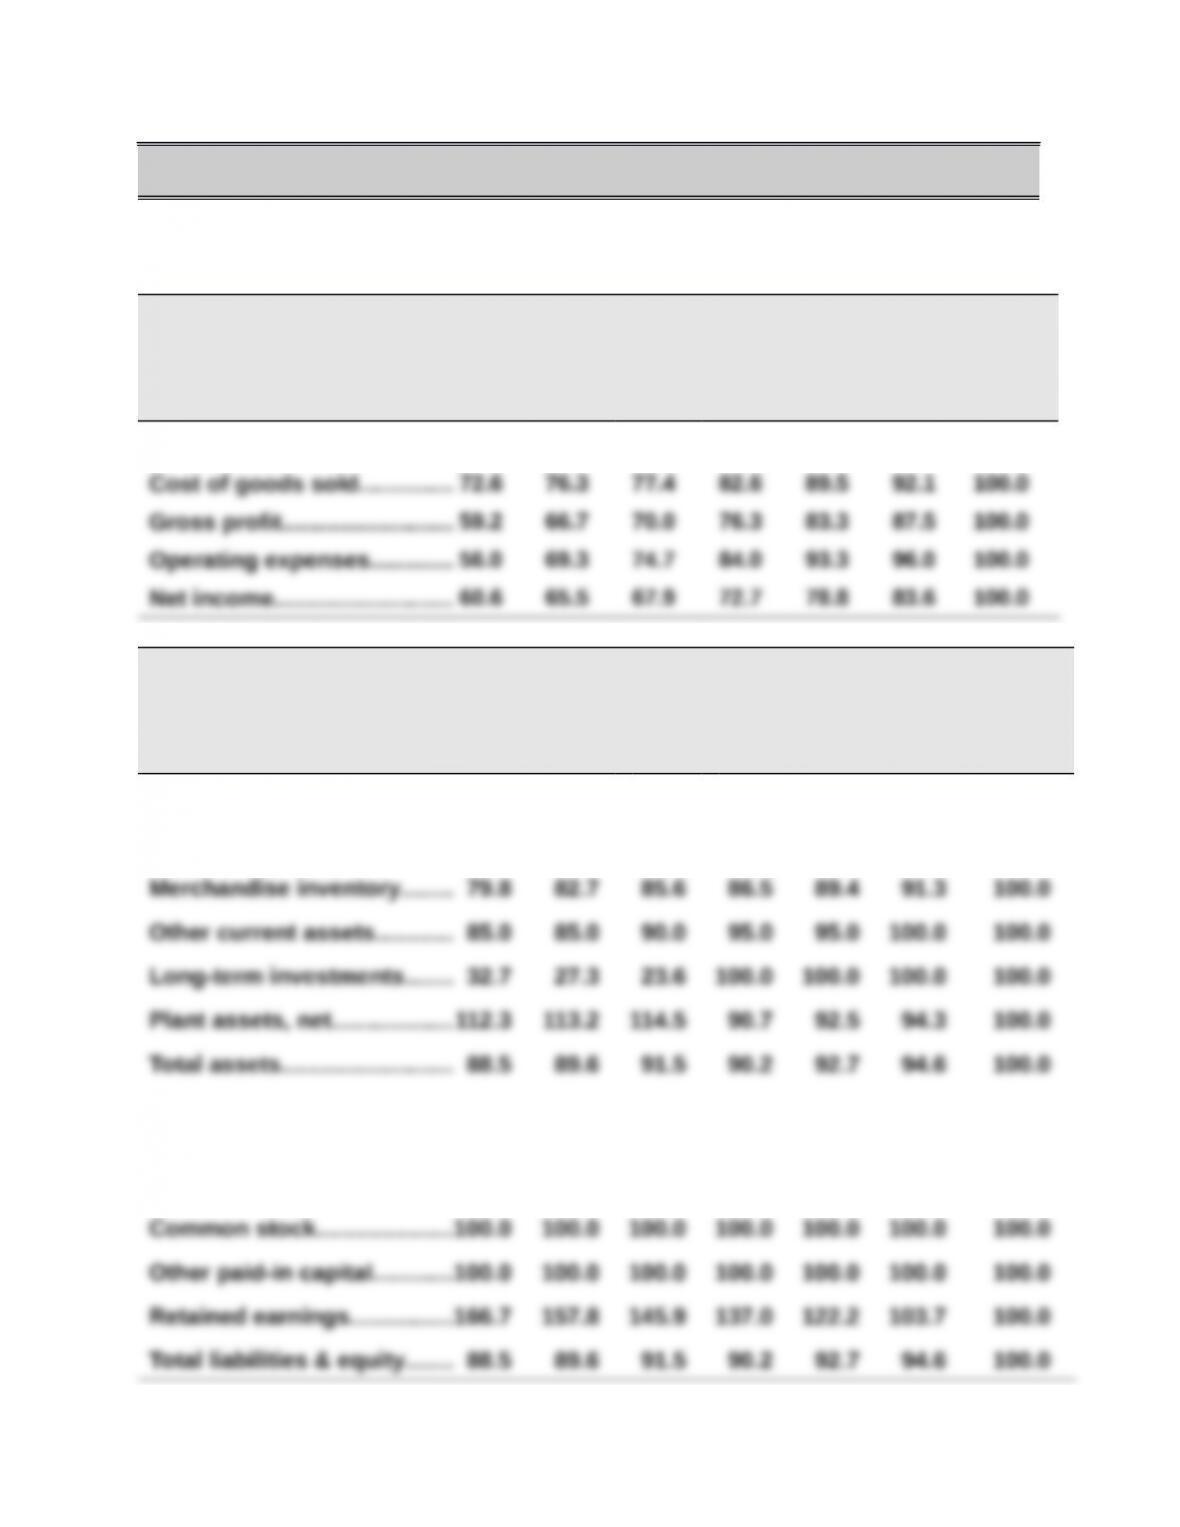
TRIPOLY COMPANY
Income Statement Trends
For Years Ended December 31, 2015-2009
2015 2014 2013 2012 2011 2010 2009
Sales………………………………. 65.1% 70.9% 73.3% 79.1% 86.0% 89.5% 100.0%
TRIPOLY COMPANY
Balance Sheet Trends
December 31, 2015-2009
2015 2014 2013 2012 2011 2010 2009
Cash……………………………… 64.7% 67.6% 76.5% 79.4% 88.2% 91.2% 100.0%
Accounts recble., net………. 81.3 85.0 87.5 90.0 93.8 96.3 100.0
Current liabilities…………….. 52.9 55.7 66.4 67.9 75.0 92.9 100.0
Long-term liabilities…………. 35.4 46.2 54.6 56.9 74.6 82.3 100.0
Problem 17-1B (Concluded)
Part 2
Analysis and Interpretation
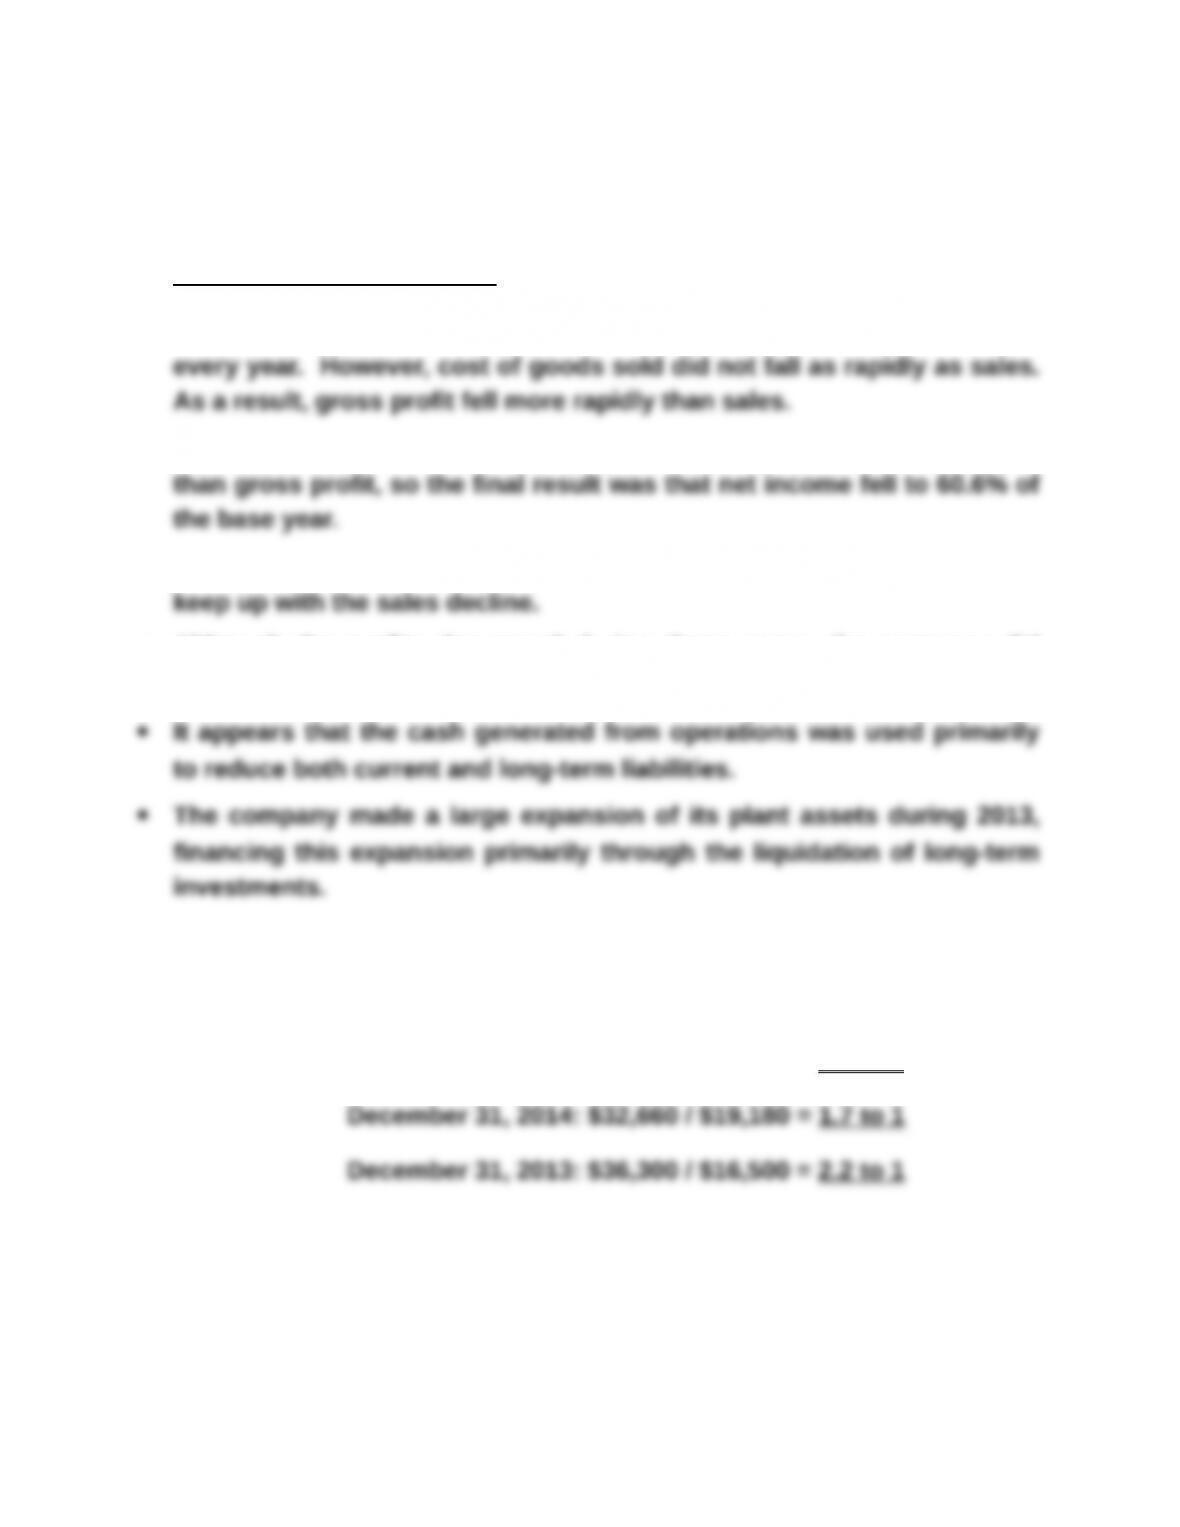
The statements and the trend percent data show that sales declined
Except for the most recent period, operating expenses fell less rapidly
Management was not able to reduce costs and expenses fast enough to
Although the profits decreased during these years, the company did
continue to earn a net income.
Problem 17-2B (60 minutes)
Part 1
Current ratio: December 31, 2015: $54,860 / $22,370 = 2.5 to 1