Chapter 17 – Analysis of Financial Statements
Exercise 17-7 (25 minutes)
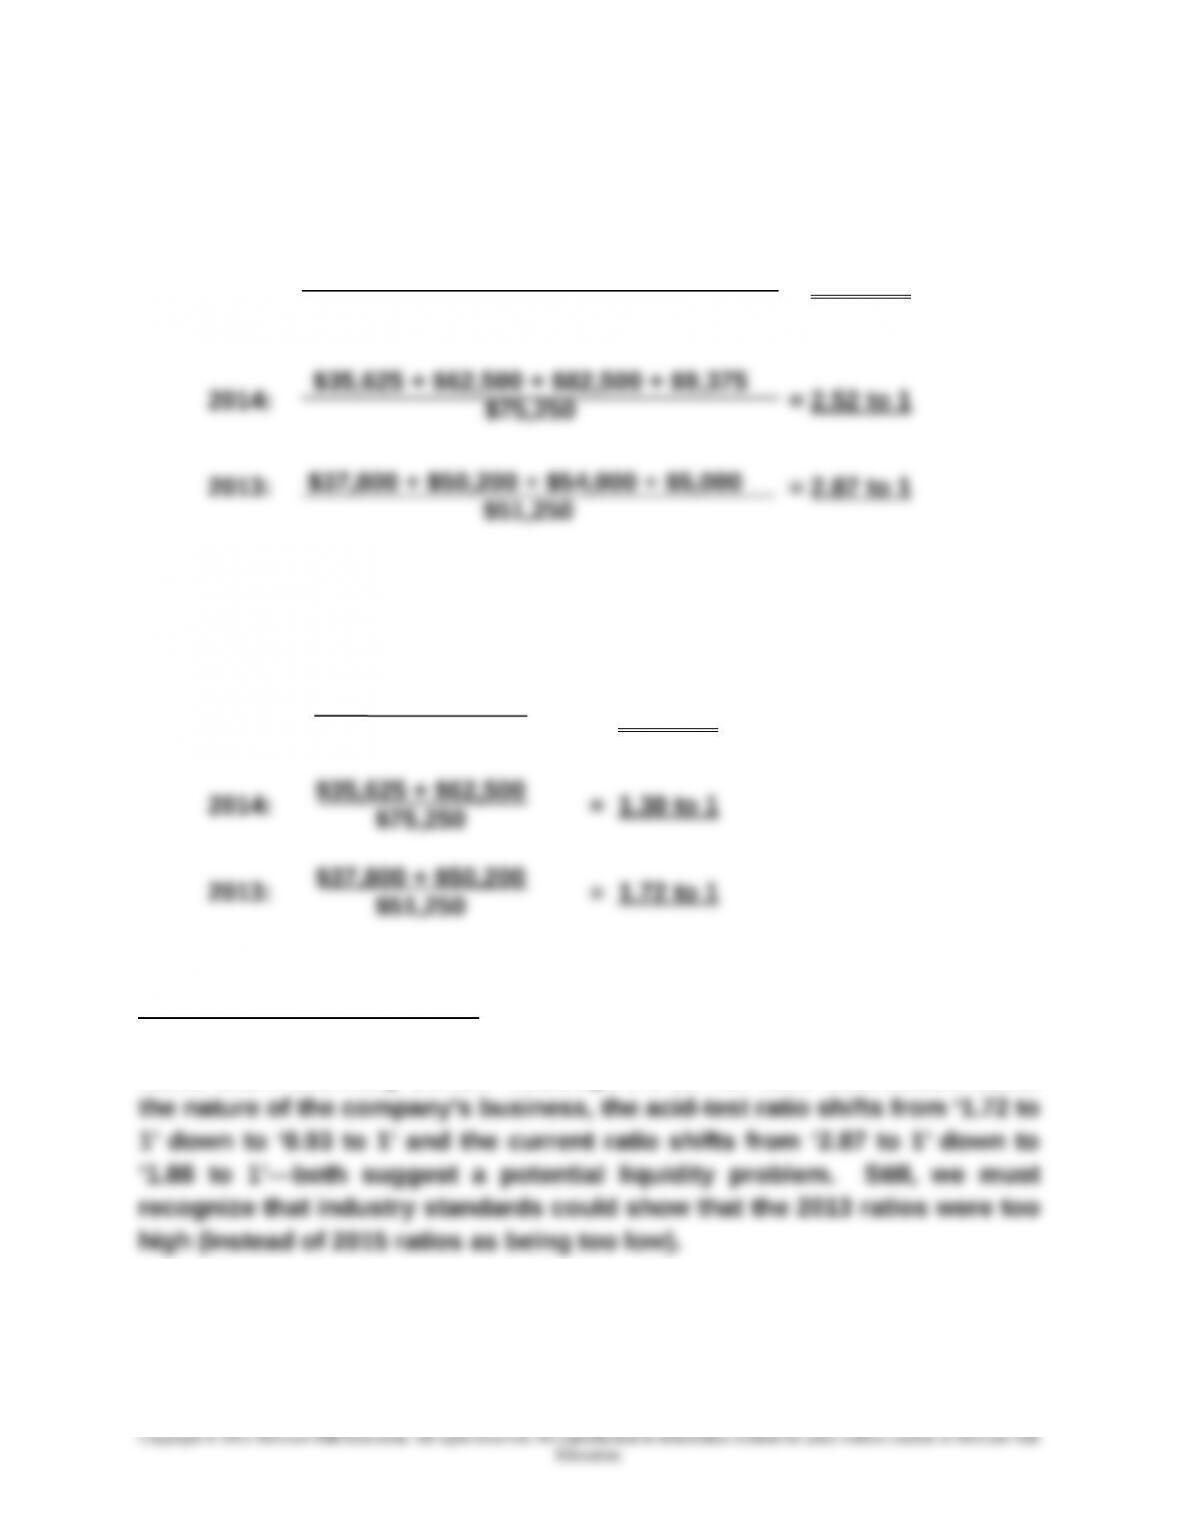
1. Current ratio
2015: = 1.88 to 1
2. Acid-test ratio
2015: = 0.93 to 1
Analysis and Interpretation: Simon’s short-term liquidity position has
deteriorated over this three-year period. Both the current and acid-test
ratios show declining trends. Although we do not have information about
17-963
$31,800 + $89,500 + $112,500 + $10,700
$129,900
$31,800 + $89,500
$129,900
Chapter 17 – Analysis of Financial Statements
Exercise 17-8 (25 minutes)
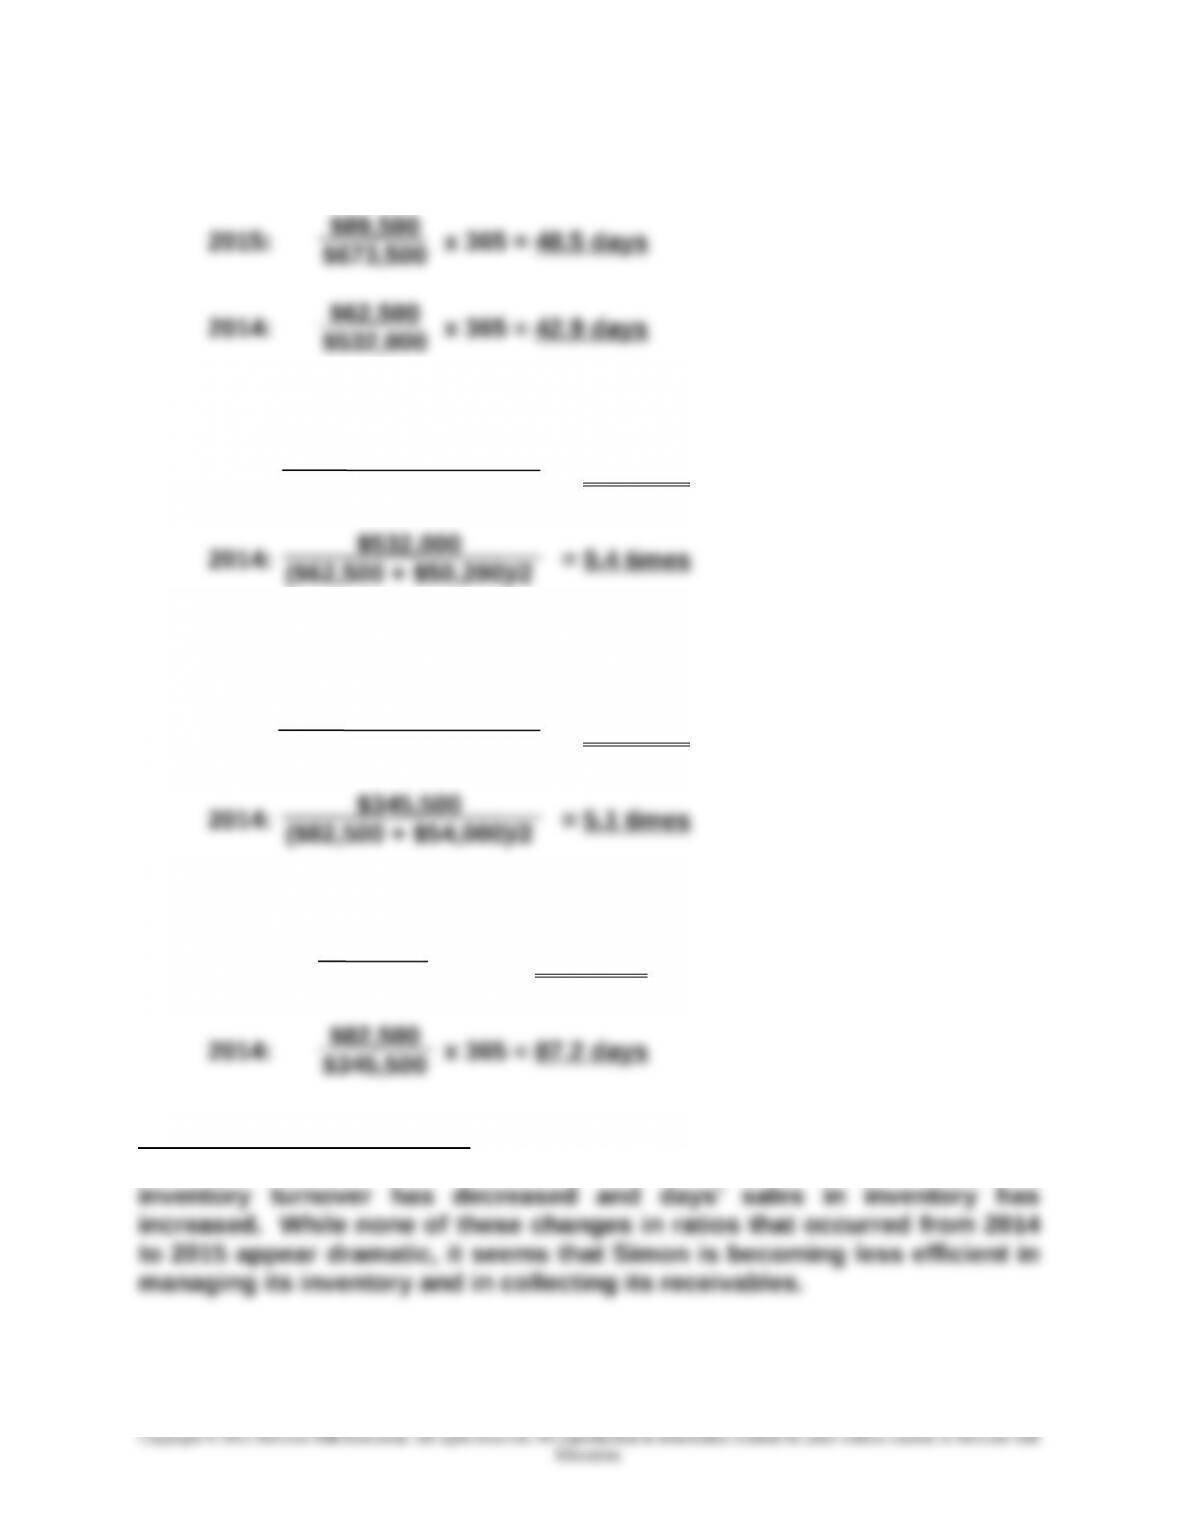
1. Days’ sales uncollected
2. Accounts receivable turnover
2015: = 8.9 times
3. Inventory turnover
2015: = 4.2 times
4. Days’ sales in inventory
2015: x 365 = 99.9 days
Analysis and Interpretation: The number of days’ sales uncollected has
increased and the accounts receivable turnover has declined. Also, the
17-964
Copyright © 2015 McGraw-Hill Education. All rights reserved. No reproduction or distribution without the prior written consent of McGraw-Hill
Education.
$89,500
$532,000
$673,500
($89,500 + $62,500)/2
$411,225
($112,500 + $82,500)/2
$112,500
$411,225
Chapter 17 – Analysis of Financial Statements
Exercise 17-9 (25 minutes)
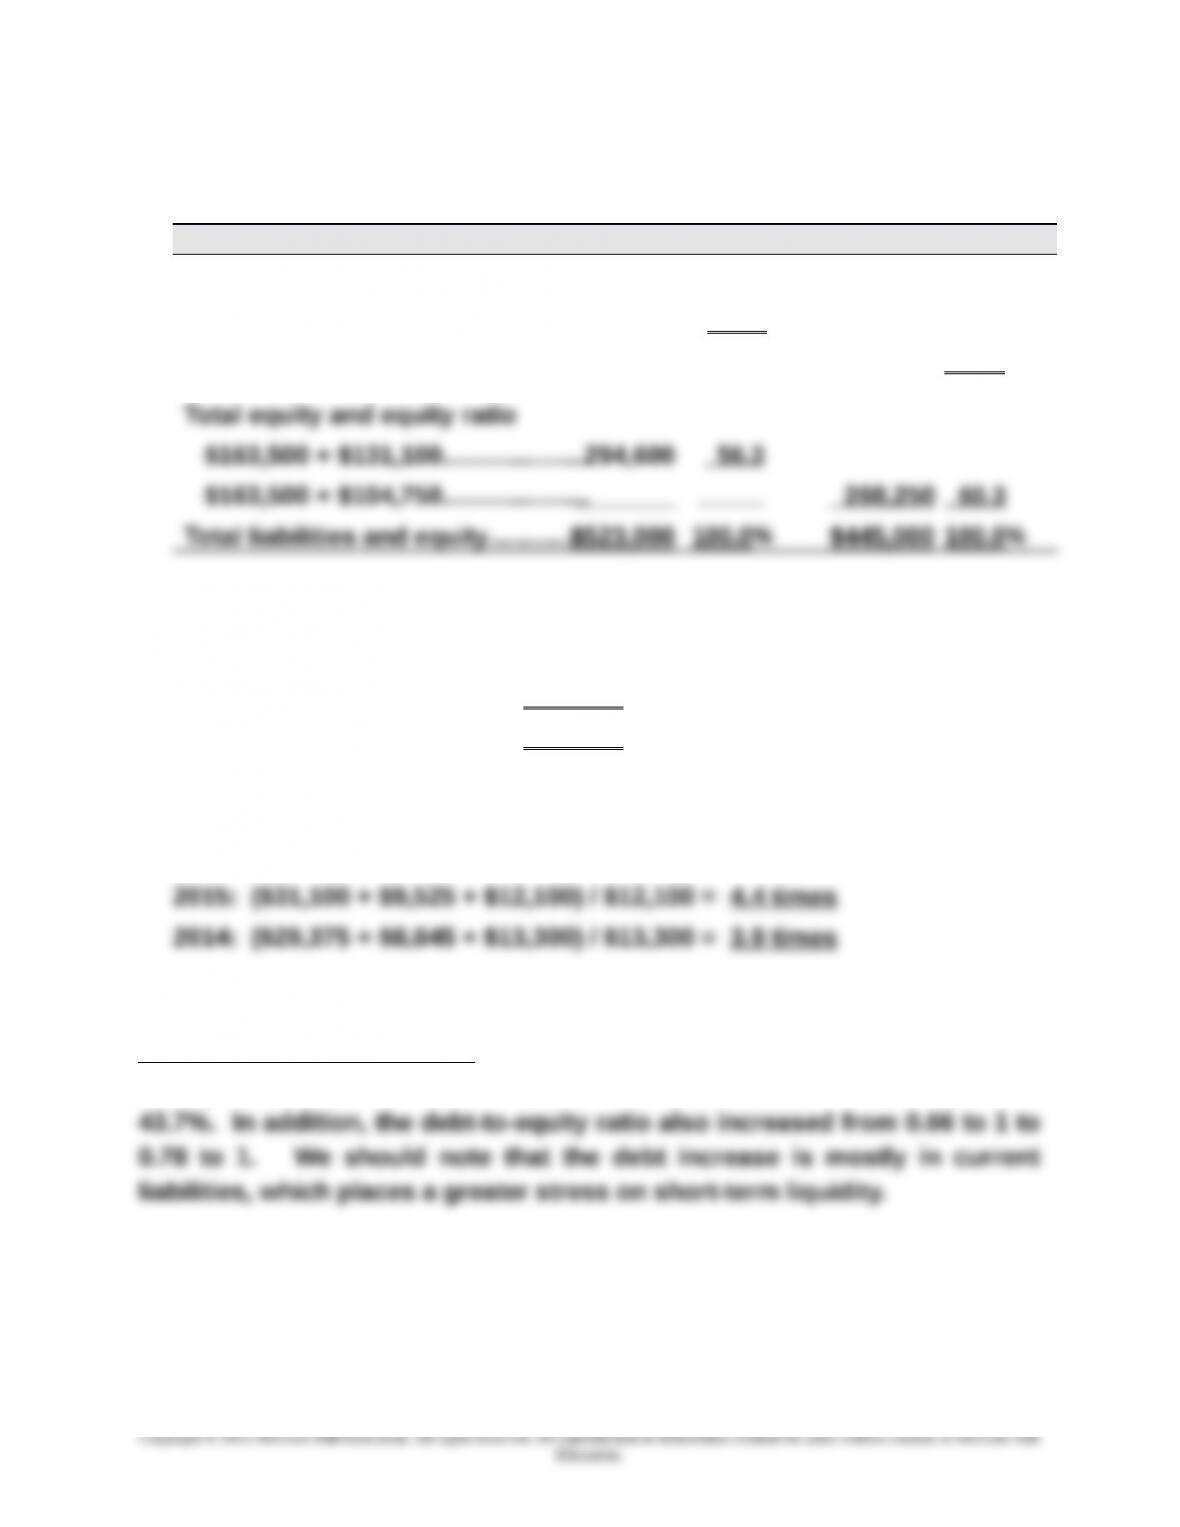
1. Debt and equity ratios
2015 2014
Total liabilities and debt ratio
$129,900 + $98,500…………….…....$228,400 43.7%
$75,250 + $101,500…………….….... $176,750 39.7%
2. Debt-to-equity ratio
2015: $228,400 / $294,600 = 0.78 to 1
2014: $176,750 / $268,250 = 0.66 to 1
3. Times interest earned
Analysis and Interpretation: Simon added debt to its capital structure
during 2015, with the result that the debt ratio increased from 39.7% to
17-965
Chapter 17 – Analysis of Financial Statements
Exercise 17-10 (30 minutes)
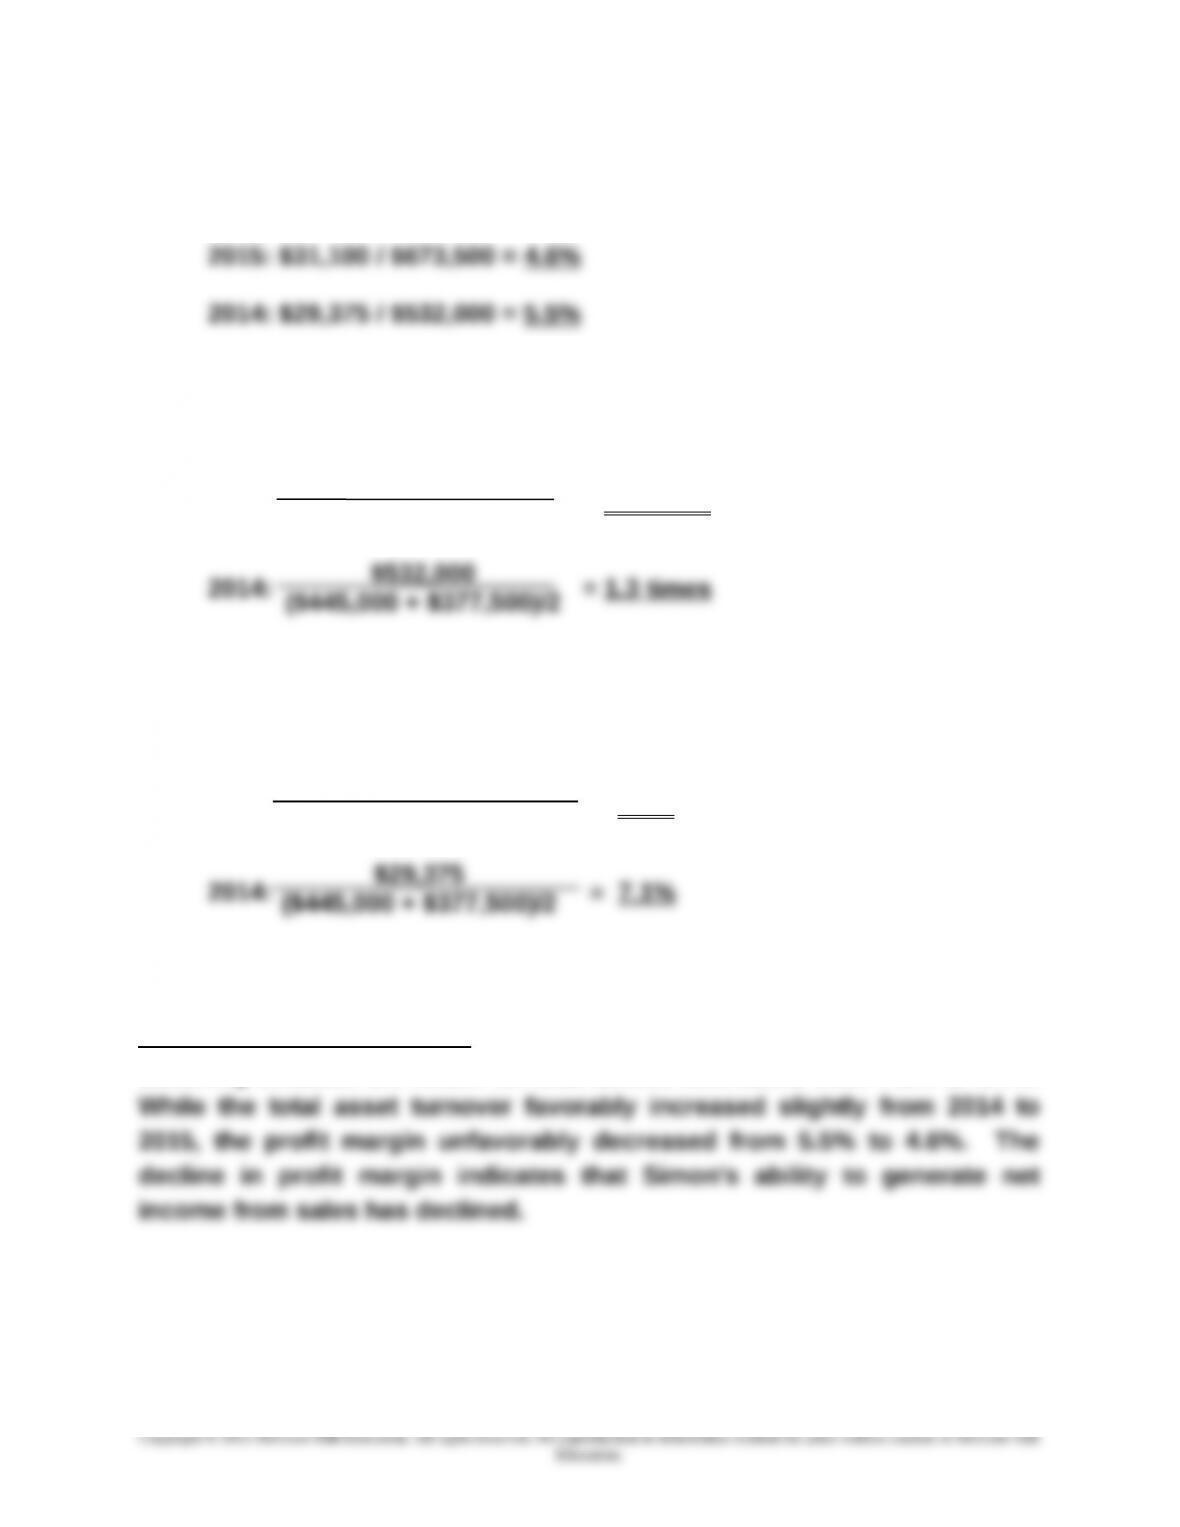
1. Profit margin
2. Total asset turnover
2015: = 1.4 times
3. Return on total assets
2015: = 6.4 %
Analysis and Interpretation: Simon’s operating efficiency appears to be
declining because the return on total assets decreased from 7.1% to 6.4%.
17-966
$673,500
($523,000 + $445,000)/2
$31,100
($523,000 + $445,000)/2
Chapter 17 – Analysis of Financial Statements
Exercise 17-11 (20 minutes)
1. Return on common stockholders’ equity
2015: = 11.1%
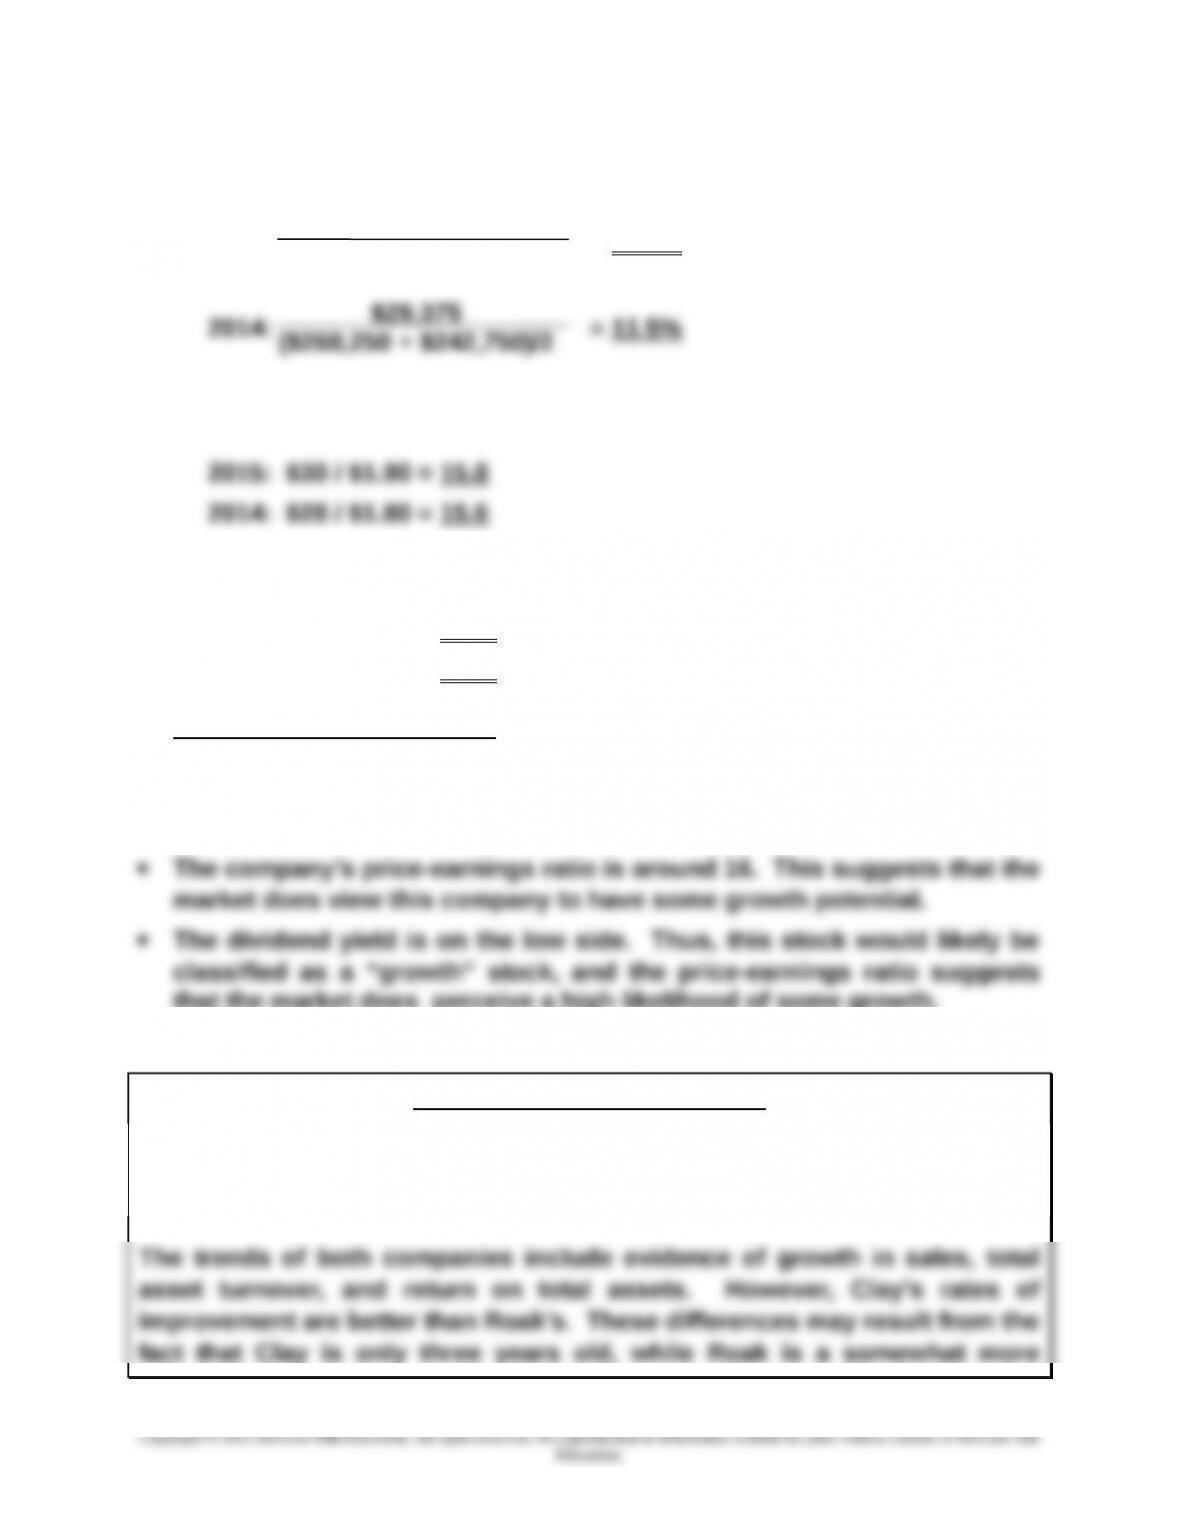
2. Price-earnings ratio, December 31
3. Dividend yield
2015: $0.29 / $30 = 0.1%
2014: $0.24 / $28 = 0.9 %
Analysis and interpretation
The company’s return on common stockholders’ equity is good, but not
great. An 11% return likely makes it an acceptable investment (in the
business world) provided its risk is not too high.
that the market does perceive a high likelihood of some growth.
Exercise 17-12 (30 minutes)
COMPARATIVE ANALYSIS REPORT
Clay’s profit margins are higher than Roak’s. However, Roak has
significantly higher total asset turnover ratios. As a result, Roak generates
a substantially higher return on total assets.
17-967
$31,100
($294,600 + $268,250)/2
Chapter 17 – Analysis of Financial Statements
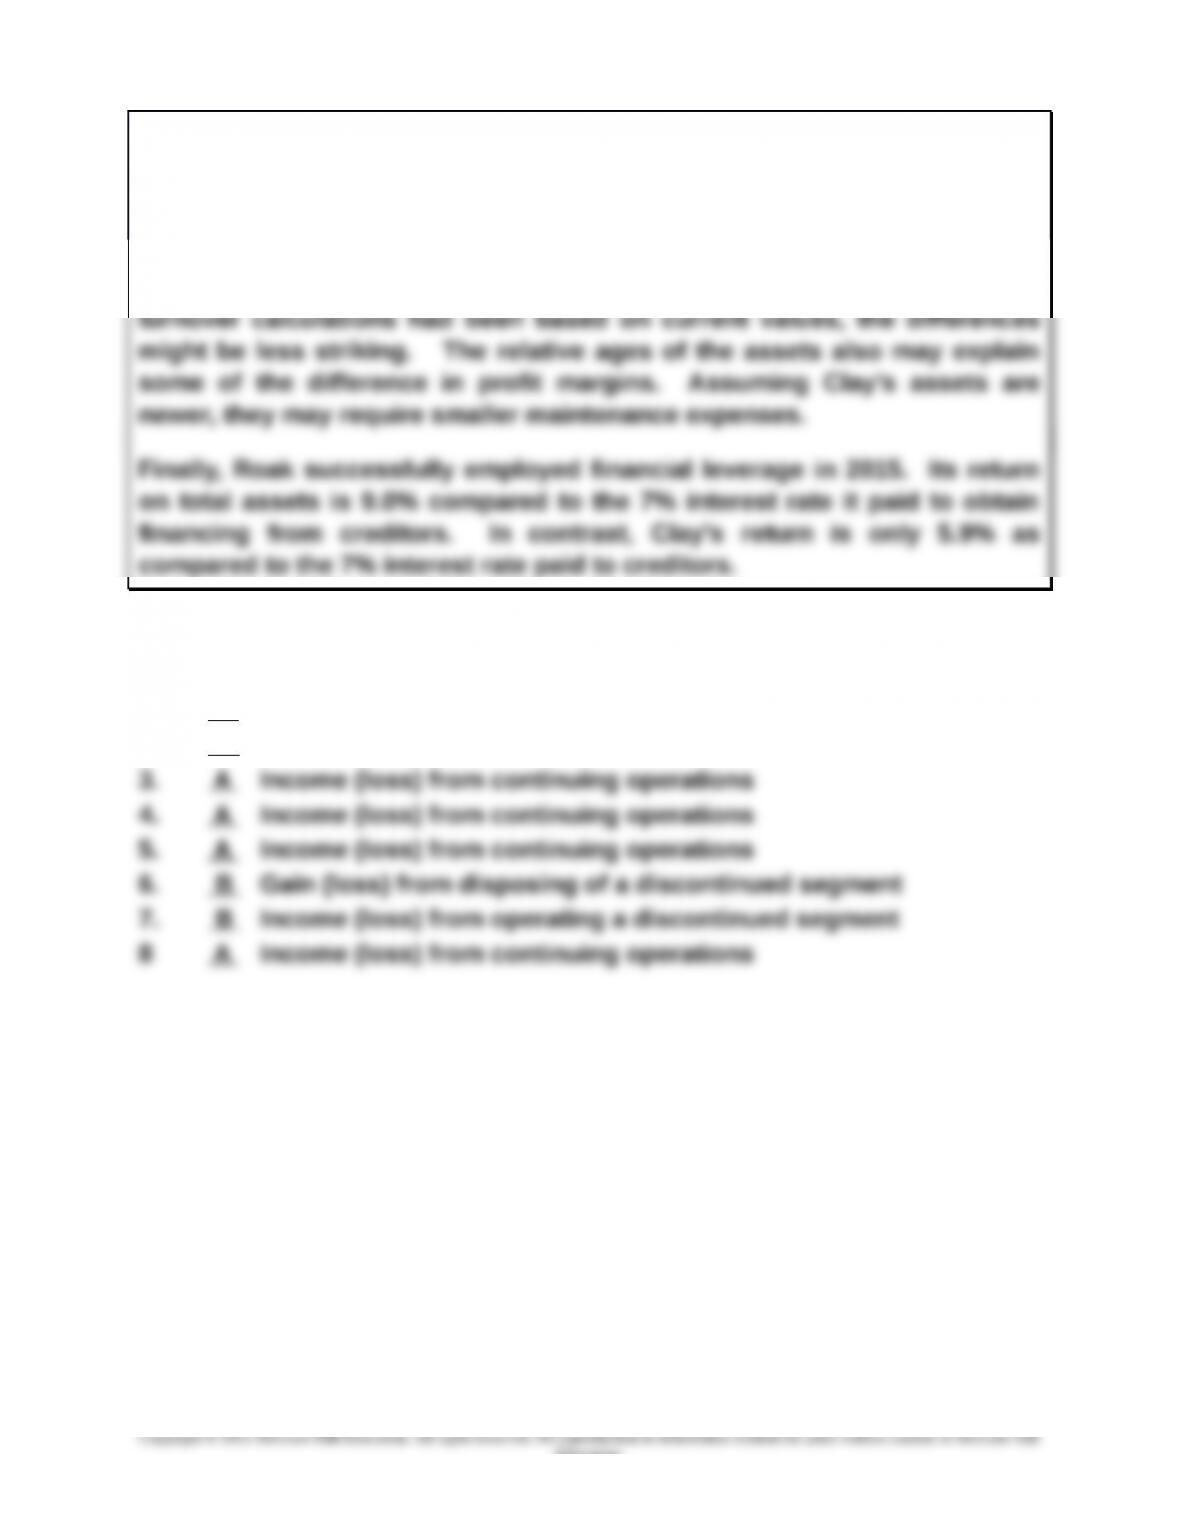
established company. Clay’s operations are considerably smaller than
Roak’s, but that will not persist many more years if both companies
continue to grow at their current rates.
To some extent, Roak’s higher total asset turnover ratios may result from
the fact that its assets may have been purchased years earlier. If the
Exercise 17-13A (10 minutes)
1. A Income (loss) from continuing operations
2. C Extraordinary gain (loss)
17-968
Education.
Chapter 17 – Analysis of Financial Statements
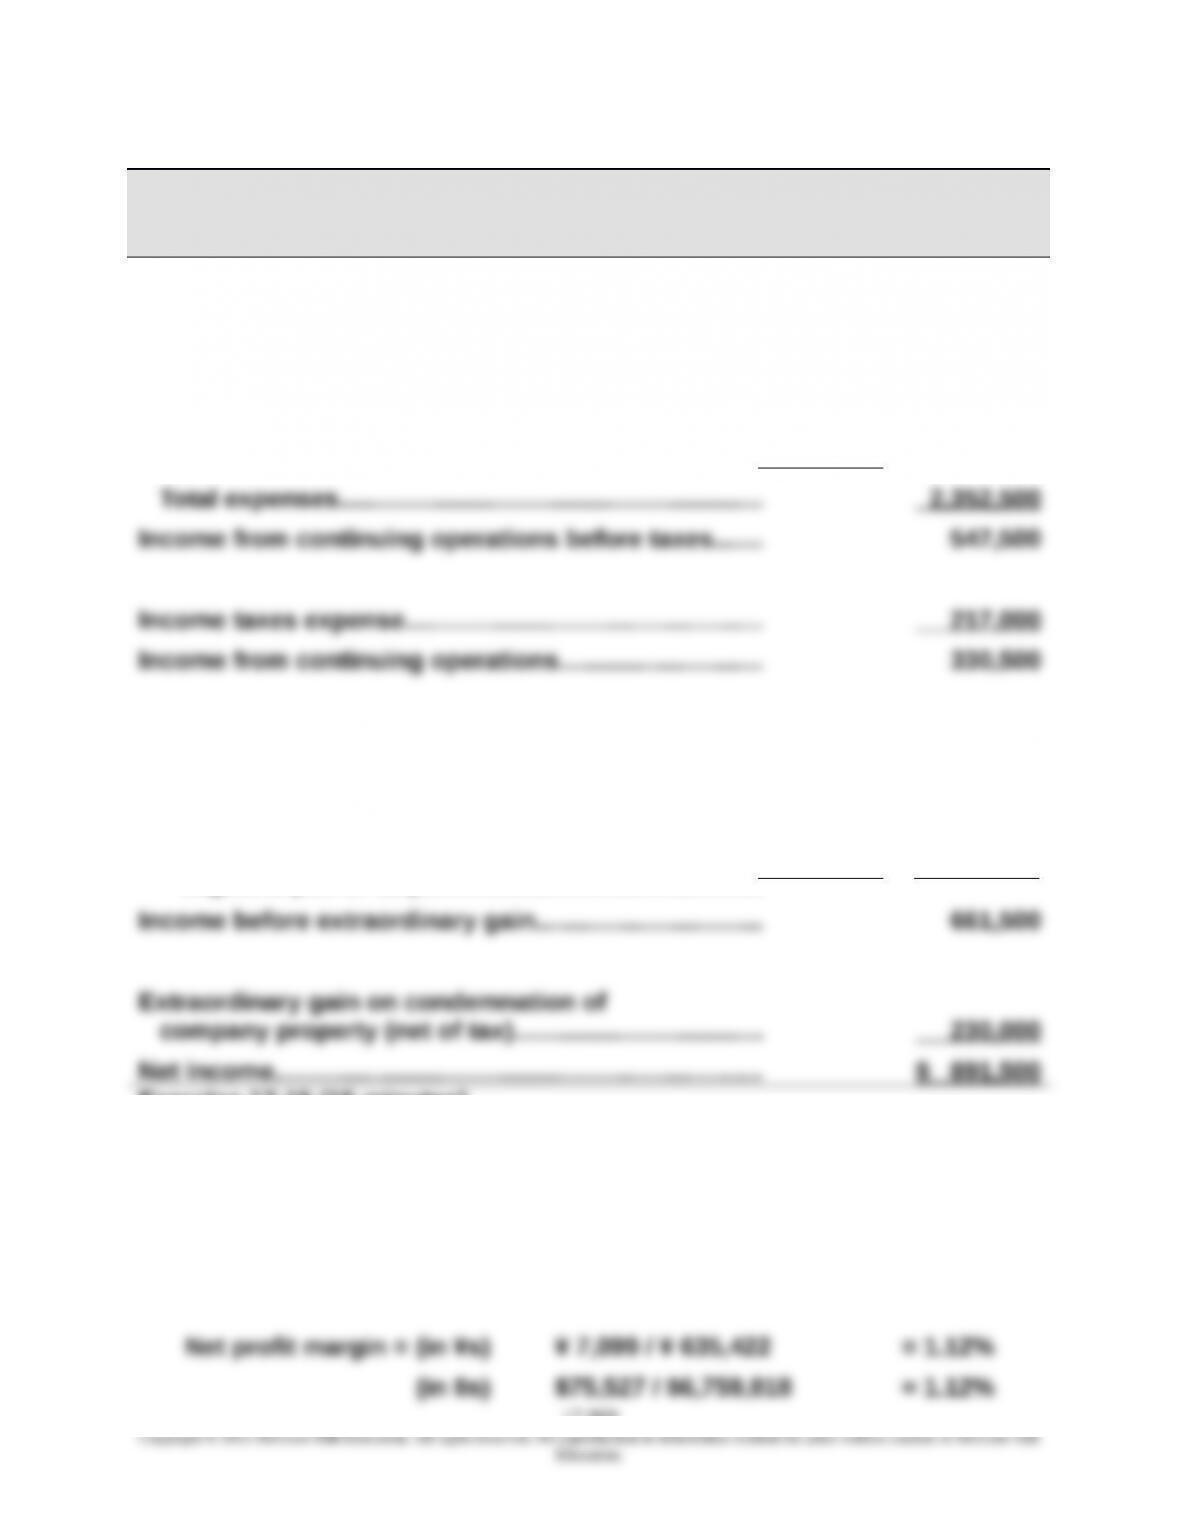
Exercise 17-14 (15 minutes)
RANDA MERCHANDISING, INC.
Income Statement
For Year Ended December 31, 2015
Net sales……………………………………………………………….. $2,900,000
Expenses
Cost of goods sold……………………………………..……....$1,480,000
Salaries expense……………………………...………………... 640,000
Depreciation expense……………………..………..………… 232,500
Discontinued segment
Loss from operating wholesale business
segment (net of tax)…………………………….…………… (444,000)
Gain on sale of wholesale business
segment (net of tax)……………………..………………..…
775,000 331,000
Exercise 17-15 (15 minutes)
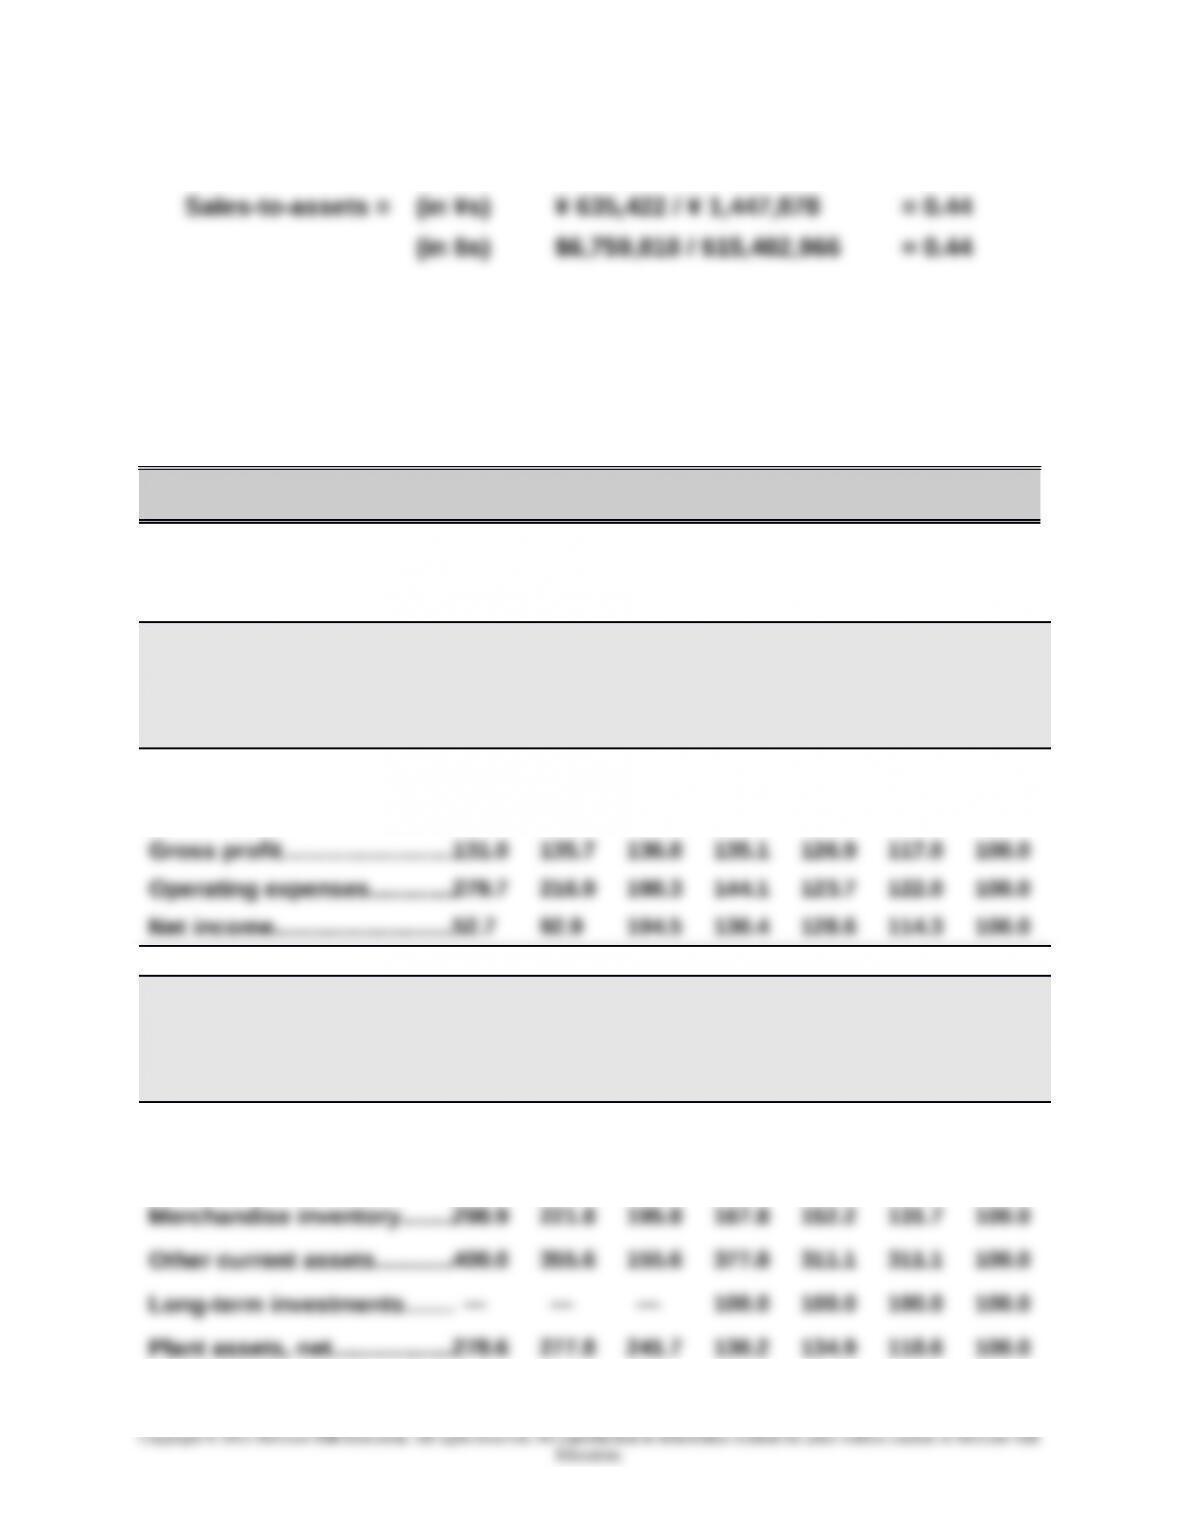
1. Current ratio = (in ¥s) ¥ 1,192,250 / ¥ 194,475 = 6.13
(in $s) $12,683,516 / $2,068,887 = 6.13
17-969
Chapter 17 – Analysis of Financial Statements
2. The results in part 1 reveal that ratios can help us overcome
differences attributable to currencies. However, ratios do not overcome
potential differences in application of accounting principles.
PROBLEM SET A
Problem 17-1A (120 minutes)
Part 1
HAROUN COMPANY
Income Statement Trends
For Years Ended December 31, 2015-2009
2015 2014 2013 2012 2011 2010 2009
Sales…..………………….….…....
182.5% 161.2% 147.6% 136.2% 127.8% 119.6% 100.0%
Cost of goods sold……………212.6 176.1 153.9 136.9 128.3 121.2 100.0
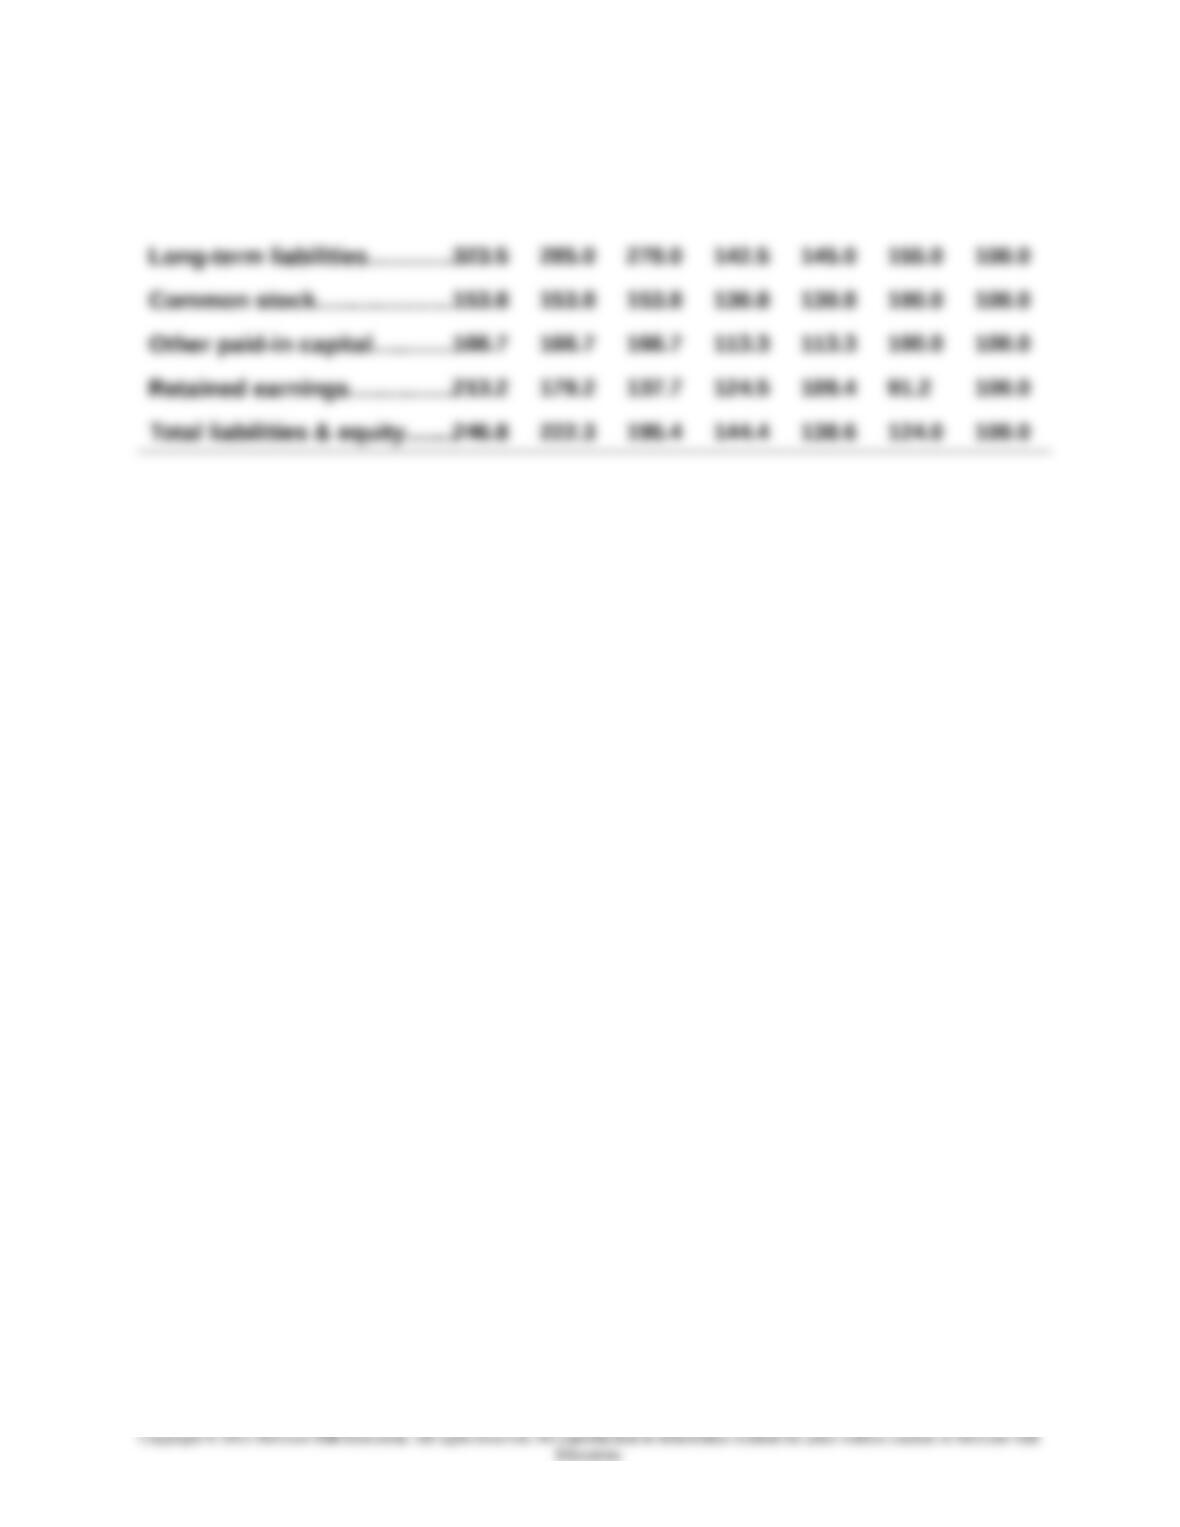
HAROUN COMPANY
Balance Sheet Trends
December 31, 2015-2009
2015 2014 2013 2012 2011 2010 2009
Cash……………………..………….65.2% 87.6% 92.1% 94.4% 98.9% 96.6% 100.0%
Accounts recble., net……..…226.9 238.0 215.7 166.7 147.2 139.8 100.0
17-970
Chapter 17 – Analysis of Financial Statements
Total assets…………….….….…246.8 222.3 195.4 144.4 138.6 124.0 100.0
Current liabilities………………432.6 369.5 254.6 217.7 193.6 185.1 100.0
17-971
Chapter 17 – Analysis of Financial Statements
Problem 17-1A (concluded)
Part 2
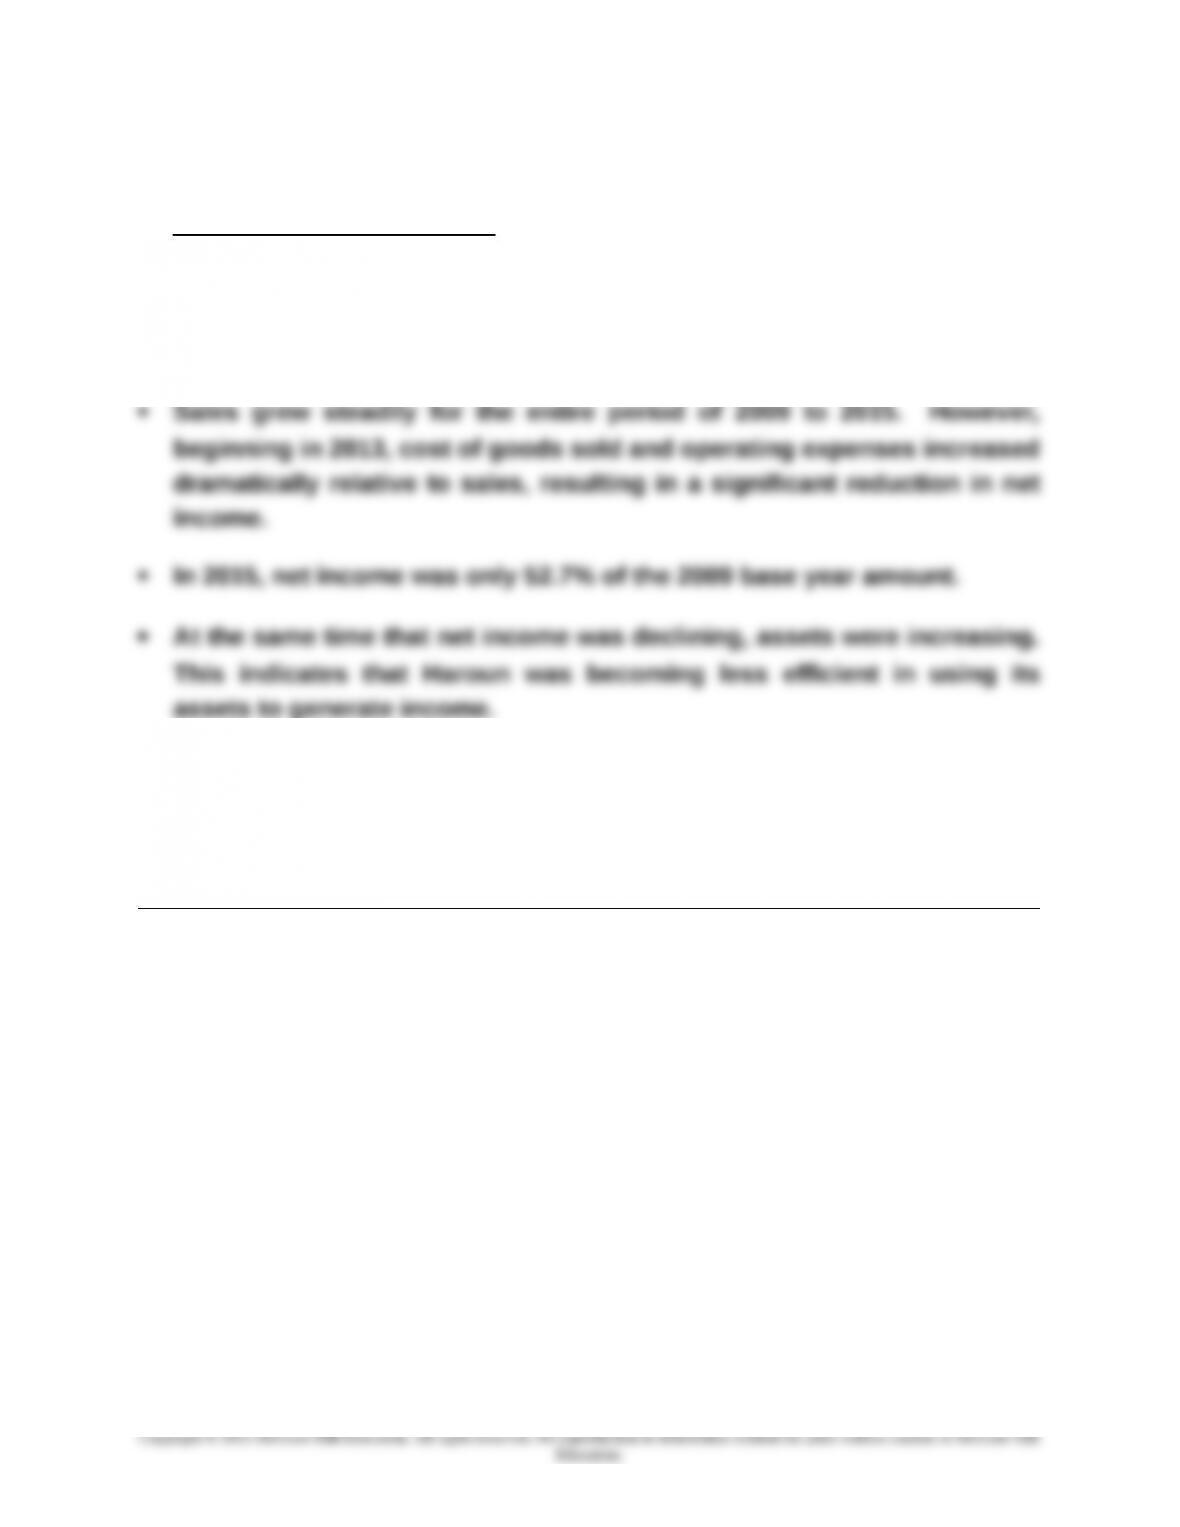
Analysis and Interpretation
The statements and the trend percent data indicate that the company
significantly expanded its plant assets in 2013. Prior to that time, the
company enjoyed increasing gross profit and net income.
The short-term liquidity of the company continued to decline. Accounts
receivable did not change significantly for the period of 2013 to 2015,
but cash steadily declined and inventory sharply increased as did
current liabilities.
17-972