Exercise 17-8 (25 minutes)
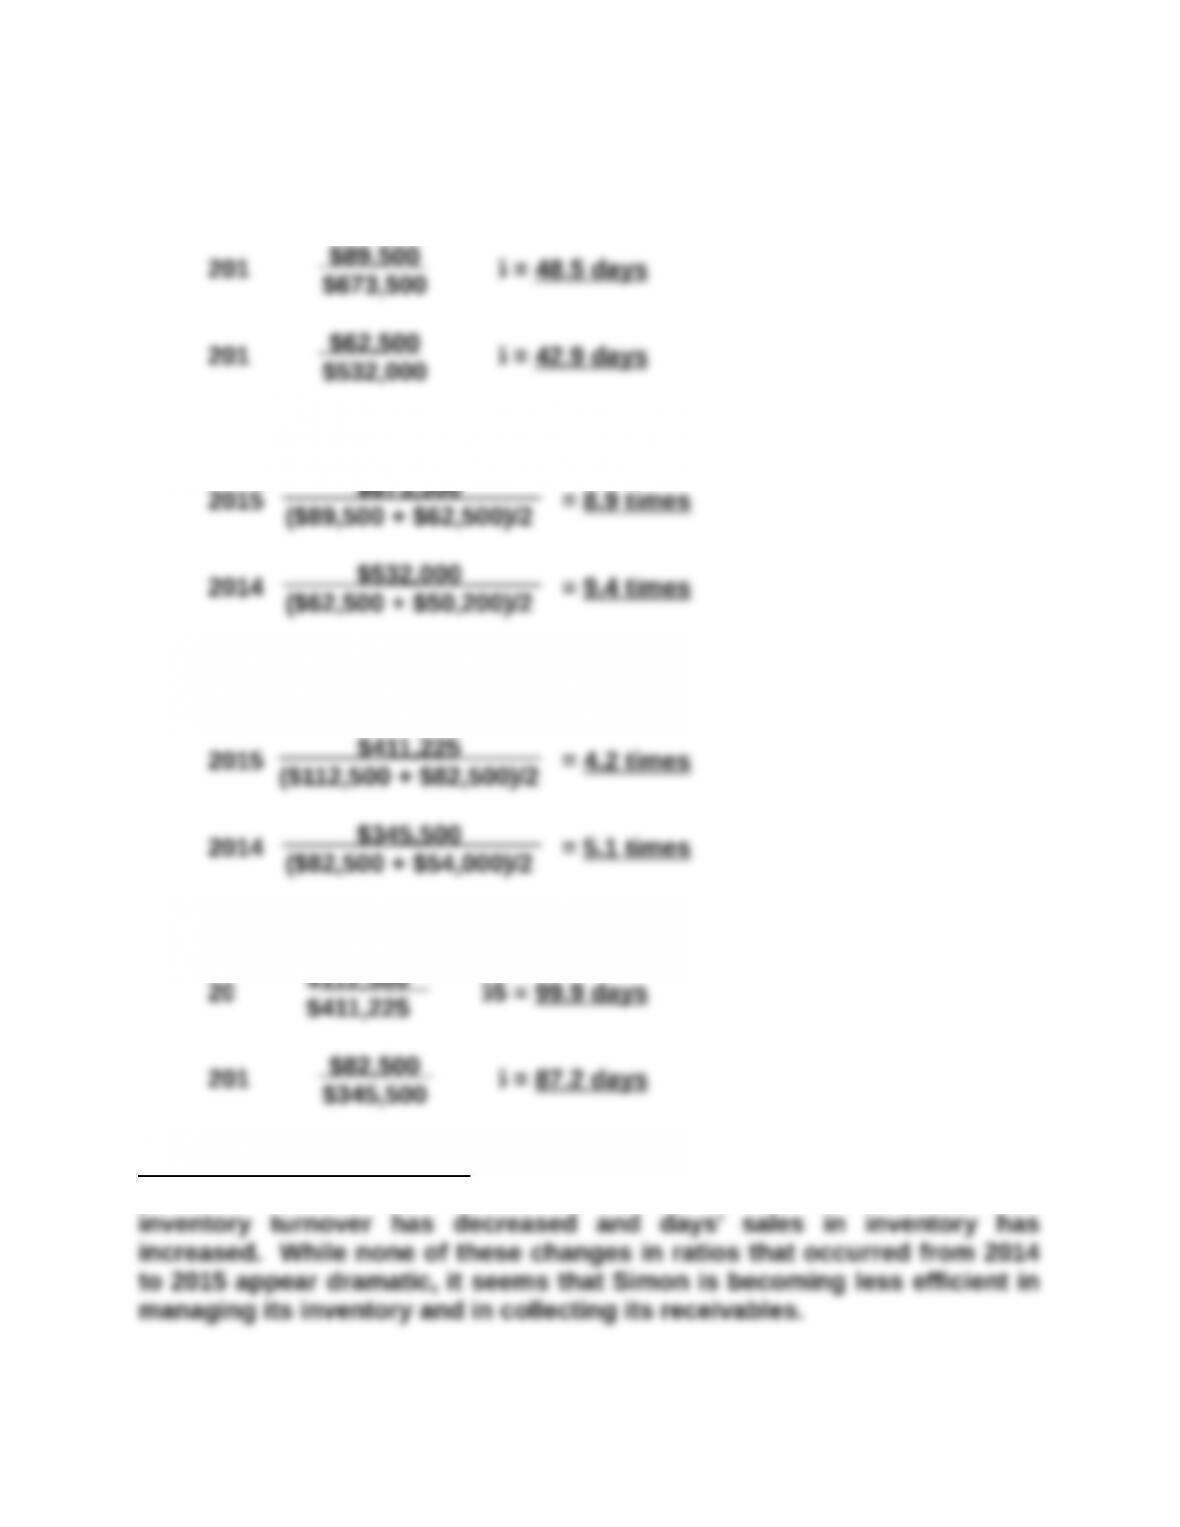
1. Days’ sales uncollected
2. Accounts receivable turnover
4. Days’ sales in inventory
Analysis and Interpretation: The number of days’ sales uncollected has
increased and the accounts receivable turnover has declined. Also, the
inventory turnover has decreased and days’ sales in inventory has
increased. While none of these changes in ratios that occurred from 2014
to 2015 appear dramatic, it seems that Simon is becoming less efficient in
managing its inventory and in collecting its receivables.
$89,500
$532,000
$673,500
$112,500
Exercise 17-9 (25 minutes)
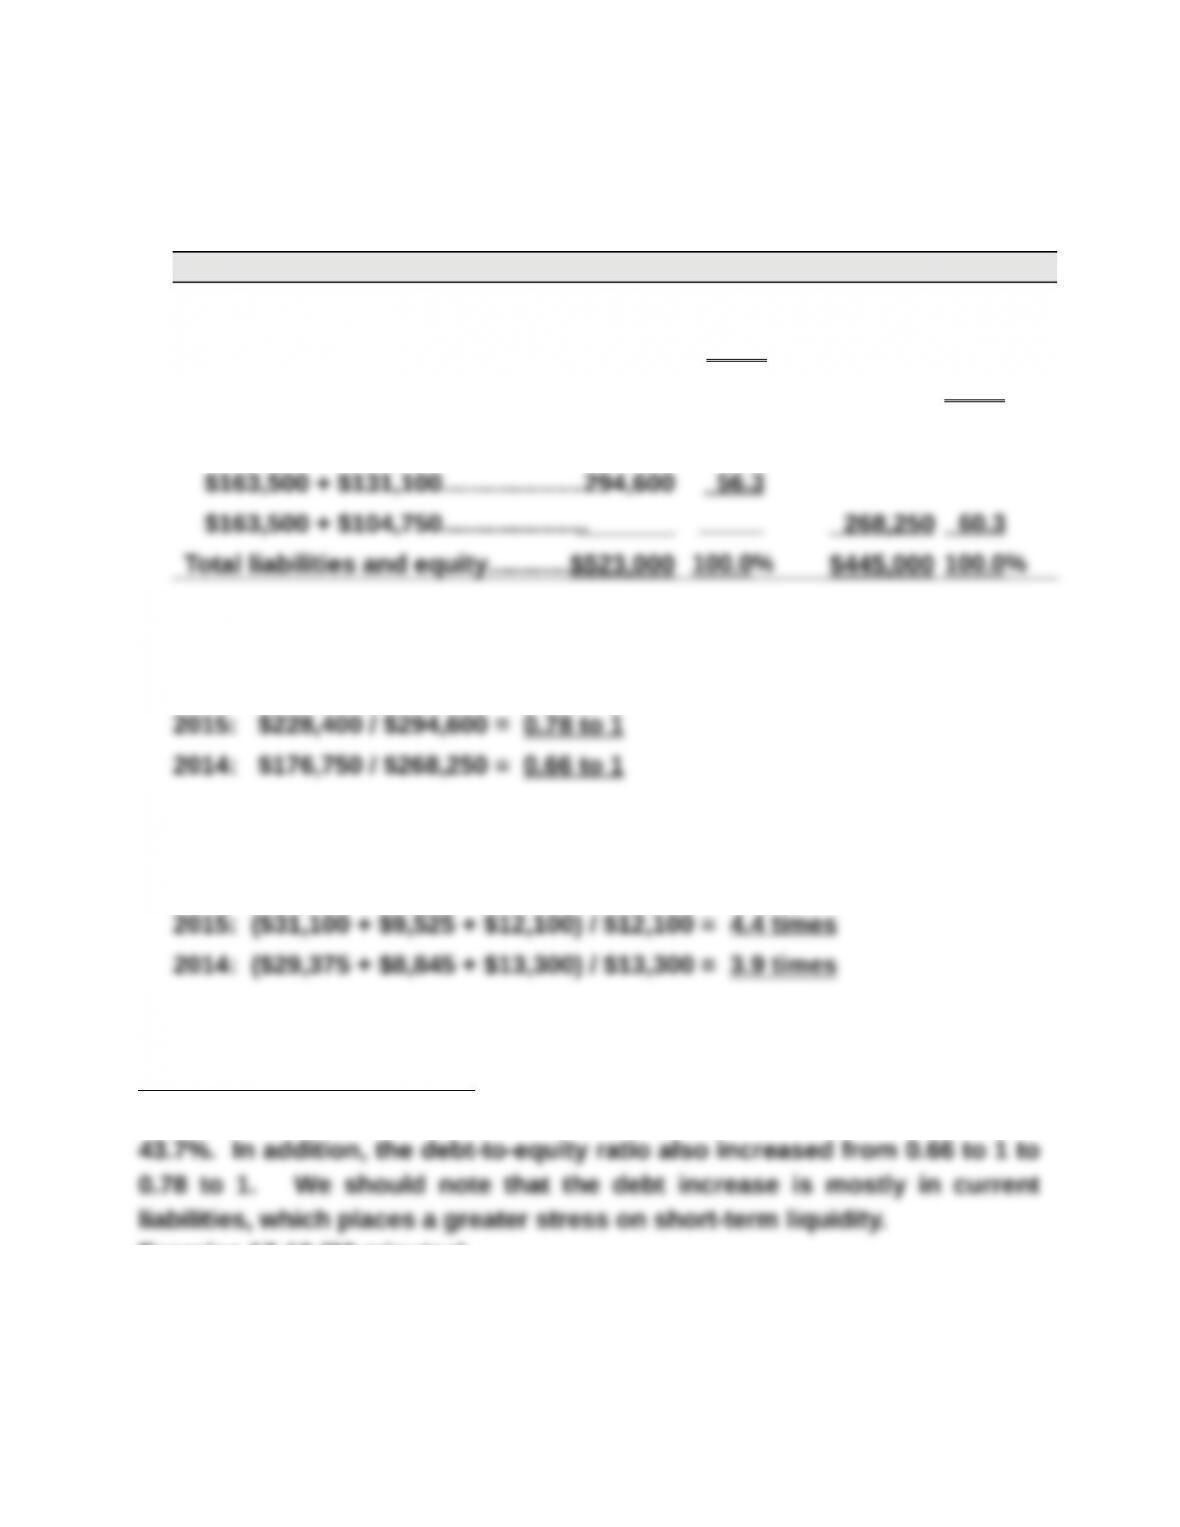
1. Debt and equity ratios
2015 2014
Total liabilities and debt ratio
$129,900 + $98,500………………….$228,400 43.7%
$75,250 + $101,500…………………. $176,750 39.7%
Total equity and equity ratio
2. Debt-to-equity ratio
3. Times interest earned
Analysis and Interpretation: Simon added debt to its capital structure
during 2015, with the result that the debt ratio increased from 39.7% to
Exercise 17-10 (30 minutes)
1. Profit margin
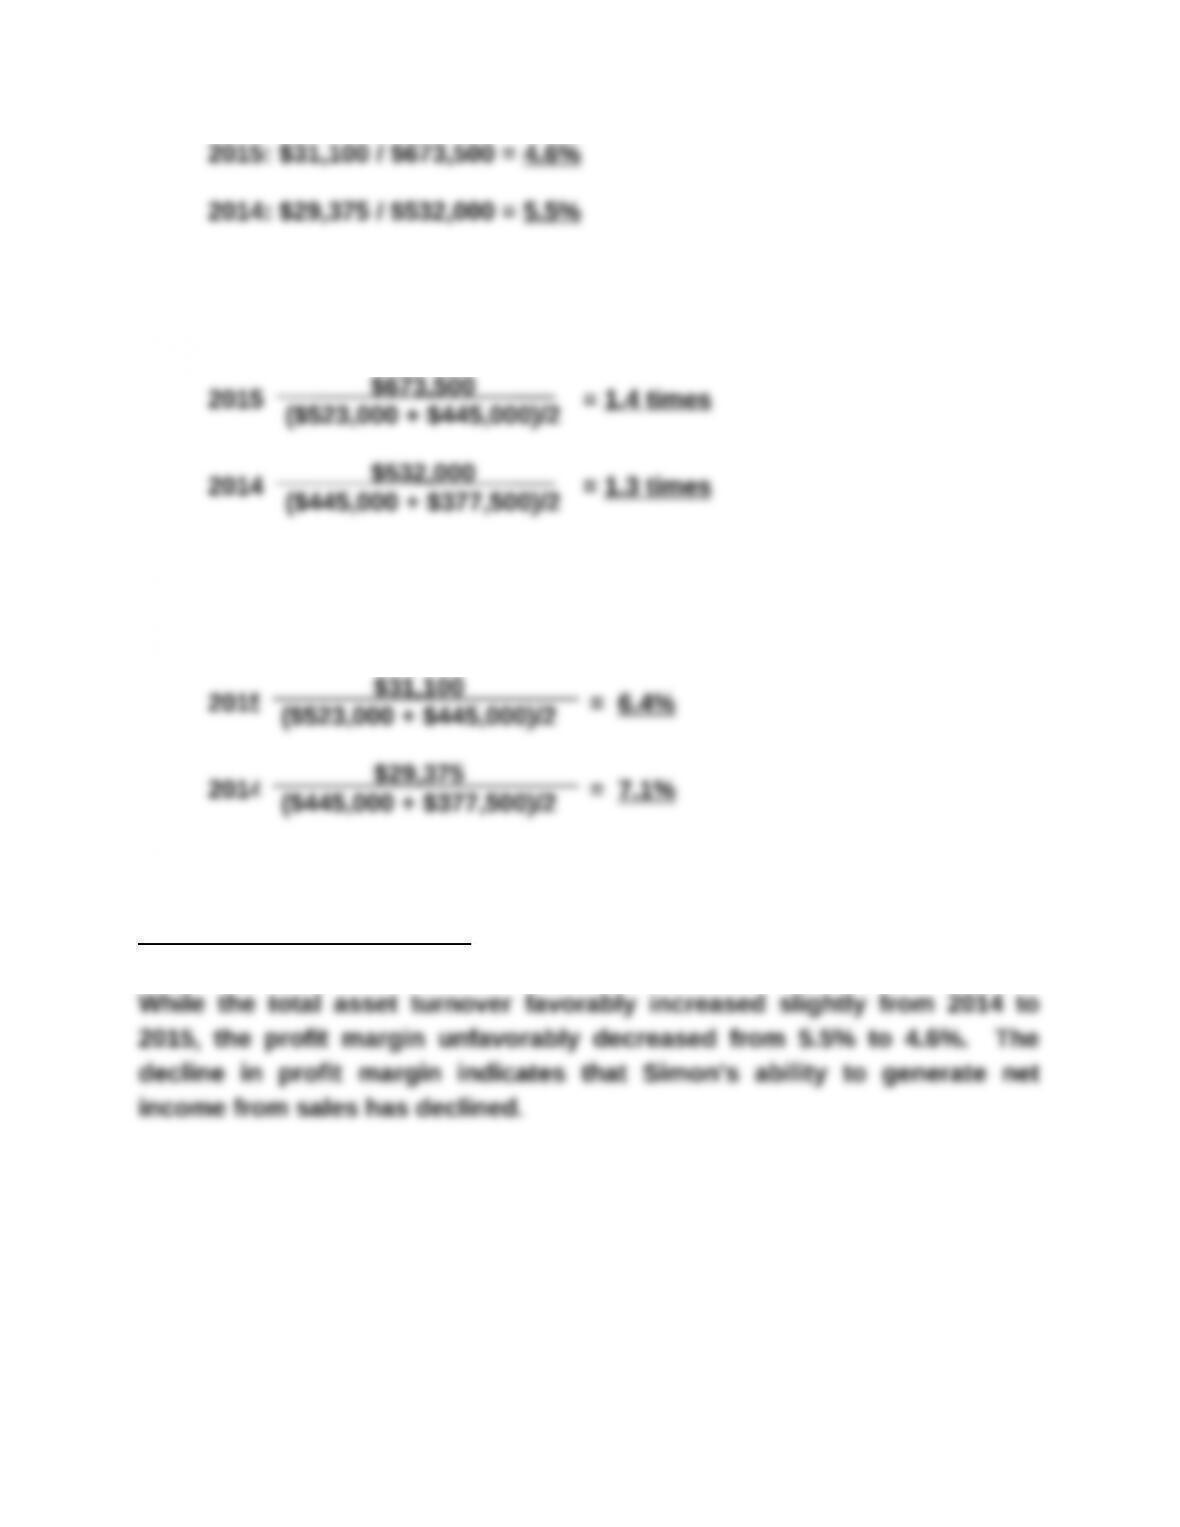
2. Total asset turnover
3. Return on total assets
Analysis and Interpretation: Simon’s operating efficiency appears to be
declining because the return on total assets decreased from 7.1% to 6.4%.
While the total asset turnover favorably increased slightly from 2014 to
2015, the profit margin unfavorably decreased from 5.5% to 4.6%. The
decline in profit margin indicates that Simon’s ability to generate net
income from sales has declined.
$673,500
($445,000 + $377,500)/2
$31,100
($445,000 + $377,500)/2
Exercise 17-11 (20 minutes)
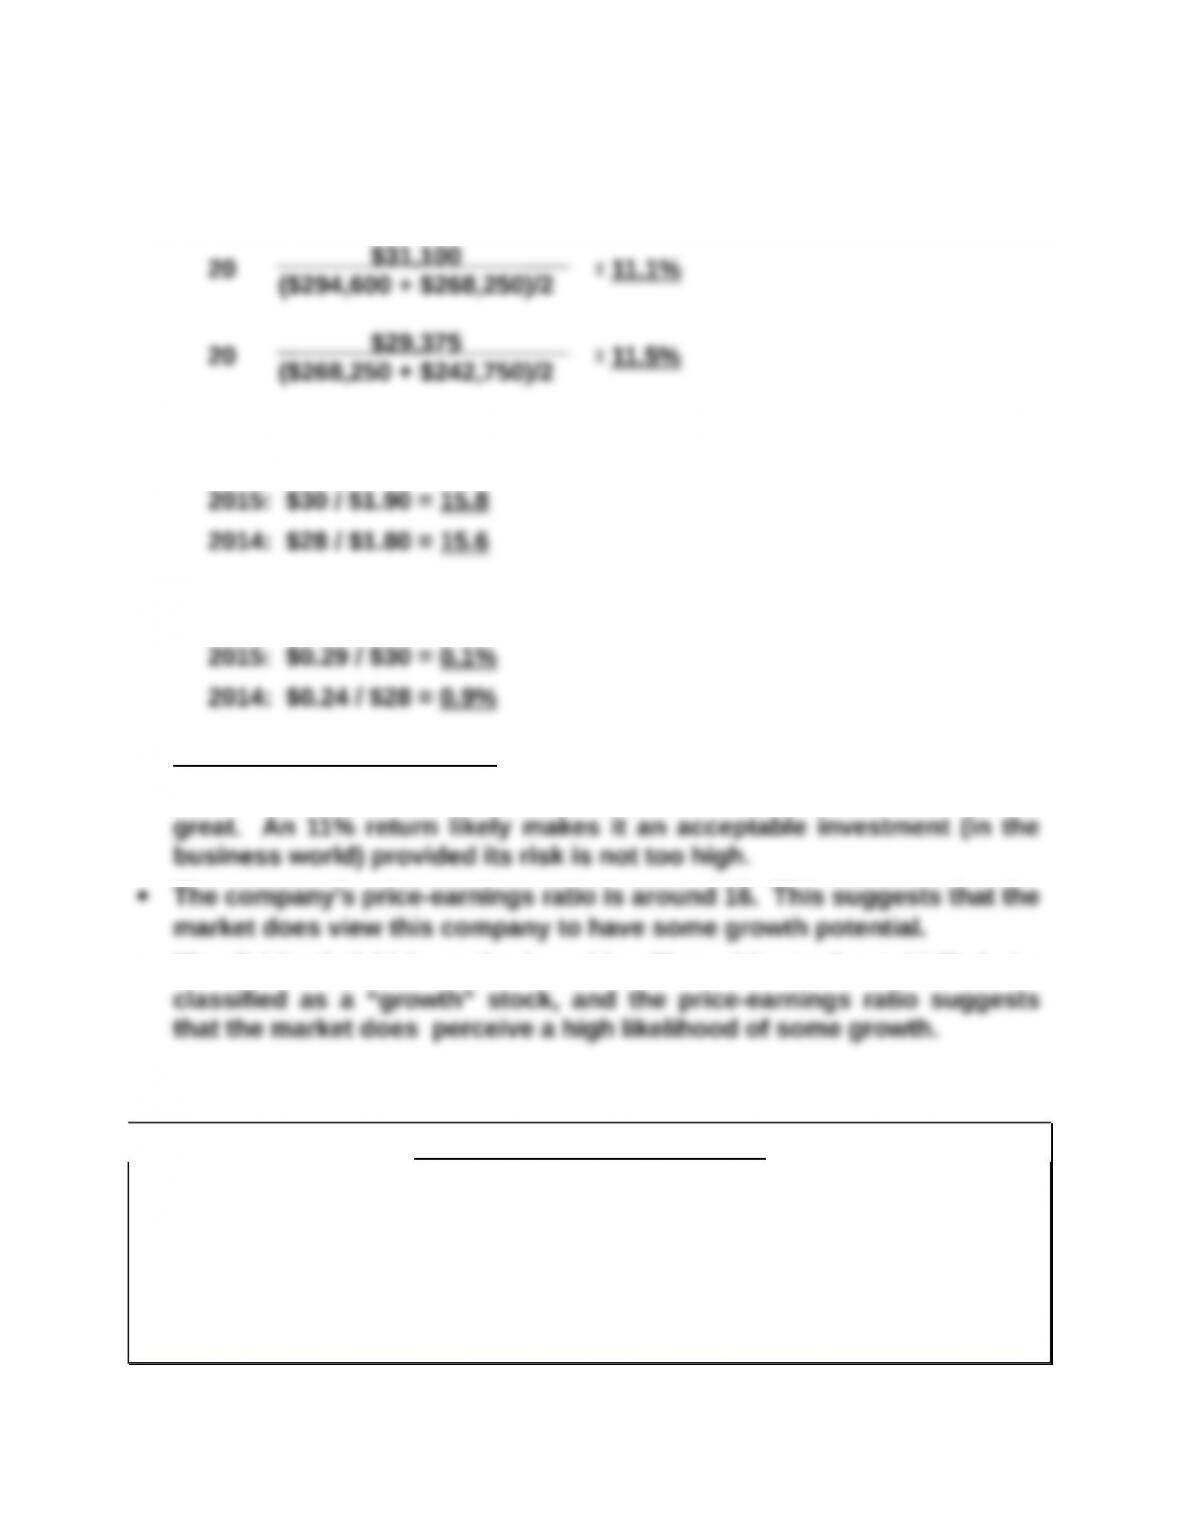
1. Return on common stockholders’ equity
2. Price-earnings ratio, December 31
3. Dividend yield
Analysis and interpretation
The company’s return on common stockholders’ equity is good, but not
The dividend yield is on the low side. Thus, this stock would likely be
Exercise 17-12 (30 minutes)
COMPARATIVE ANALYSIS REPORT
Clay’s profit margins are higher than Roak’s. However, Roak has
significantly higher total asset turnover ratios. As a result, Roak generates
a substantially higher return on total assets.
The trends of both companies include evidence of growth in sales, total
asset turnover, and return on total assets. However, Clay’s rates of
improvement are better than Roak’s. These differences may result from the
fact that Clay is only three years old, while Roak is a somewhat more
established company. Clay’s operations are considerably smaller than
Roak’s, but that will not persist many more years if both companies
continue to grow at their current rates.
To some extent, Roak’s higher total asset turnover ratios may result from
the fact that its assets may have been purchased years earlier. If the
turnover calculations had been based on current values, the differences
might be less striking. The relative ages of the assets also may explain
some of the difference in profit margins. Assuming Clay’s assets are
newer, they may require smaller maintenance expenses.
Finally, Roak successfully employed financial leverage in 2015. Its return
on total assets is 9.0% compared to the 7% interest rate it paid to obtain
financing from creditors. In contrast, Clay’s return is only 5.9% as
compared to the 7% interest rate paid to creditors.
Exercise 17-13A (10 minutes)
1. A Income (loss) from continuing operations
2. C Extraordinary gain (loss)
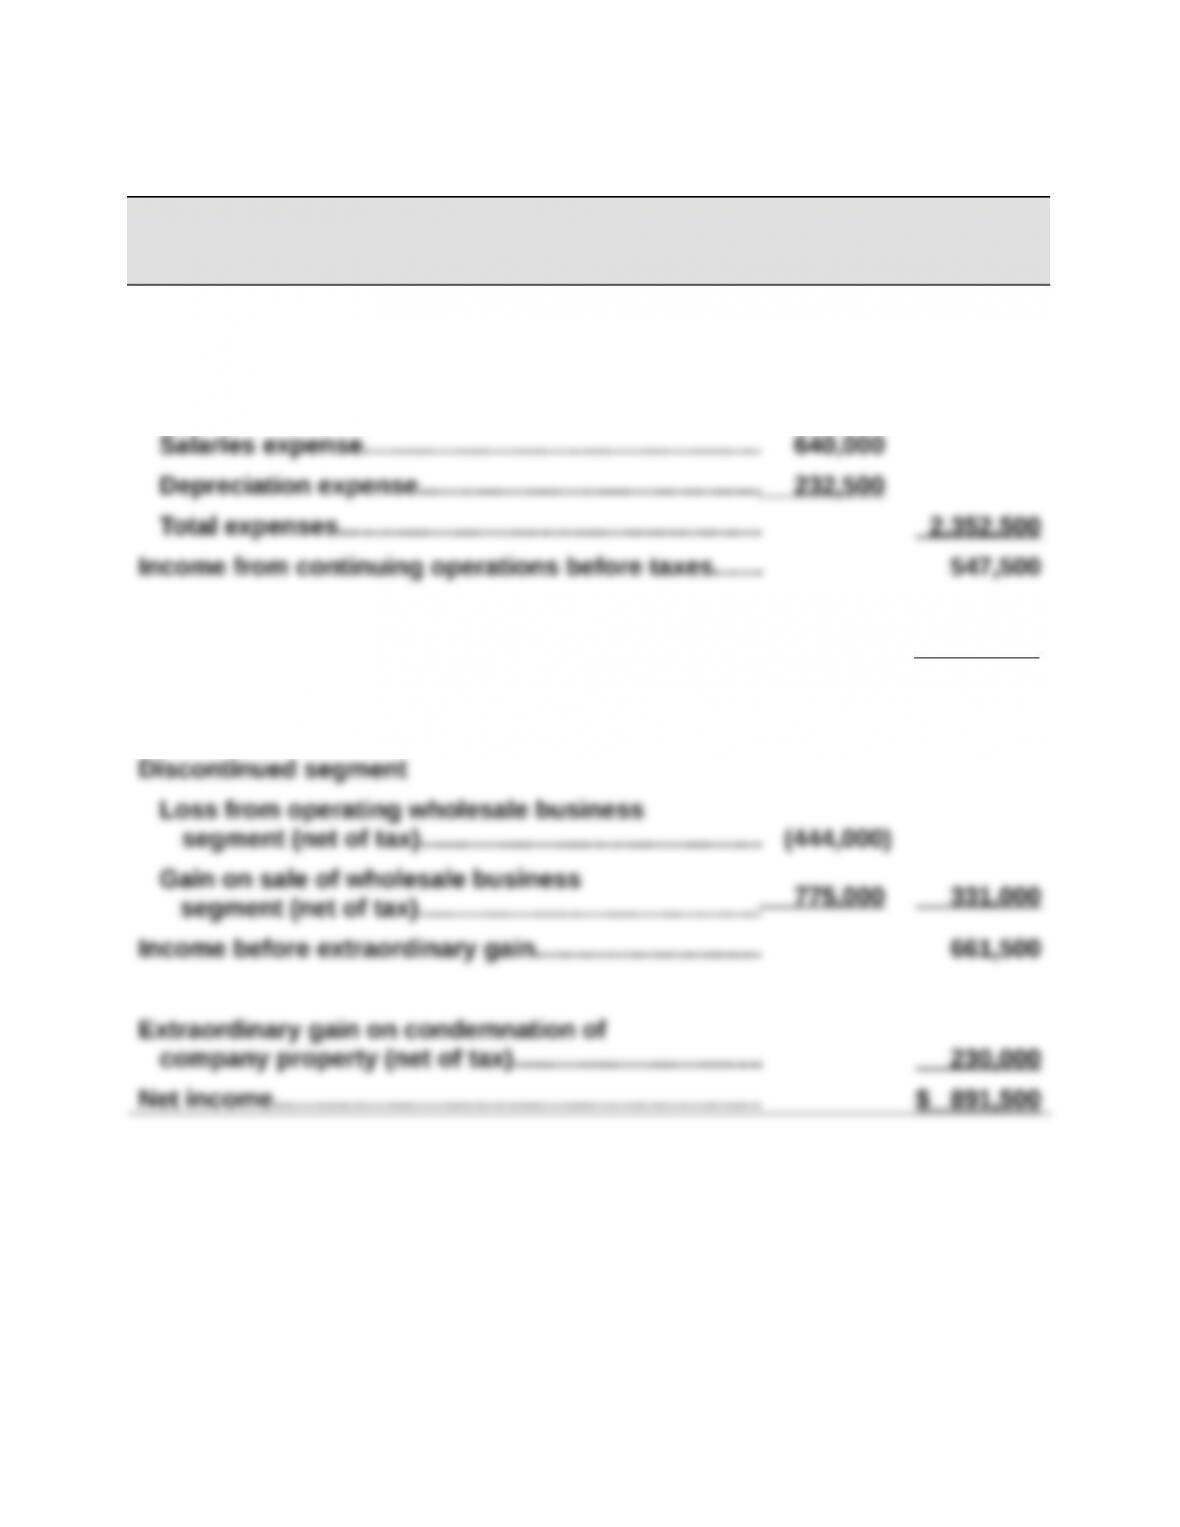
Exercise 17-14 (15 minutes)
RANDA MERCHANDISING, INC.
Income Statement
For Year Ended December 31, 2015
Net sales……………………………………………………………… $2,900,000
Expenses
Cost of goods sold…………………………………………….$1,480,000
Income taxes expense………………………………………….. 217,000
Income from continuing operations………………………. 330,500
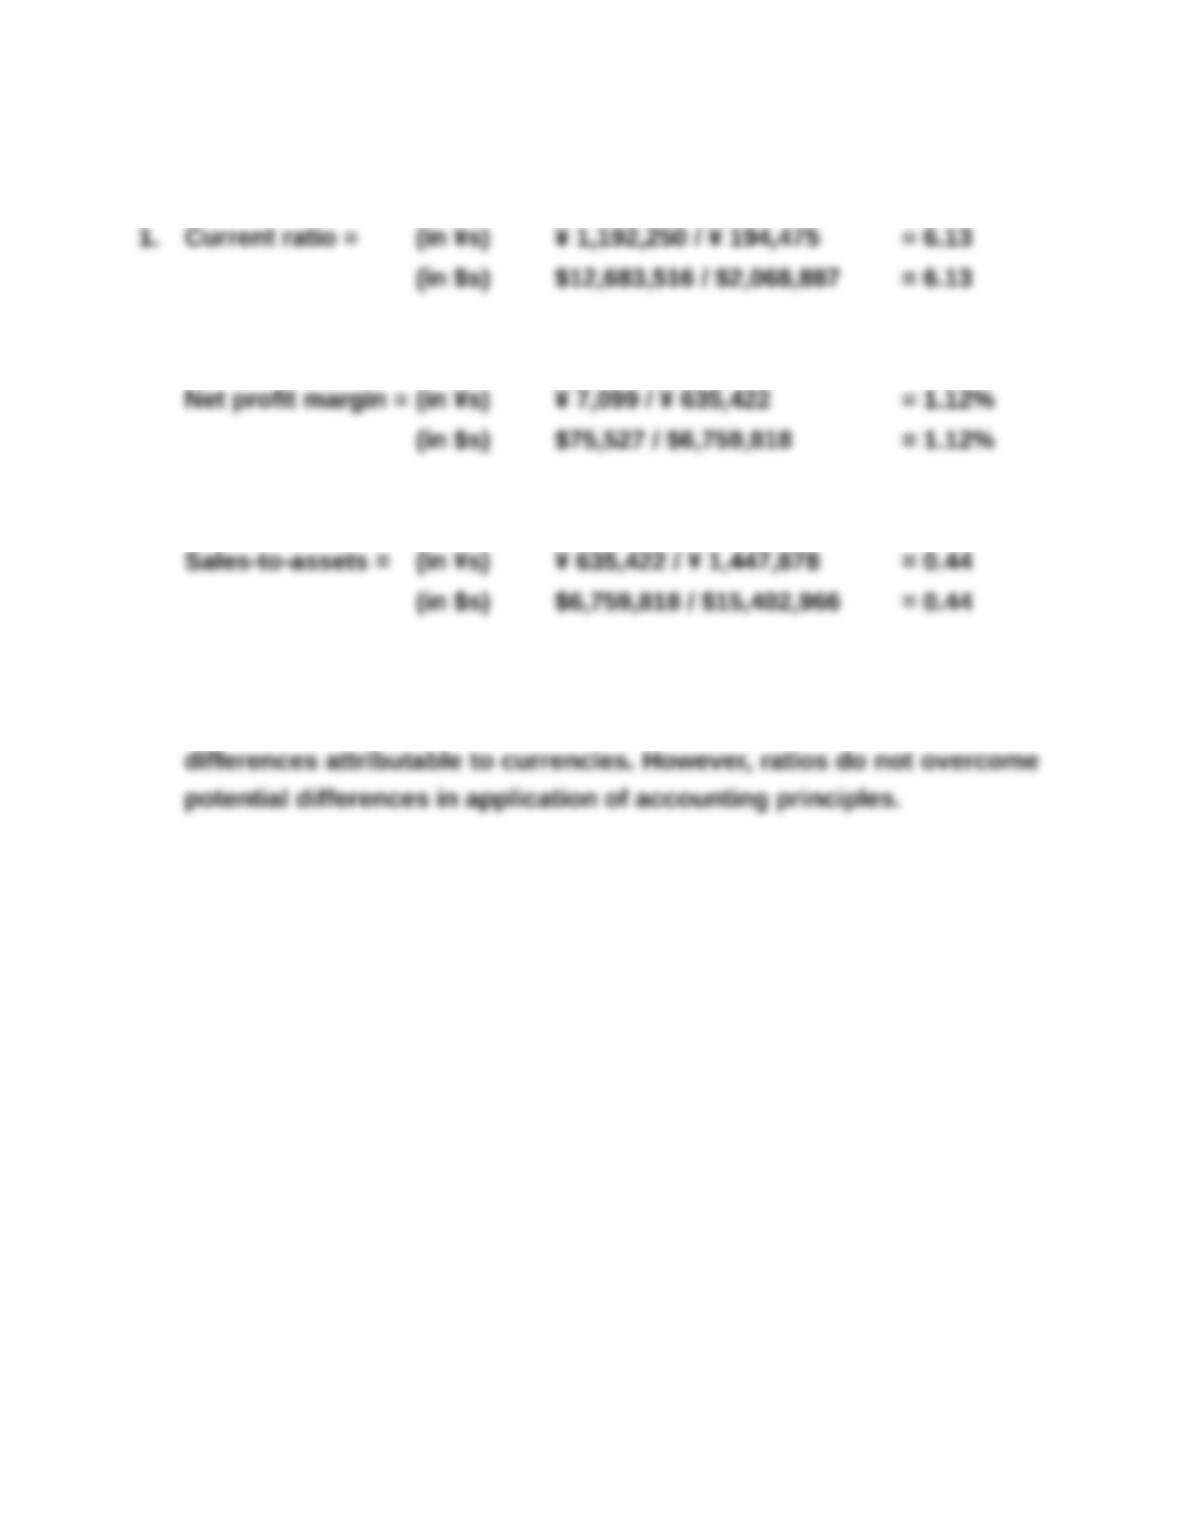
Exercise 17-15 (15 minutes)
2. The results in part 1 reveal that ratios can help us overcome
PROBLEM SET A
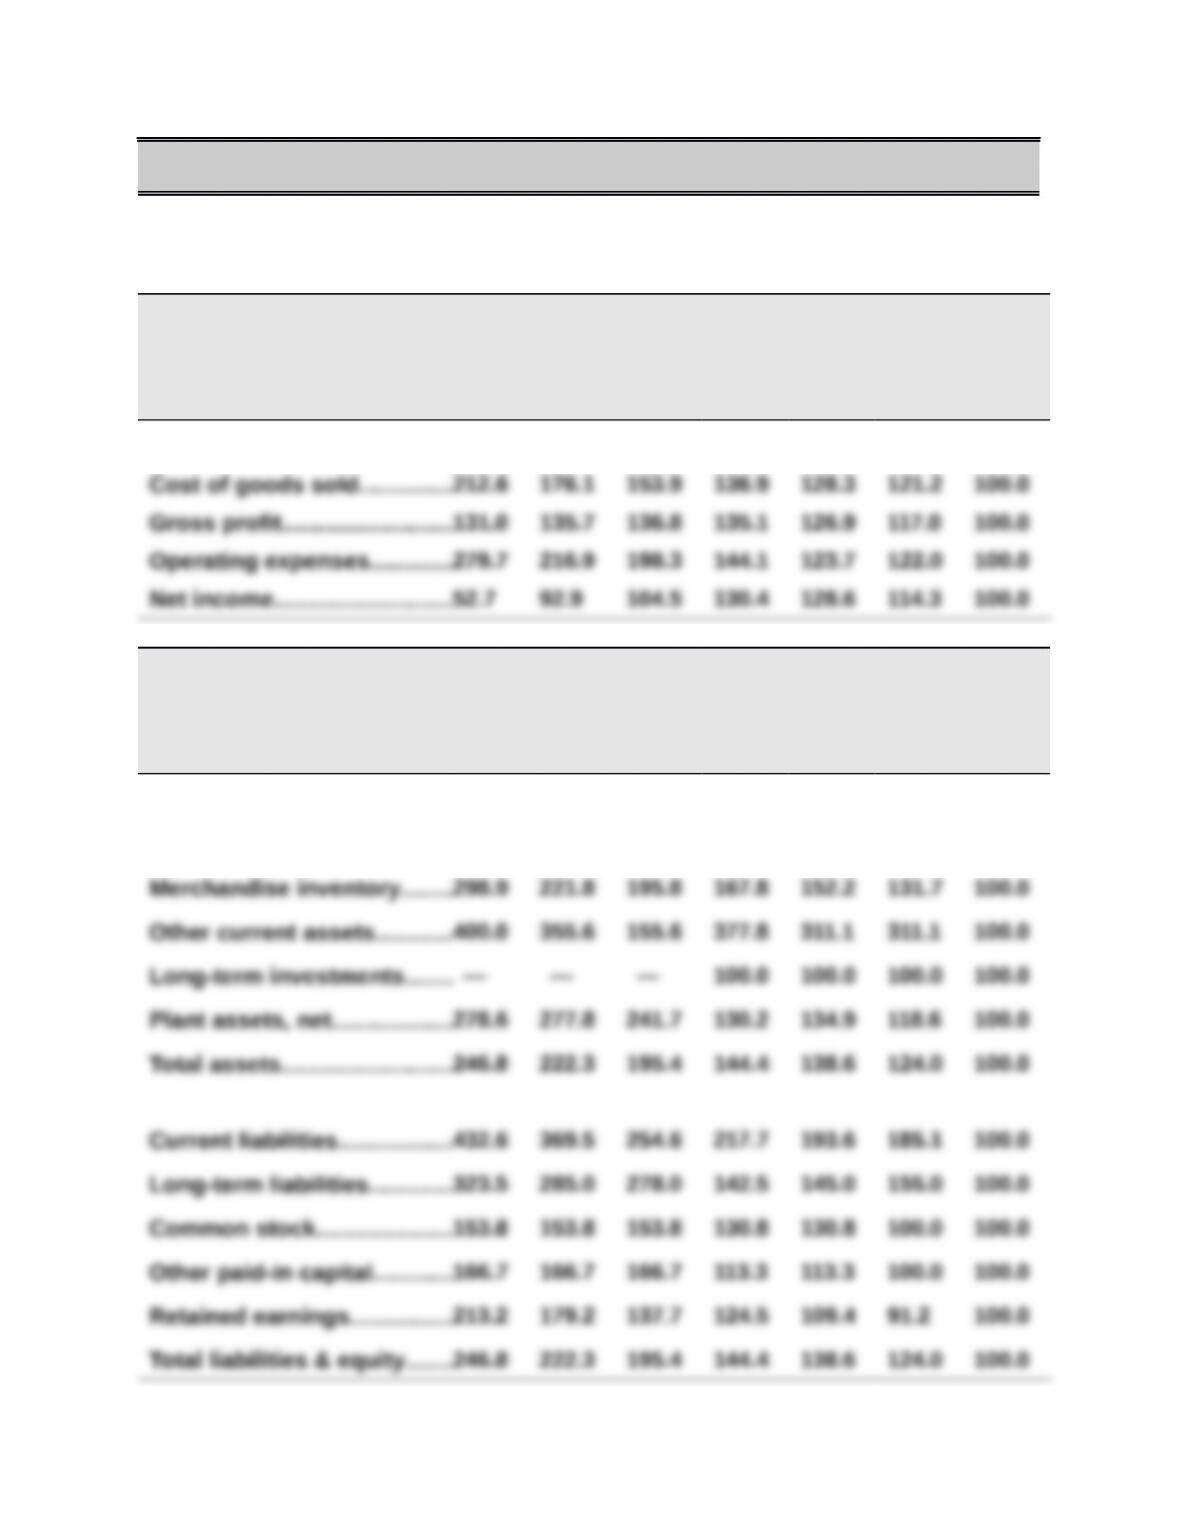
Problem 17-1A (120 minutes)
Part 1
HAROUN COMPANY
Income Statement Trends
For Years Ended December 31, 2015-2009
2015 2014 2013 2012 2011 2010 2009
Sales……………………………….
182.5% 161.2% 147.6% 136.2% 127.8% 119.6% 100.0%
HAROUN COMPANY
Balance Sheet Trends
December 31, 2015-2009
2015 2014 2013 2012 2011 2010 2009
Cash……………………………….65.2% 87.6% 92.1% 94.4% 98.9% 96.6% 100.0%
Accounts recble., net….......226.9 238.0 215.7 166.7 147.2 139.8 100.0
Problem 17-1A (concluded)
Part 2
Analysis and Interpretation
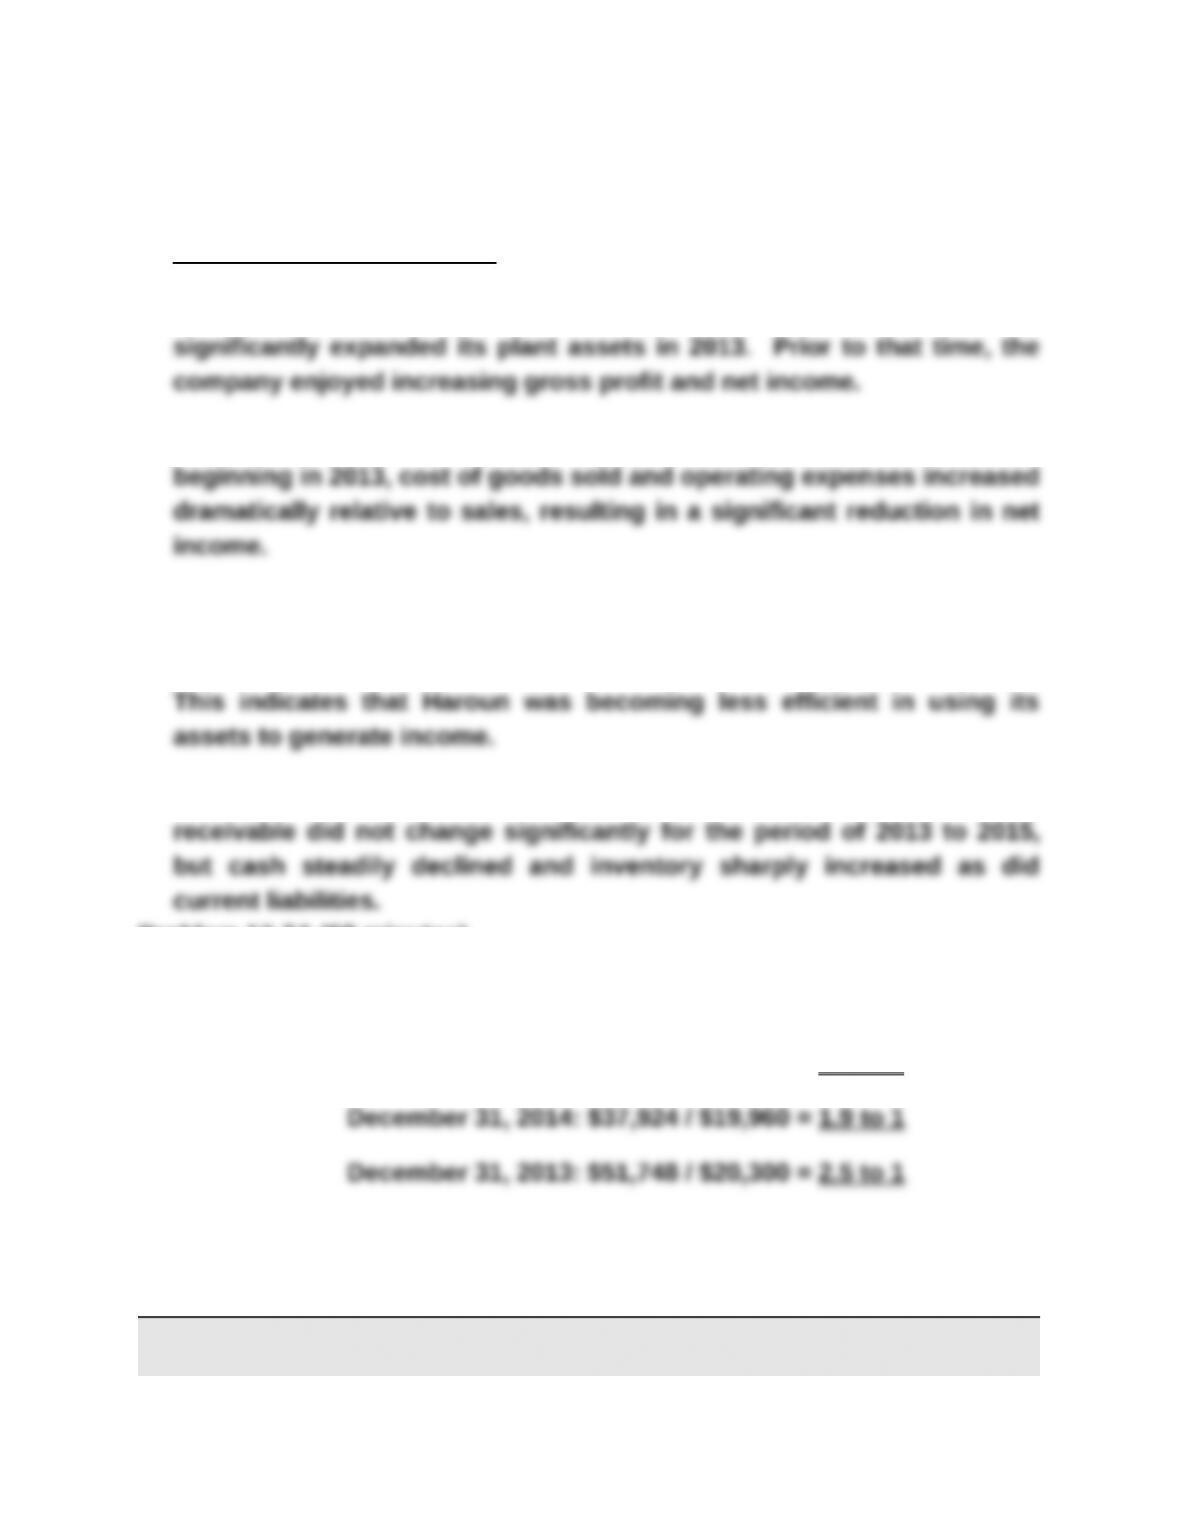
The statements and the trend percent data indicate that the company
Sales grew steadily for the entire period of 2009 to 2015. However,
In 2015, net income was only 52.7% of the 2009 base year amount.
At the same time that net income was declining, assets were increasing.
The short-term liquidity of the company continued to decline. Accounts
Problem 17-2A (60 minutes)
Part 1
Current ratio: December 31, 2015: $52,390 / $22,800 = 2.3 to 1
Part 2
KORBIN COMPANY
Common-Size Comparative Income Statements
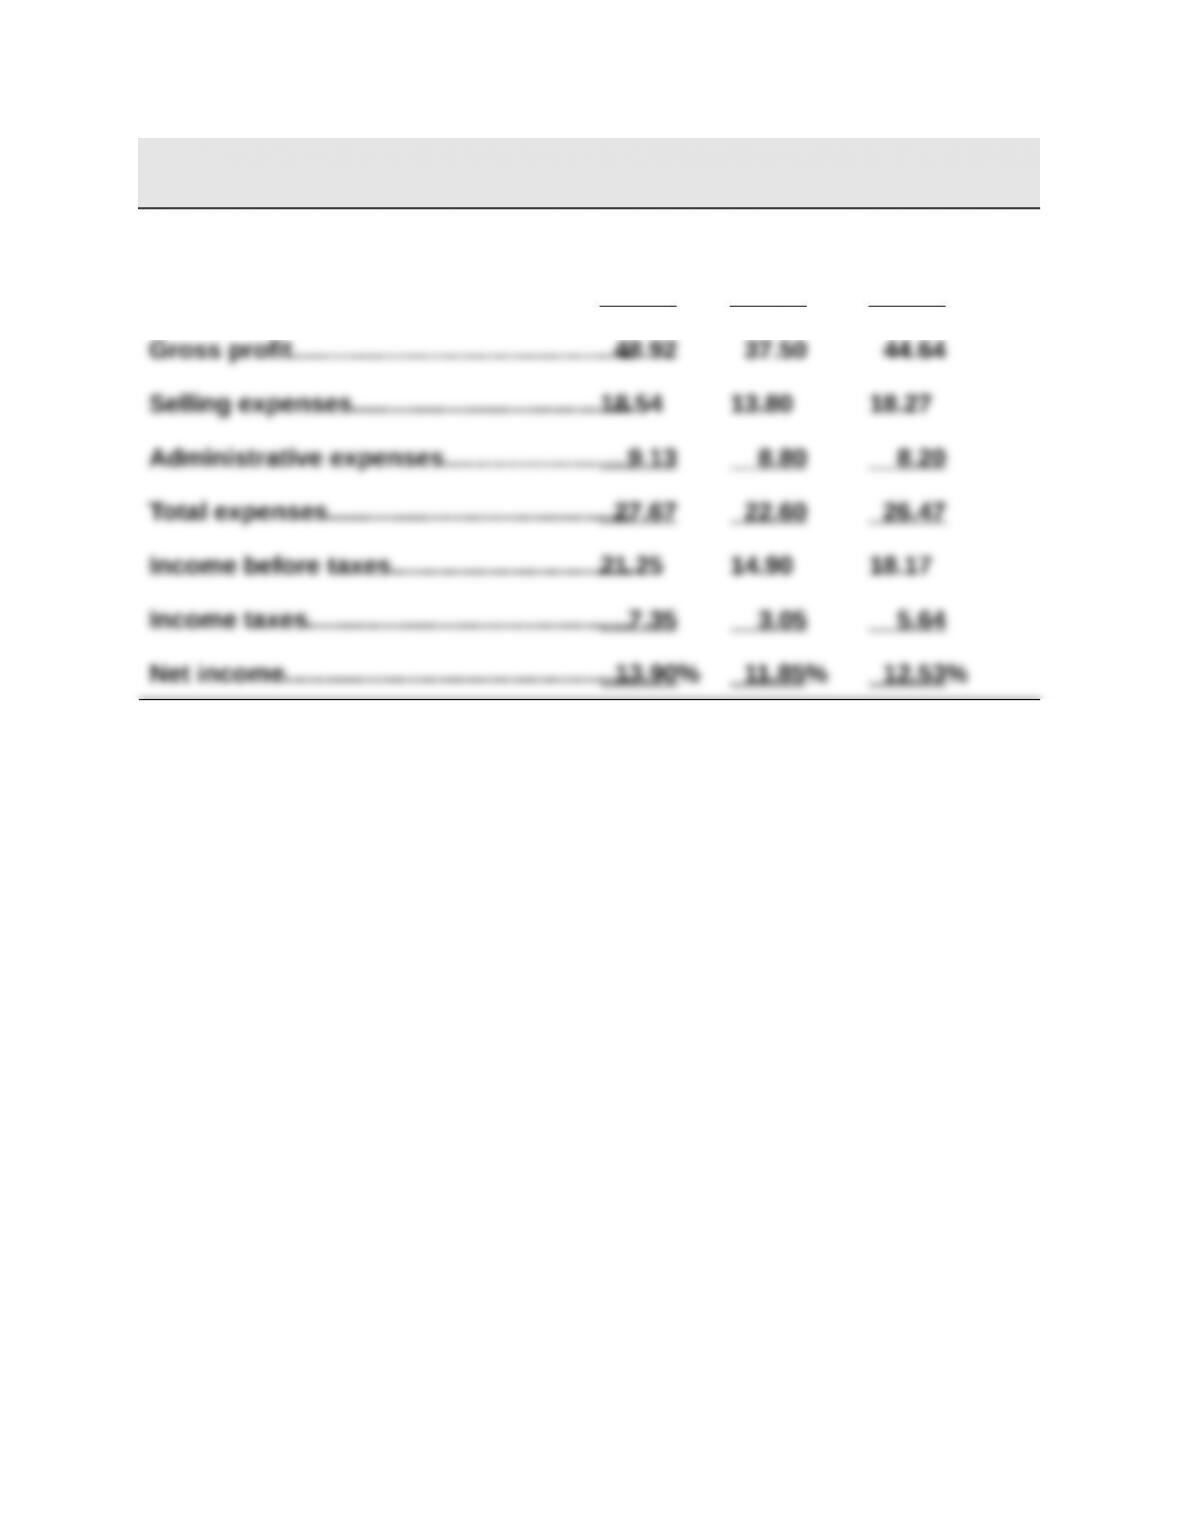
For Years Ended December 31, 2015, 2014, and 2013
2015 2014 2013
Sales………………………………………………….100.00% 100.00% 100.00%
Cost of goods sold……………………………… 51.08 62.50 55.36