Chapter 17 – Analysis of Financial Statements
Chapter 17
Analysis of Financial Statements
QUESTIONS
1. Financial reporting includes the entire process of preparing and issuing financial
2. With comparative statements, financial statement items for two or more successive
accounting periods are placed side by side on a single statement, with the change in
3. Total assets (or equivalently, the total of liabilities plus equity) are assigned a value of
100% on a common-size balance sheet. Net sales (revenues) are assigned a value of
100% on a common-size income statement.
4. The nature of a company’s business, the composition of its current assets, and the
5. A 2-to-1 current ratio may not be adequate if the company’s current assets consist of
6. Adequate working capital enables a company to carry sufficient inventories, meet
7. When evaluated in light of a company’s credit terms, the number of days’ sales
8. A high accounts receivable turnover implies that accounts are collected quickly,
17-963
Chapter 17 – Analysis of Financial Statements
9. Users are interested in the capital structure of a company, as measured by debt and
equity ratios, for at least two reasons. First, as a company includes more debt in its
10. Inventory turnover reflects on the efficiency of inventory management. That is, a
high inventory turnover means that a given sales volume can be supported with a
11. Since management is responsible for a company’s performance, all ratios that are
useful in evaluating a company are of some usefulness in assessing management
12. Almost all companies have some liabilities. Since total assets equals total liabilities
plus equity, total assets are almost always higher than common stockholders’ equity.
13. This gain is considered to be unusual but not infrequent. It would be included in the
14. Profit margin: Net Income / Sales ($ in millions)
15. Equity ratio: Total Equity / Total Assets ($ in millions)
2013: $87,309 / $110,920 = 78.7%
2012: $71,715 / $93,798 = 76.5%
16. Debt ratio: Total Liabilities / Total Assets ( in millions)₩
17. Return on total assets: Net Income / Average Total Assets ( in millions)₩
17-964
Chapter 17 – Analysis of Financial Statements
QUICK STUDY
Quick Study 17-1 (5 minutes)
is a. Income statement
is b. Balance sheet
Quick Study 17-2 (10 minutes)
Quick Study 17-3 (15 minutes)
2015 2014
Dollar
Change
Percent
Change
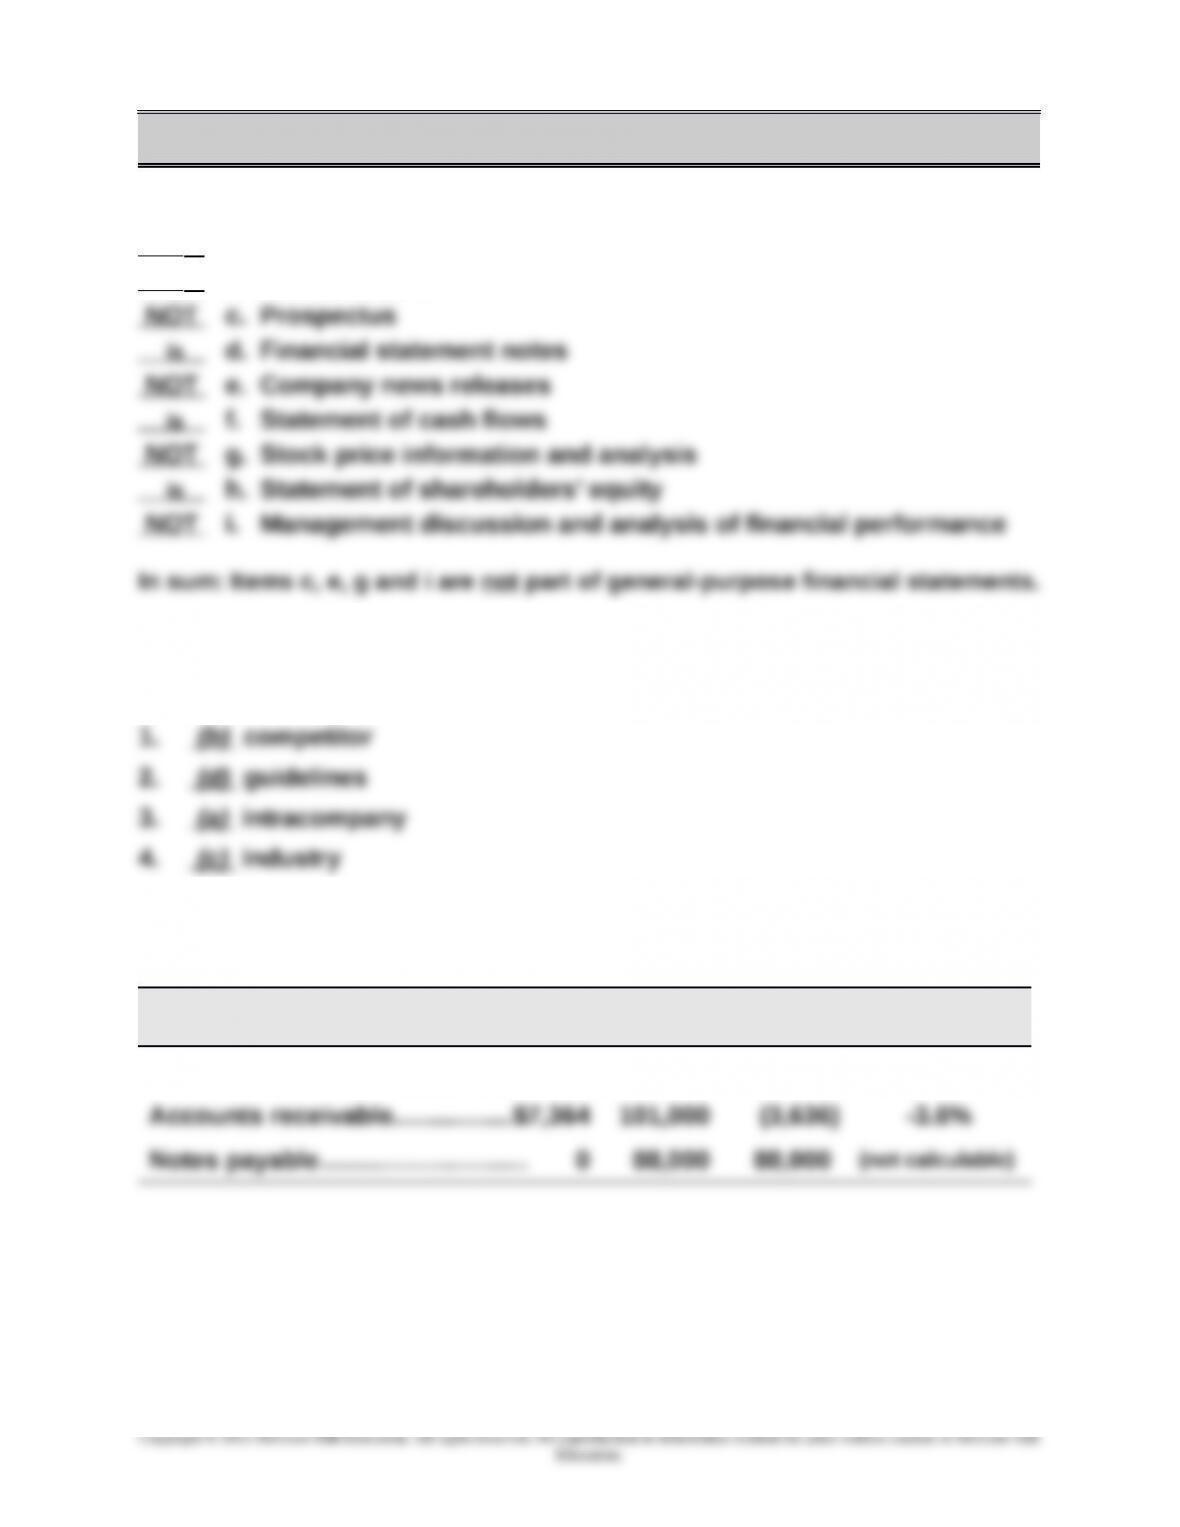
Short-term investments……..……$374,634 $234,000 $140,634 60.1%
17-965
Chapter 17 – Analysis of Financial Statements
Quick Study 17-4 (5 minutes)
Trend percents
Quick Study 17-5 (5 minutes)
Common-size percents
Quick Study 17-6 (10 minutes)
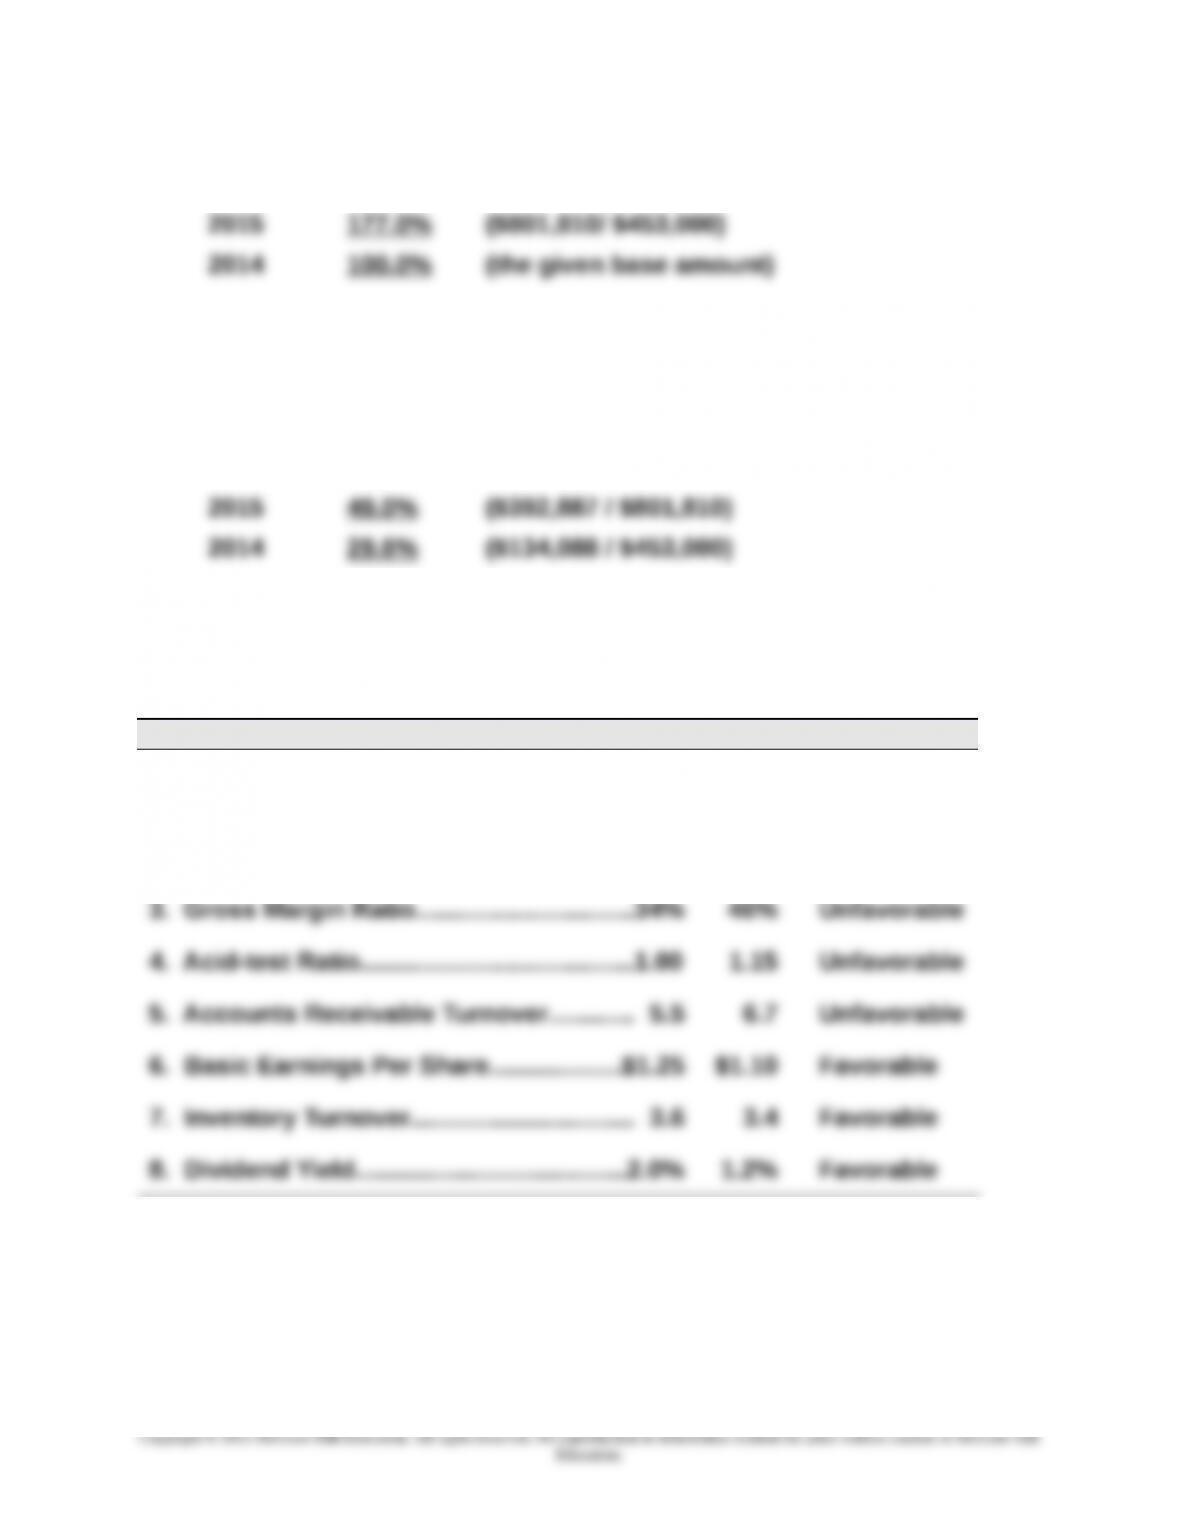
Ratio 2015 2014 Change
1. Profit Margin Ratio…………………..……… 9% 8% Favorable
2. Debt Ratio……………………..………………..47% 42% Unfavorable
17-966
Chapter 17 – Analysis of Financial Statements
Quick-Study 17-7 (30 minutes)
Parker has a greater amount of working capital. This by itself does not
indicate whether the company is more capable of meeting its current
This evidence also shows that Parker’s working capital, current ratio, and
acid-test ratio all increased dramatically over the three-year period. This
generating sales from available inventory. However, these statistics also
may suggest that Morgan is too conservative in granting credit and
investing in inventory. This could have a negative impact on sales and net
income. Parker’s ratios may be acceptable, but no definitive determination
can be made without having information on industry (or other competitors’)
standards.
Quick Study 17-8A (5 minutes)
This material error should be reported on the statement of retained
earnings (and/or the statement of stockholders’ equity) as a prior period
17-967
Chapter 17 – Analysis of Financial Statements
Quick Study 17-9 (10 minutes)
a. Although ratio analysis can eliminate currency differences, it cannot
eliminate differences in the application of GAAP under different
accounting systems. For example, if we compare the gross margin
Additional examples that are arguably even more problematic: (1)
Consider two companies, one reporting under U.S. GAAP and the other
under IFRS, which we are reviewing via the Operating Cash Flow /
Average Total Assets ratio. We can potentially see the dividends and the
interest items reported differently for these two companies under the
two different reporting regimes. That type of difference would persist
accounting systems.
b. A key advantage to using horizontal and vertical analyses when
examining companies reporting under different currencies is that the
EXERCISES
Exercise 17-1 (10 minutes)
17-968
Chapter 17 – Analysis of Financial Statements
Exercise 17-2 (5 minutes)
1. Profit Margin (f); Total Asset Turnover (e) –in either order
Return on Total Assets (d)
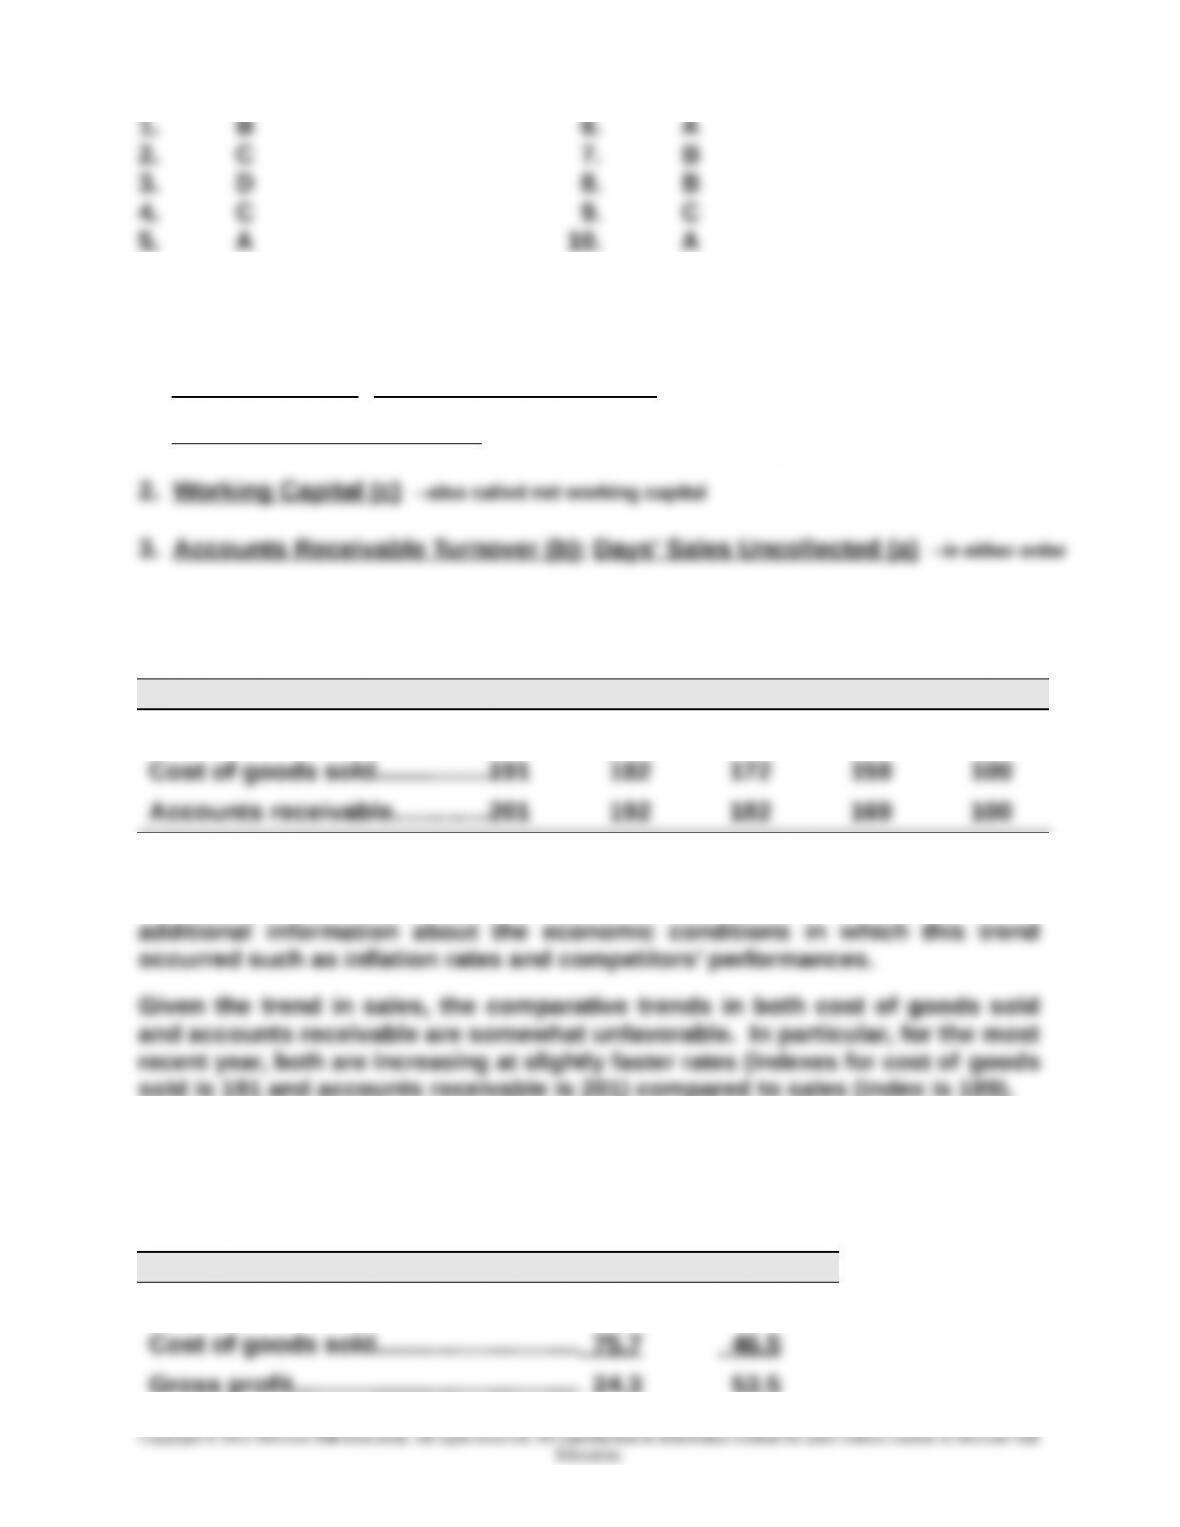
Exercise 17-3 (20 minutes)
2015 2014 2013 2012 2011
Sales…………………………..…..…189 181 168 156 100
Analysis: The trend in sales is positive. While this is better than no growth,
one cannot definitively say whether the sales trend is favorable without
sold is 191 and accounts receivable is 201) compared to sales (index is 189).
Exercise 17-4 (25 minutes)
2015 2014
Sales……………………..…..………………...100.0% 100.0%
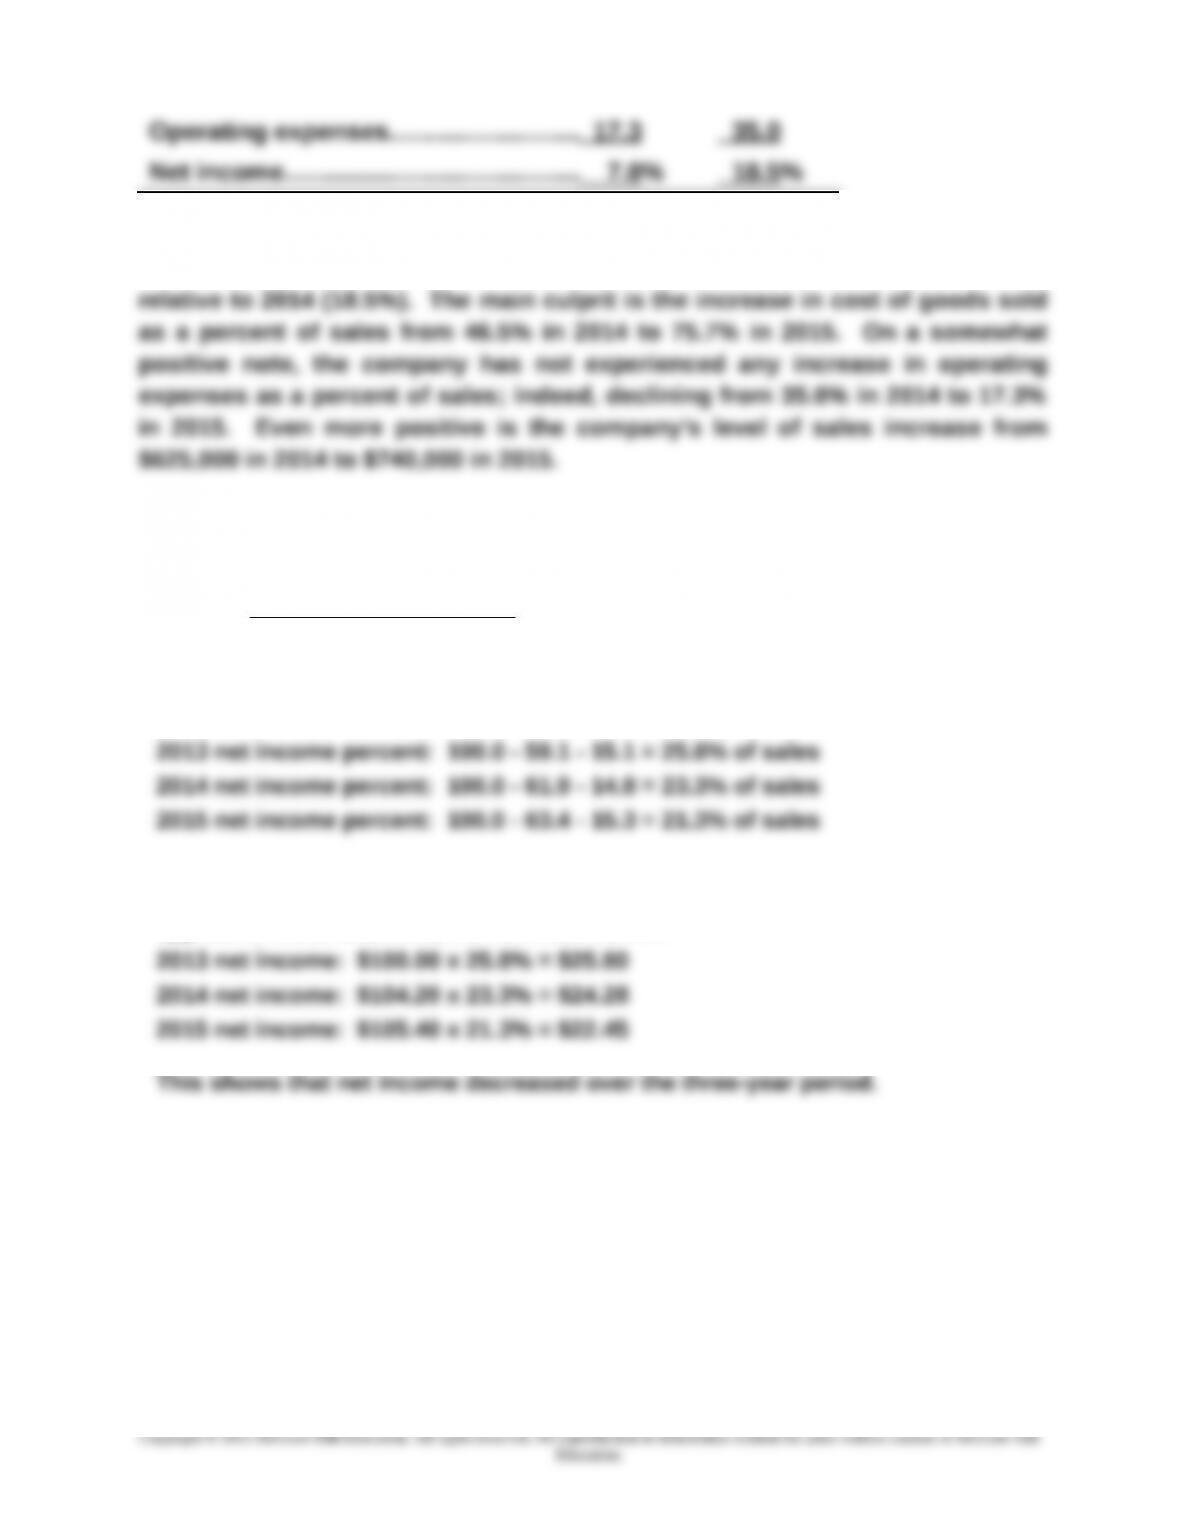
Gross profit………………….………………. 24.3 53.5
17-969
Chapter 17 – Analysis of Financial Statements
Analysis: Overall, this company’s situation has worsened. This is evident from
the substantial decline in net income as a percent of sales for 2015 (7.0%)
Exercise 17-5 (25 minutes)
Answer: Net income decreased.
Supporting calculations: When the sum of each year’s common-size cost of
goods sold and total expenses is subtracted from the common-size sales
percent, the net income percent is as follows:
Next, if 2013 sales are assumed to be $100, then sales for 2014 are $104.20 and
the sales for 2015 are $105.40. If the net income percents for the three years are
applied to these amounts, the net incomes are:
17-970
Chapter 17 – Analysis of Financial Statements
Exercise 17-6 (20 minutes)
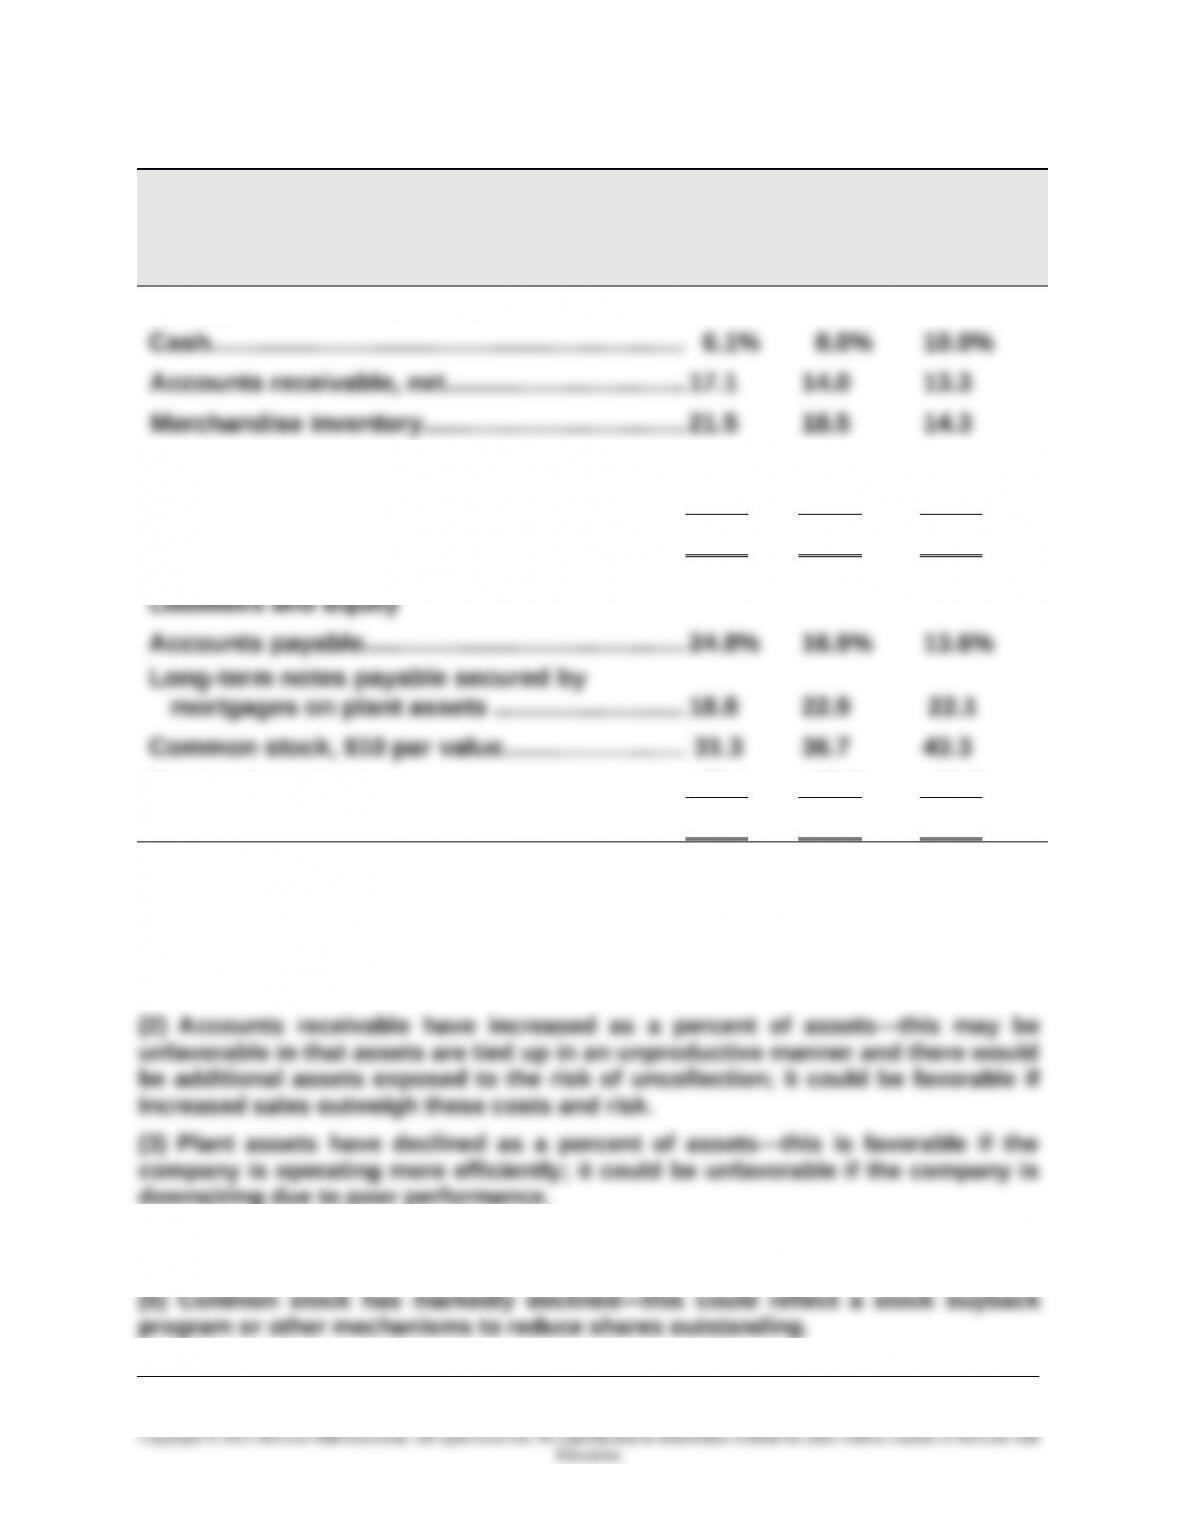
Simon Company
Common-Size Comparative Balance Sheets
December 31, 2013-2015
At December 31 2015 2014*2013
Assets
Prepaid expenses………………………..……..……… 2.0 2.1 1.3
Plant assets, net ………………….……………..…….. 53.3 57.3 61.1
Total assets ………………………………..……………..100.0% 100.0% 100.0%
Retained earnings ……………………..……………… 25.1 23.5 21.0
Total liabilities and equity………………….…..……100.0% 100.0% 100.0%
* Column does not equal 100.0 due to rounding.
Analysis: Several observations can be made.
(1) Cash as a percent of assets has declined—this is favorable provided sufficient
cash is available for operations.
downsizing due to poor performance.
(4) Accounts payable have markedly increased as a percent of assets—this could
reveal liquidity constraints.
17-971