Chapter 17 – Analysis of Financial Statements
CHAPTER 17
ANALYSIS OF FINANCIAL STATEMENTS
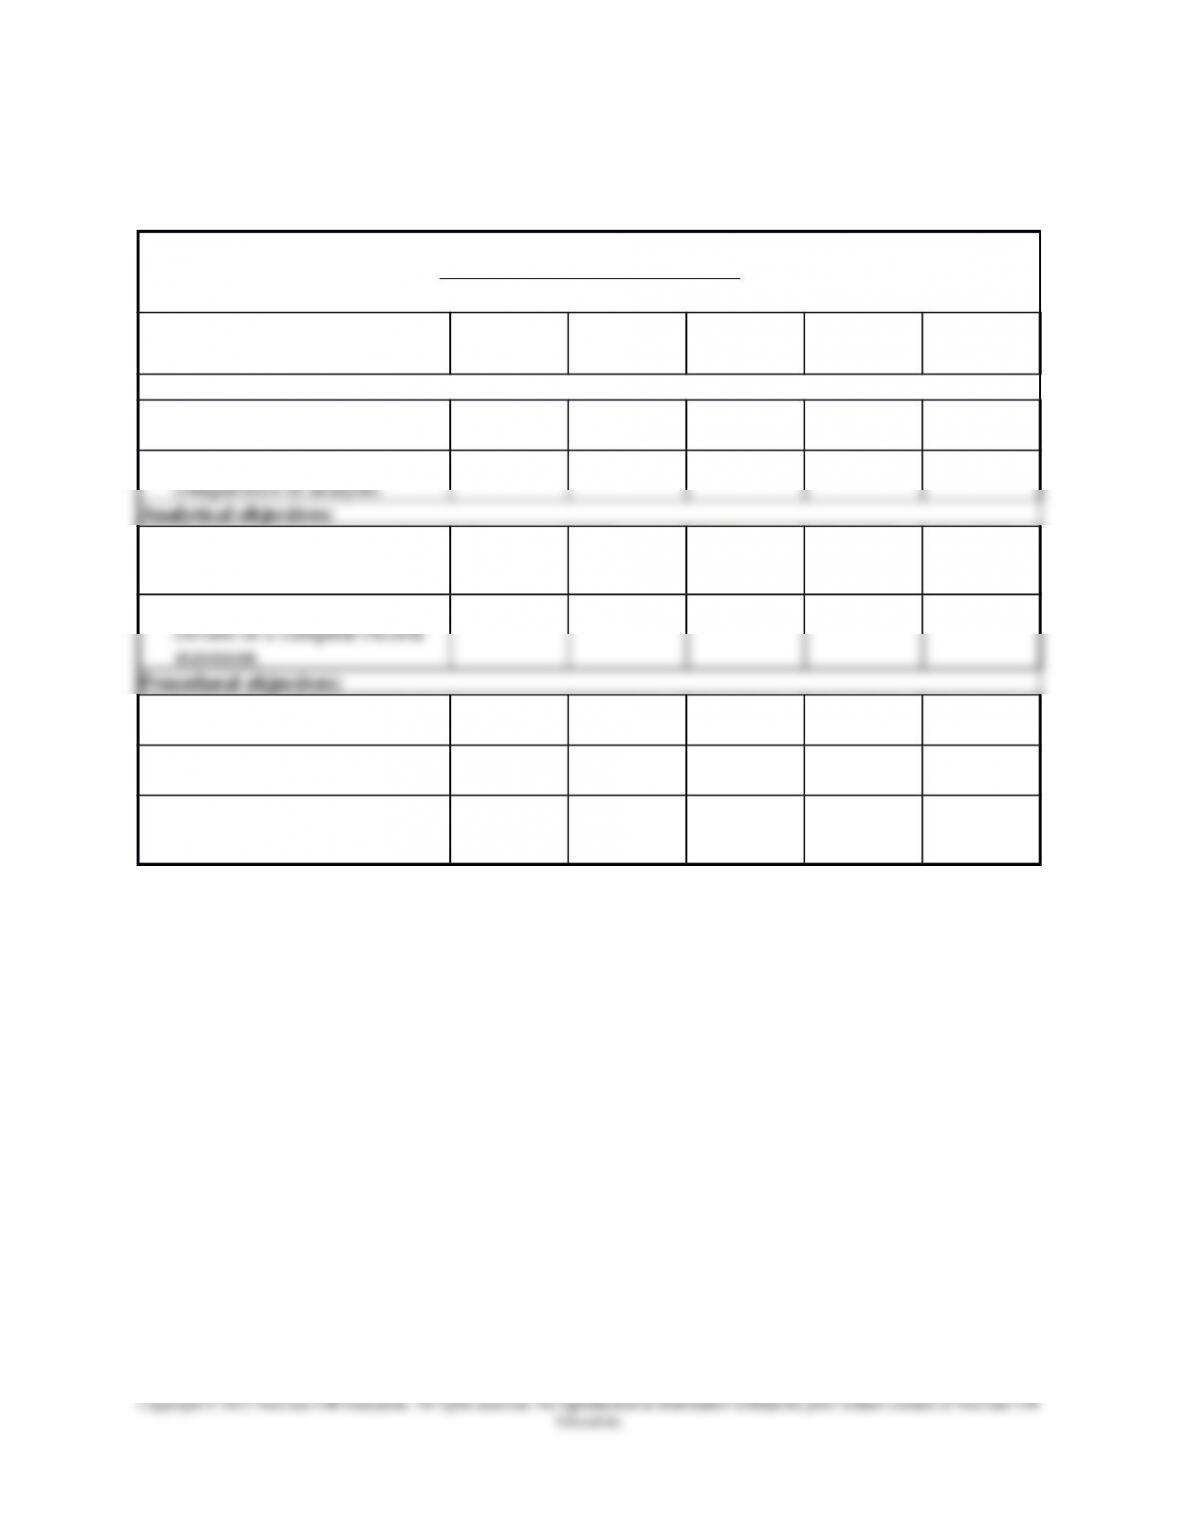
Related Assignment Materials
Student Learning Objectives Questions
Quick
Studies* Exercises* Problems*
Beyond the
Numbers
Conceptual objectives:
C1. Explain the purpose and identify
the building blocks of analysis.
1 17-1 17-1 17-8
C2. Describe standards for
2, 3 17-2, 17-9 17-2 17-2
A1 Summarize and report results of
analysis.
17 17-7 17-12 17-1, 17-5 17-1, 17-3,
17-4, 17-7,
17-9
A2A Explain the form and assess the
13 17-8 17-13, 17-14
17-6
P1. Explain and apply methods of
horizontal analysis.
17-3, 17-4 17-3, 17-5 17-1, 17-2 17-1, 17-6,
17-7
P2. Describe and apply methods of
vertical analysis.
17-5 17-4, 17-5,
17-6
17-2 17-1, 17-2,
17-6, 17-7
P3. Define and apply ratio analysis. 4, 5, 6, 7, 8, 9,
10, 11, 12,,
14,15, 16, 17
17-6 17-7, 17-8
17- 9, 17-10,
17-11, 17-15
17-2, 17-3,
17-4, 17-5
17-4, 17-5,
17-6, 17-7,
17-8
*See additional information on next page that pertains to these quick studies, exercises and problems.
17-1

Chapter 17 – Analysis of Financial Statements
Additional Information on Related Assignment Material
Corresponding problems in set B (in text), also relate to learning objectives identified in grid on
previous page. The Serial Problem for Success Systems continues in this chapter
Connect reproduces assignments online, in static or algorithmic mode, which allows instructors to
monitor, promote, and assess student learning. It can be used for practice, homework, or exams.
Synopsis of Chapter Revisions
Motley Fool: Revised opener with new entrepreneurial assignment
New companies –Apple, Google, and Samsung –throughout the chapter, exhibits, and
illustrations
New boxed discussion on the role of financial statement analysis to fight and prevent
fraud
Enhanced horizontal, vertical, ratio analysis using new companies and industry data
New analysis for segment data
17-2
Chapter 17 – Analysis of Financial Statements
Chapter Outline Notes
I. Basics of Analysis—Transforming data into useful
information.
A. Purpose of Analysis
To help users (both internal and external) make better business
decisions.
1. Internal users (managers, officers, internal auditors,
consultants, budget officers, and market researchers) make the
strategic and operating decisions of a company. Purposes for
these users is to provide strategic information to improve
company efficiency and effectiveness in providing products
and services.
2. External users (shareholders, lenders, directors, customers,
suppliers, regulators, lawyers, brokers, and the press) rely on
financial statement analysis to make decisions in pursuing
their own goals.
3. The common goal of all users is to evaluate:
a. Past and current performance.
b. Current financial position.
c. Future performance and risk.
B. Building Blocks of Analysis
The four areas of inquiry or building blocks are:
1. Liquidity and efficiency—ability to meet short-term
obligations and to efficiently generate revenues.
2. Solvency—ability to generate future revenues and meet long-
term obligations.
3. Profitability—ability to provide financial rewards sufficient to
attract and retain financing.
4. Market prospects—ability to generate positive market
expectations.
1. Income statement
2. Balance sheet
3. Statement of stockholders’ equity (or statement of retained
earnings)
4. Statement of cash flows
5. Notes related to the statements
6. Other useful financial data—10K/other SEC filings, news
17-3
Chapter 17 – Analysis of Financial Statements
Chapter Outline Notes
D. Standards for Comparisons
Used to determine if analysis measures suggest good, bad, or
average performance. Standards (benchmarks) can include the
following types of comparisons:
1. Intracompany—based on own prior performance and
relationships between its financial items.
2. Competitor—compared to one or more direct competitors.
(often best)
3. Industry—published industry statistics (available from
4. Guidelines (rules-of-thumb)—general standards developed
from experience.
E. Tools of Analysis
1. Horizontal analysis
2. Vertical analysis
3. Ratio analysis
II. Horizontal Analysis—Tool to evaluate changes in financial statement
data across time. This analysis utilizes:
A. Comparative Statements
1. Reports where financial amounts for more than one period are
placed side by side in columns on a single statement.
2. Dollar changes and percentage changes—usually shown in
line items.
a. Dollar change = Analysis period amount minus Base
period amount.
b. Percent change = (Analysis period amount minus Base
period amount) divided by Base period amount multiplied
by 100. Note:
(1) When a negative amount appears in the base period
and a positive amount in the analysis period (or vice
3. Comparative Balance Sheets—balance sheets from two or
more periods arranged side-by-side. Dollar and percentage
changes are often shown. Analysis focuses on large changes.
4. Comparative Income Statements—also compares two or more
17-4
Chapter 17 – Analysis of Financial Statements
Chapter Outline Notes
B. Trend analysis (also called trend percent analysis or index number
trend analysis)
1. A form of horizontal analysis used to reveal patterns in data
across successive periods.
2. Involves computing trend percents (or index number) as
3. Often aided by graphical depiction.
III. Vertical Analysis—(also called common-size analysis) Comparing
1. Base amount is commonly defined as 100%. Usually a key
2. Sum of individual items is 100%.
3. Common-size percentage equals (Analysis amount divided by
Base amounts) multiplied by 100.
B. Common-Size Graphics
1. Liquidity refers to the availability of resources to meet short-
term cash requirements.
2. Efficiency refers to how productive a company is in using its
assets. Efficiency is usually measured relative to how much
revenue is generated for a certain level of assets.
3. Ratios in this block:
a. Working capital—the excess of current assets less current
liabilities.
17-5
Chapter 17 – Analysis of Financial Statements
Chapter Outline Notes
d. Accounts receivable turnover—net sales or credit sales
divided by average accounts receivable; a measure of how
long it takes a company to collect its accounts.
e. Inventory turnover—cost of goods sold divided by
average inventory; the number of times a company’s
average inventory is sold during an accounting period.
f. Days’ sales uncollected—(accounts receivable divided by net
credit sales) multiplied by 365 days; measures how
frequently a company collects its accounts receivable.
g. Days’ sales in inventory—(ending inventory divided by
cost of goods sold) multiplied by 365; measures how
many days it will take to convert the inventory on hand at
the end of the period into accounts receivable or cash.
h. Total asset turnover—net sales divided by average total
assets; describes the ability to use assets to generate sales.
B. Solvency
1. Solvency refers to a company’s long-run financial viability and
2. Capital structure refers to a company’s sources of financing.
3. Ratios in this block:
a. Debt ratio—total liabilities divided by total assets.
b. Equity ratio—total stockholders’ equity divided by total
assets; compliment of debt ratio.
1. Profitability refers to a company’s ability to generate an
adequate return on invested capital.
2. Return is judged by assessing earnings relative to the level
and sources of financing.
3. Profitability is also relevant to solvency.
17-6
Chapter 17 – Analysis of Financial Statements
Chapter Outline Notes
4. Ratios in this block:
a. Profit margin—net income divided by net sales;
describes the ability to earn a net income from sales.
1. Market measures are useful for analyzing corporations with
publicly traded stock.
2. Market measures use stock price in their computation.
3. Ratios in this block:
a. Price-earnings ratio—market price per share of common
stock divided by earnings per share; used to evaluate the
profitability of alternative common stock investments.
17-7
1. Executive summary
2. Analysis overview
3. Evidential matter
4. Assumptions
5. Key factors
6. Inferences
VI. Sustainable Income—Appendix 17A—When a revenue and expense
transactions are from normal, continuing operations, a simple income
1. A business segment is a part of a company’s operations that
serves a particular line of business or class of customers.
2. Section reports:
a. Income (loss) from operating the discontinued business
1. An unusual gain or loss is abnormal or otherwise unrelated to the company’s regular
activities and environment.
2. An infrequent gain or loss is not expected to recur given the company’s operating
environment.
3. Items that are unusual or infrequent, but not both, are reported in the income statement as
1. Final section of income statement
2. Reports EPS for three subcategories of income (continuing operations, discontinued
segments, and extraordinary items). EPS discussed in chapter 13
17-8
Chapter 17 – Analysis of Financial Statements
Chapter Outline Notes
E. Changes in Accounting Principles
1. The consistency principle directs a company to apply the same
2. A footnote would describe change and why it is an
improvement.
3. Requires retrospective application (application of new
17-9