Chapter 3
2. Historical analysis helps decide for which financial statement items a percent-of-sales forecast
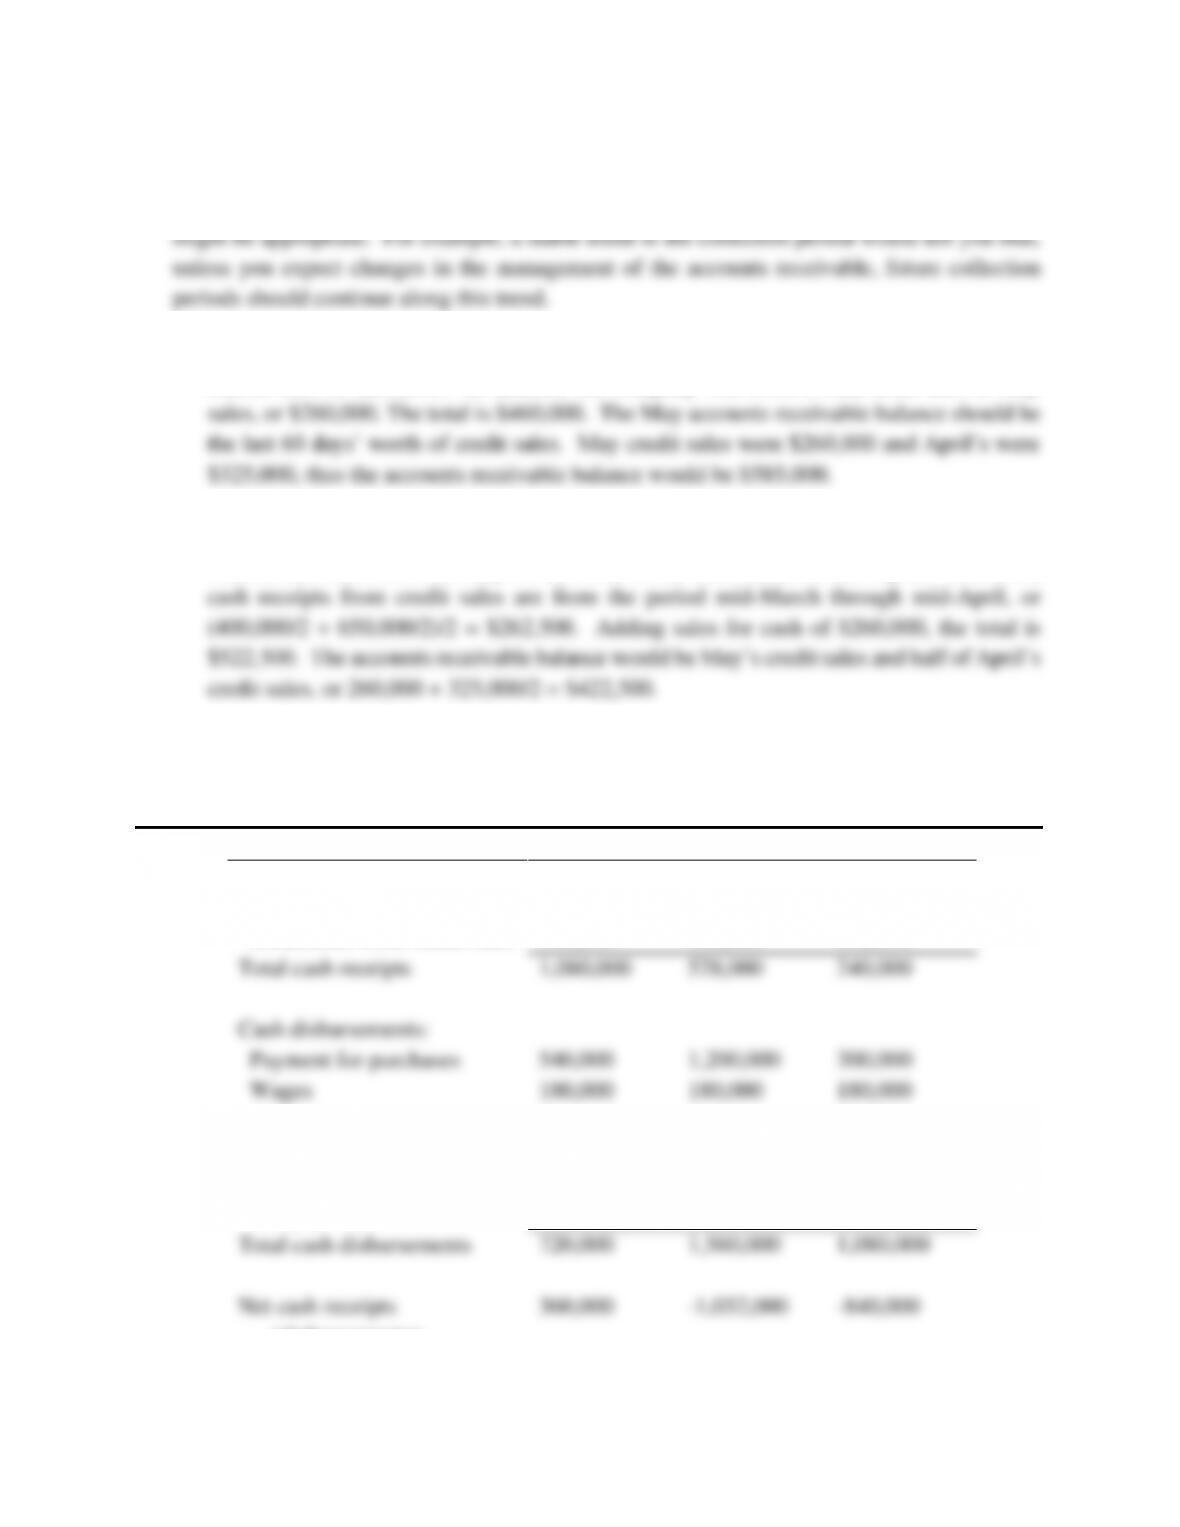
4. a. If the collection period is 60 days, May cash receipts from March sales will equal half of
March sales or $200,000. In addition the company will receive cash from half of May
b. With a 45-day collection period, cash collected on May 1 is from credit sales made in mid-
March, and collections on May 31 are from credit sales made in mid-April. Therefore,
6. New equity equation: = C37 + D28. New net sales equation: = C19 + C19*D4.
8. Westmark Cash Budget for First Three Months of 2015
January
February
March
Cash receipts:
Sales for cash
$120,000
$48,000
$48,000
Collections from credit sales
960,000
480,000
192,000
Total cash receipts
1,080,000
528,000
240,000
Cash disbursements:
Payment for purchases
540,000
1,200,000
300,000
Wages
180,000
180,000
180,000
Interest payments
0
0
90,000
Principal payments
0
0
210,000
Dividends
0
0
300,000
Tax payments
0
180,000
0
Total cash disbursements
720,000
1,560,000
1,080,000
Net cash receipts
(disbursements)
360,000
-1,032,000
-840,000
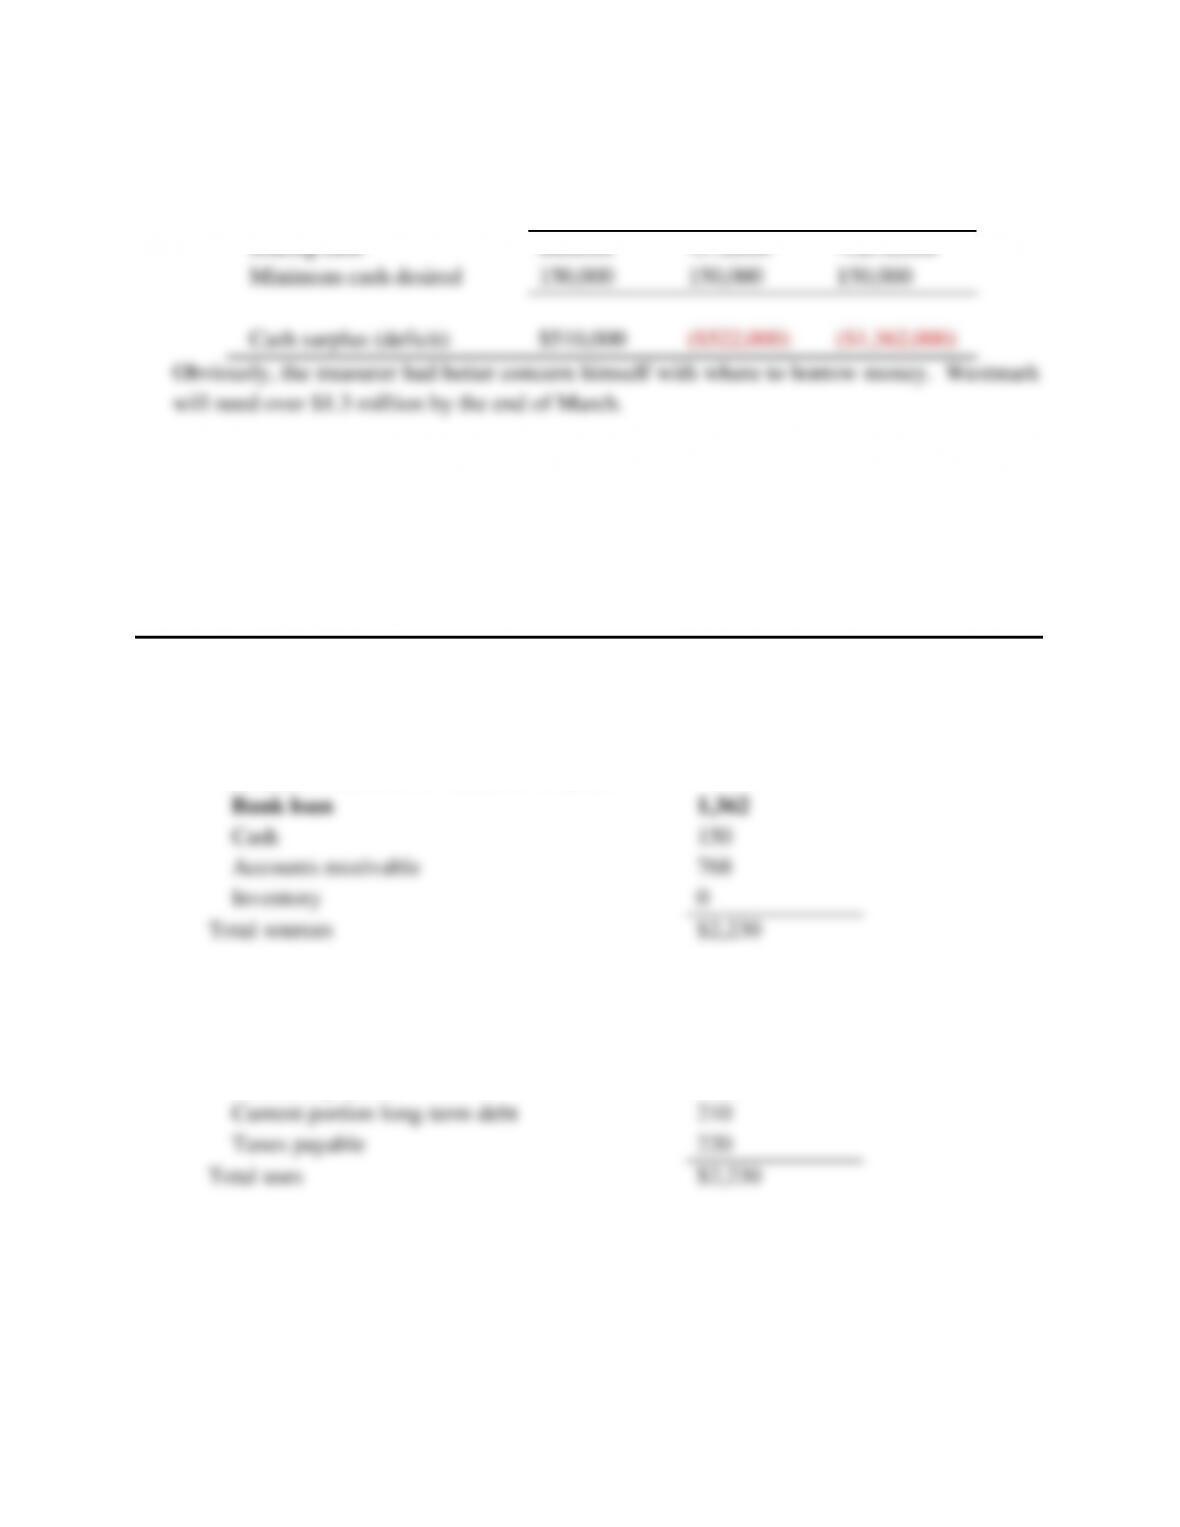
Determination of cash needs:
Beginning cash
300,000
660,000
-372,000
Net receipts (disbursements)
360,000
-1,032,000
-840,000
Ending cash
660,000
-372,000
-1,212,000
Minimum cash desired
150,000
150,000
150,000
Cash surplus (deficit)
$510,000
($522,000)
($1,362,000)
10.
Westmark Industrial, Inc.
Cash Flow Forecast
1st Quarter 2015
($ thousands)
Sources of cash
Cash from operations:
Profit after tax
($80)
Depreciation
30
Increase in liabilities or reduction in assets:
Bank loan
1,362
Cash
150
Accounts receivable
768
Inventory
0
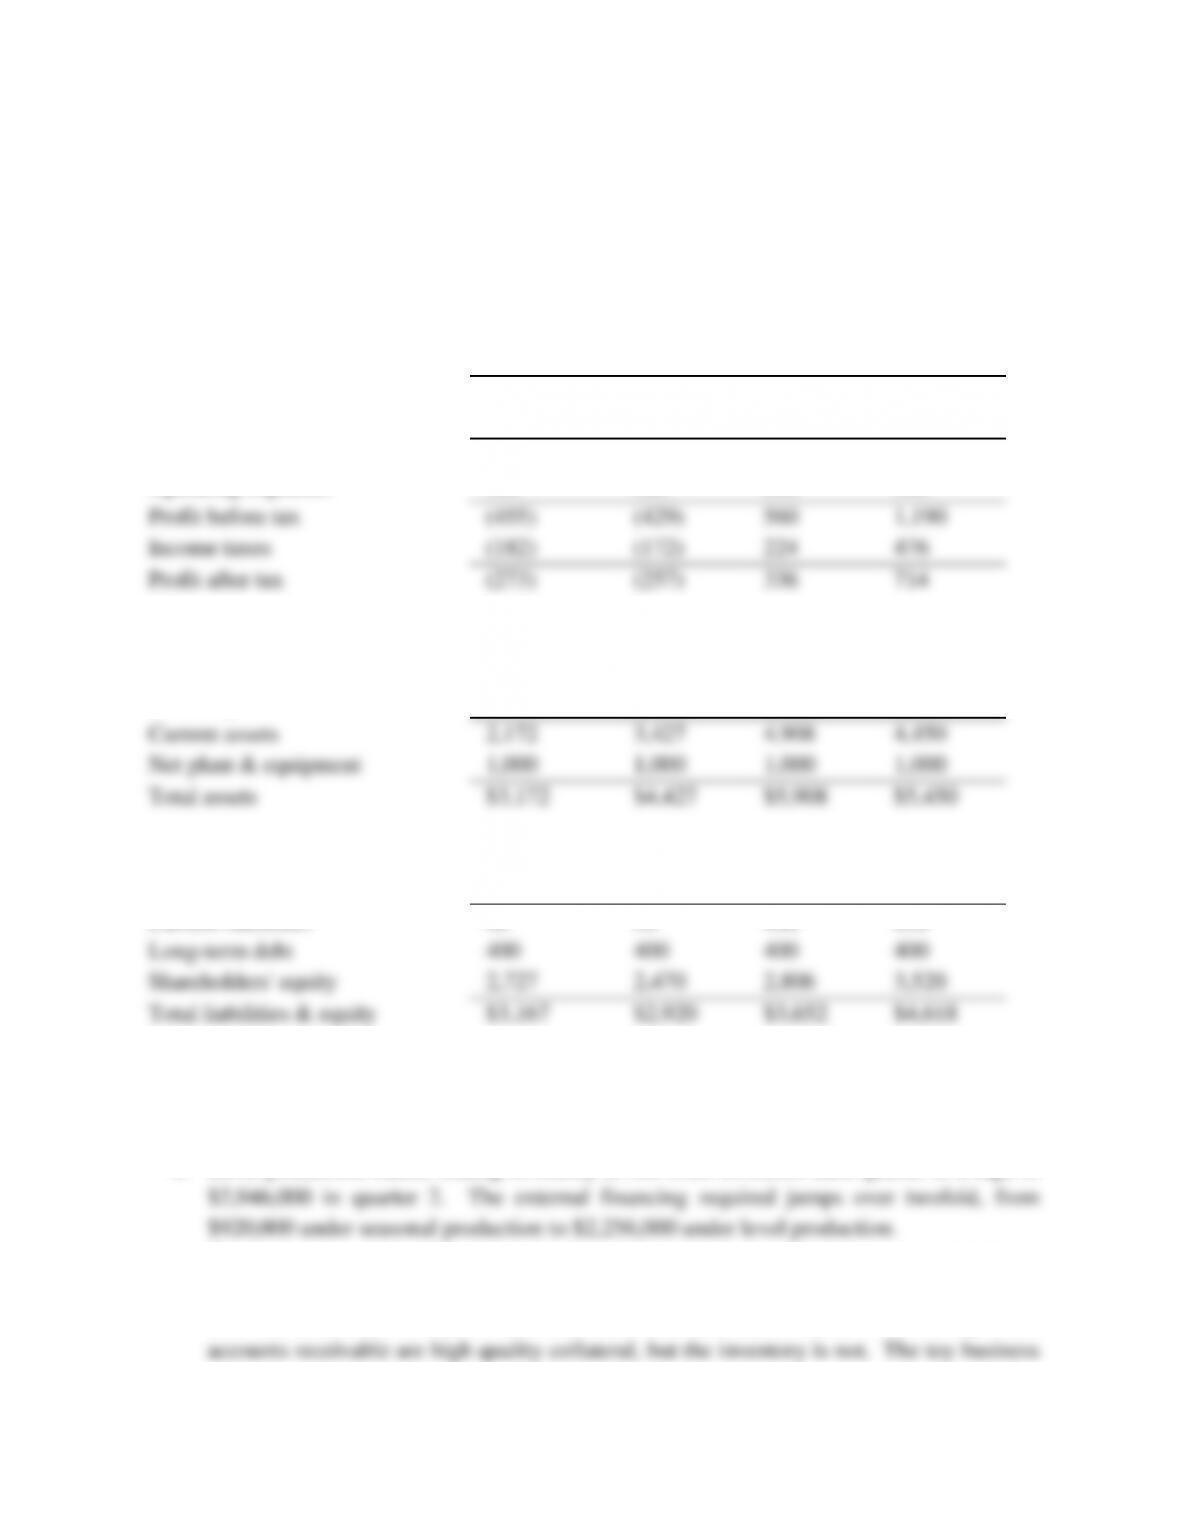
Total sources
$2,230
Uses of cash:
Dividends
$300
Decreases in liabilities or increases in assets:
Accounts payable
1,500
Current portion long-term debt
210
Taxes payable
220
Total uses
$2,230
12. a.
Toys-4-Kids
2015 Quarterly Pro Forma Forecast
Assuming Level Production
($000 thousands)
Qtr 1
Qtr 2
Qtr 3
Qtr 4
Net sales
$300
$375
$3,200
$5,000
Cost of sales
195
244
2,080
3,250
Gross profit
105
131
1,120
1,750
Operating expenses
560
560
560
560
Profit before tax
(455)
(429)
560
1,190
Income taxes
(182)
(172)
224
476
Profit after tax
(273)
(257)
336
714
Cash
$200
$200
$200
$200
Accounts receivable
225
281
2,400
3,750
Inventory
1,747
2,946
2,308
500
Current assets
2,172
3,427
4,908
4,450
Net plant & equipment
1,000
1,000
1,000
1,000
Total assets
$3,172
$4,427
$5,908
$5,450
Accounts payable
$222
$222
$222
$222
Accrued taxes
(182)
(172)
224
476
Current liabilities
40
50
446
698
Long-term debt
400
400
400
400
Shareholders’ equity
2,727
2,470
2,806
3,520
Total liabilities & equity
$3,167
$2,920
$3,652
$4,618
External financing required
$5
$1,507
$2,256
$832
b. Profits more than double, from $253,000 to $520,000. (Remember, this ignores the
increase in interest expense due to increased borrowing.)
c. Level production causes ending inventory to rise from $500,000 each quarter to a high of
d. The company may be able to borrow the needed money, but the decision is not obvious.
The maximum loan need of $2.3 million occurs in quarter 3. Possible collateral at that
time includes $2.4 million in accounts receivable and $2.3 million in inventory. The
borrowing needs are much larger, and the company incurs serious obsolescence risks. The
choice is not an easy one.
A possible intermediate strategy is to move to quasi-level production, producing stable
items for inventory early in the year and fad items for immediate sale later. This enables
14. See Excel solutions at mhhe.com/higgins11e.