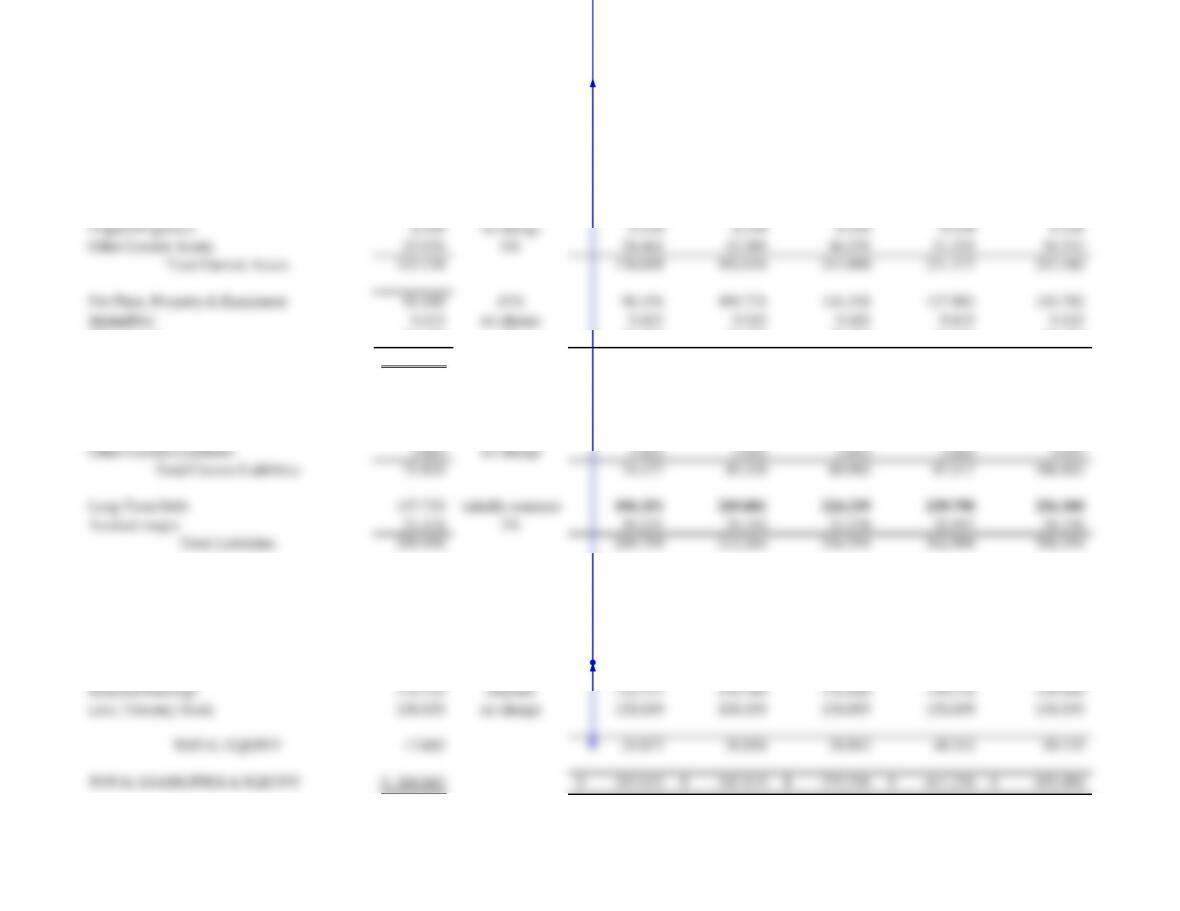
Balance Sheet (in $ millions)
ASSETS
Cash & Equivalents 7.152$ 2%
12.821 14.103 15.513 17.064 18.771
Account Receivable 70.538 13% 83.335 91.668 100.835 110.919 122.011
Inventories 39.033 5% 32.052 35.257 38.783 42.661 46.927
Prepaid Expenses 9.339 no change 9.339 9.339 9.339 9.339 9.339
Other Current Assets 27.076 6% 38.462 42.309 46.539 51.193 56.313
Total Current Assets 153.138 176.009 192.676 211.010 231.177 253.360
Net Plant, Property & Equipment 81.648 15% 96.156 105.771 116.348 127.983 140.782
Intangibles 9.415 no change 9.415 9.415 9.415 9.415 9.415
Other Assets 24.642 5% 32.052 35.257 38.783 42.661 46.927
Other Current Liabilities 3.663 no change 3.663 3.663 3.663 3.663 3.663
Total Current Liabilities 71.820 74.177 81.229 88.985 97.517 106.903
Long Term Debt 157.720 initially constant
196.351 209.881 224.339 239.790 256.300
Accrued wages 21.418 3% 19.231 21.154 23.270 25.597 28.156
Total Liabilities 250.958 289.759 312.264 336.594 362.904 391.359
Retained Earnings 118.729
so all income is
retained
124.717 131.700 139.806 149.176 159.969
Less: Treasury Stock 158.059 no change 158.059 158.059 158.059 158.059 158.059
TOTAL EQUITY 17.885 23.873 30.856 38.962 48.332 59.125
TOTAL LIABILITIES & EQUITY 268.843$ 313.632$ 343.119$ 375.556$ 411.236$ 450.484$
Chapter 3 Problem 14
a
b
c
d
Noble Selected Information and Financial Statements
Sales (20 percent for cash, the rest on 30-day credit terms):
2014 Actual 2014 Projected
July August September October
November December
76,000 88,000 266,000 125,000 51,000 53,000
Purchases (all on 60-day terms):
2014 Actual 2014 Projected
July August September October
November December
116,000 122,000 257,000 62,000 27,000 26,000
Salaries payable monthly 20,000
Principal payment on debt due in December 25,700
Interest due in December 9,000
Dividend payable in December 15,000
Taxes payable in November 19,000
Addition to accumulated depreciation in December 4,000
Cash balance on October 1, 2014 34,000
Minimum desired cash balance 15,000
Noble’s annual income statement and balance sheet for September 30, 2014 appear below.
Additional information about the company‘s accounting methods and expectations for
the last three months of 2014 appear in the footnotes.
Noble
Annual Income Statement
Fiscal Year ended September 30, 2014 ($ 000)
Net sales 1,581.6
Cost of goods sold11,098.0
Gross profits 483.6
Selling and administrative expenses
240.0
Interest expense 18.0
Depreciation316.0
Using the information provided, construct a monthly cash budget for October through December 2014. Based on your analysis,
will Noble enjoy a surfeit of cash, or require external financing?
Construct a pro forma income statement for the first fiscal quarter of 2015 and a pro forma balance sheet as of December 31,
2014. What is your estimated external financine needed for December 31?
Does the December 31, 2014, estimated external financing equal your cash surplus (deficit) for this date from your cash budget?
Based on your answers above, construct a cash flow forecast for Noble for the period October through December 2014.
Noble
Balance Sheet
September 30, 2014 ($ 000)
Assets
Cash 34.0
Accounts receivable
212.8
Inventory 425.0
Total current assets 671.8
Gross fixed assets 135.0
Accumulated depreciation 52.0
Net fixed assets 83.0
Total assets 754.8
Liabilities
Bank loan 0.0
Accounts payable 379.0
Accrued expenses455.0
Current portion long-term debt525.7
Taxes payable 56.0
Total current liabilities 515.7
Long-term debt 120.0
Shareholders’ equity
119.1
Total liabilities and equity 754.8
1. Cost of goods sold consists entirely of items purchased during the quarter.
2. Selling and administrative expenses consist entirely of salaries.
3. Depreciation is straight-line at the rate of $4,000 per quarter.
4. Accrued expenses are not expected to change in the last quarter.
5. $25.7 due December 2014. No payments for remainder of year.
Chapter 3 Problem 14 Suggested Ansewrs
a. Noble Cash Budget for Last Three Months of 2014
October November December
Cash receipts:
Sales for cash $25,000 $10,200 $10,600
Collections from credit sales 212,800 100,000 40,800
Total cash receipts 237,800 110,200 51,400
Cash disbursements:
Payment for purchases 122,000 257,000 62,000
Salaries 20,000 20,000 20,000
Interest payments – – 9,000
Principal payments – – 25,700
Dividends – – 15,000
Tax payments – 19,000 –
Total cash disbursements 142,000 296,000 131,700
Net cash receipts (disbursements) 95,800 (185,800) (80,300)
Cash surplus (deficit) 114,800 (71,000) (151,300)
Noble will need $151,300 in external financing by the end of December.
Noble
Noble
Balance Sheet
December 31, 2014
($ thousands)
Assets
Cash
$ 15.0
Accounts receivable
42.4
Inventory
425.0
Total current assets
482.4
Gross fixed assets
135.0
– Accumulated depreciation
56.0
Net fixed assets
79.0
Total assets
$ 561.4
Liabilities
Bank loan
151.3
Accounts payable
53.0
Miscellaneous accruals
55.0
Current portion long-term debt
–
Taxes payable
50.5
Total current liabilities
309.8
Long-term debt
120.0
131.6
Total liabilities & equity
561.4
Inventory is estimated as follows:
Beginning inventory Oct. 1.
$425.0
+ 1st quarter purchases
441.0
– 1st quarter cost of goods sold
441.0
Ending inventory December 31
425.0
Taxes payable are estimated as follows:
Taxes payable Sept. 30, 2014
56.0
19.0
+ 1st quarter taxes accrued
13.5
Taxes payable December 31
$50.5
a. Noble will require $151,300 at the end of the year.
b. $151,300.
c. Yes, they are the same. Whew!
d. Noble
Cash Flow Forecast
Last three months 2014
($ thousands)
Sources of cash
Cash from operations:
Profit after tax
$ 27.5
Depreciation
4.0
Increase in liabilities or reduction in assets:
Bank loan 151.3 This is the “plug.”
Cash
19.0
Accounts receivable
170.4
Inventory
–
Total sources
$ 372.2
Uses of cash:
Dividends
15.0
Decreases in liabilities or increases in assets:
Accounts payable
326.0
Current portion long-term debt
25.7
Taxes payable
5.5
Total uses
$ 372.2
Chapter 3 Problem 15 Suggested Answers
Spreadsheet Answer to Problem 7: a). Results of Simulation:
Facts and Assumptions
Year 2014 2015 2016
Net sales 20,613$
Growth rate in sales 25% 30%
Cost of goods sold/net sales 86% 86%
Gen., sell,, and admin. expenses/net sales 12% 11%
Long-term debt 760$ 660$ 560$
Current portion long-term debt 100$ 100$ 100$
Interest rate 10% 10%
Tax rate 45% 45%
Dividend/earnings after tax 50% 50%
Current assets/net sales 29% 29%
Net fixed assets 280$ 270$
Current liabilities/net sales 14.5% 14.4%
Owners‘ equity 1,730$
INCOME STATEMENT
Year 2014 2015 2016
Net sales 25,766$ 33,496$
Cost of good sold 22,159 28,807
Gross profit 3,607 4,689
Gen., sell,, and admin. exp. 3,092 3,685
Interest expense 231 327
Earnings before tax 285 678
Tax 128 305
Earnings after tax 156 373
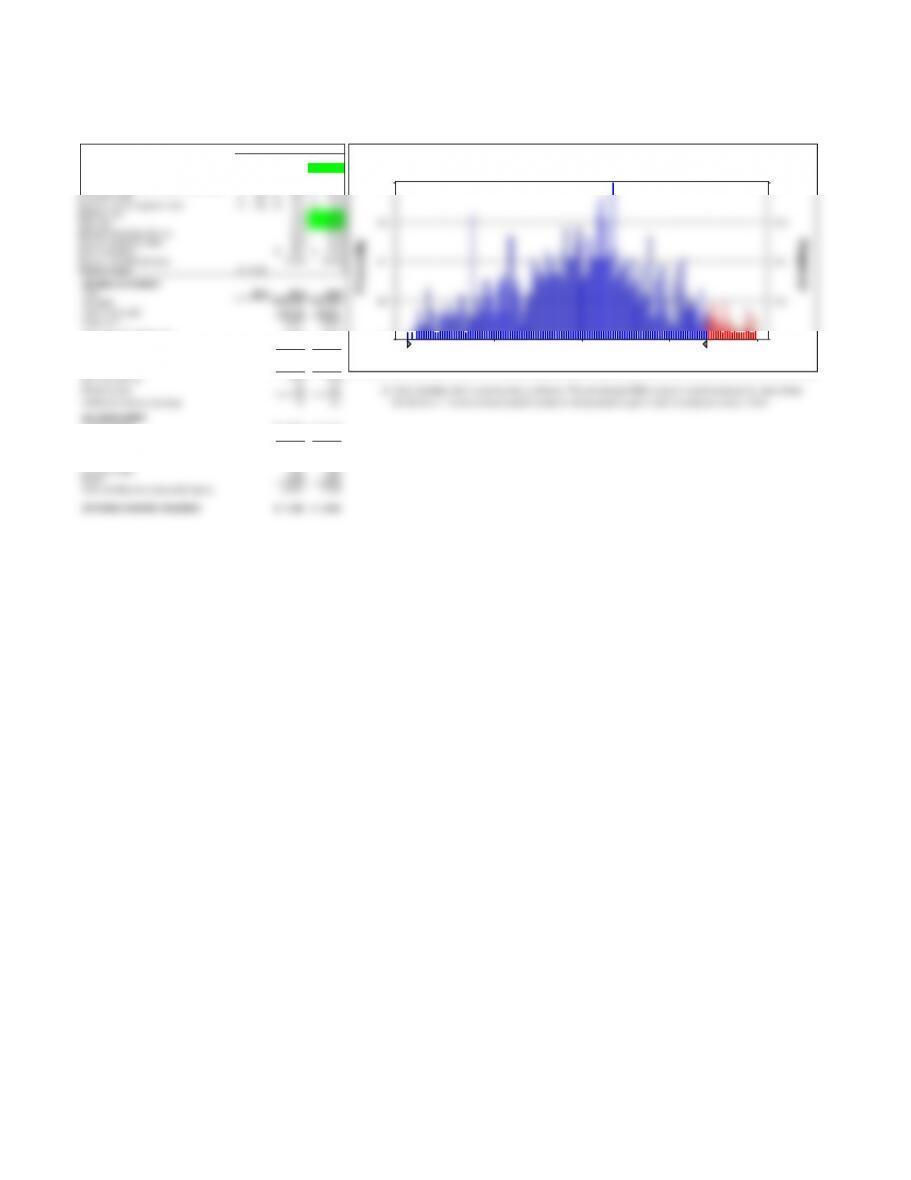
Dividends paid 78 187 b). Each simulation will, of course be slightly different. This one indicates R&E’s treasurer should be prepared to raise at least
Additions to retained earnings 78 187 $2.736 million if he wants to be 95 percent certain of having raised enough to meet the company’s needs in 2016.
BALANCE SHEET
Current assets 7,472$ 9,714$
Net fixed assets 280 270
Total assets 7,752 9,984
Current liabilities 3,736 4,823
Long-term debt 660 560
Equity 1,808 1,995
Total liabilities and shareholders’ equity 6,204 7,378
EXTERNAL FUNDING REQUIRED 1,548$ 2,606$
Frequency Chart
Certainty is 94.80% from -Infinity to $2,736 $ T housands
.000
.005
.011
.016
.021
0
5.25
10.5
15.75
21
$2,440 $2,526 $2,613 $2,699 $2,786
1,000 Trials 5 Outliers
Forecast: External Funding Required