Chapter 2
2. a. Price-to-earnings ratios are highly dependent on future growth expectations. I would thus
expect high-growth Google to have the higher ratio than low-growth Union Pacific.
b. The financial institution should have the higher debt-to-equity ratio because the liquid,
relatively safe nature of its assets enables it to borrow more money at attractive rates. And
c. The appliance manufacturer should have the higher profit margin because it adds more
value to its product than a grocer does and hence can charge a higher markup over cost.
d. The jewelry store should have the higher current ratio. Jewelry stores typically need to
4. a. ROE will most likely fall. The numerator of the ratio, net income, will decline because the
acquisition, a highly unlikely event, ROE will decline.
b. This, however, is not important to the decision. This is another example of the timing
problem. If the technology company has great promise, it may make complete sense to
6. Your colleague’s argument has a couple of holes in it. First, he has forgotten the timing
problem. The investment has consequences over many years, and it is inappropriate to base
the division’s ROI. Conversely, high return divisions, such as yours, will find few
opportunities beating the division’s ROI. We will look at this issue again in Chapter 8 as part
of our look at Economic Value Added.
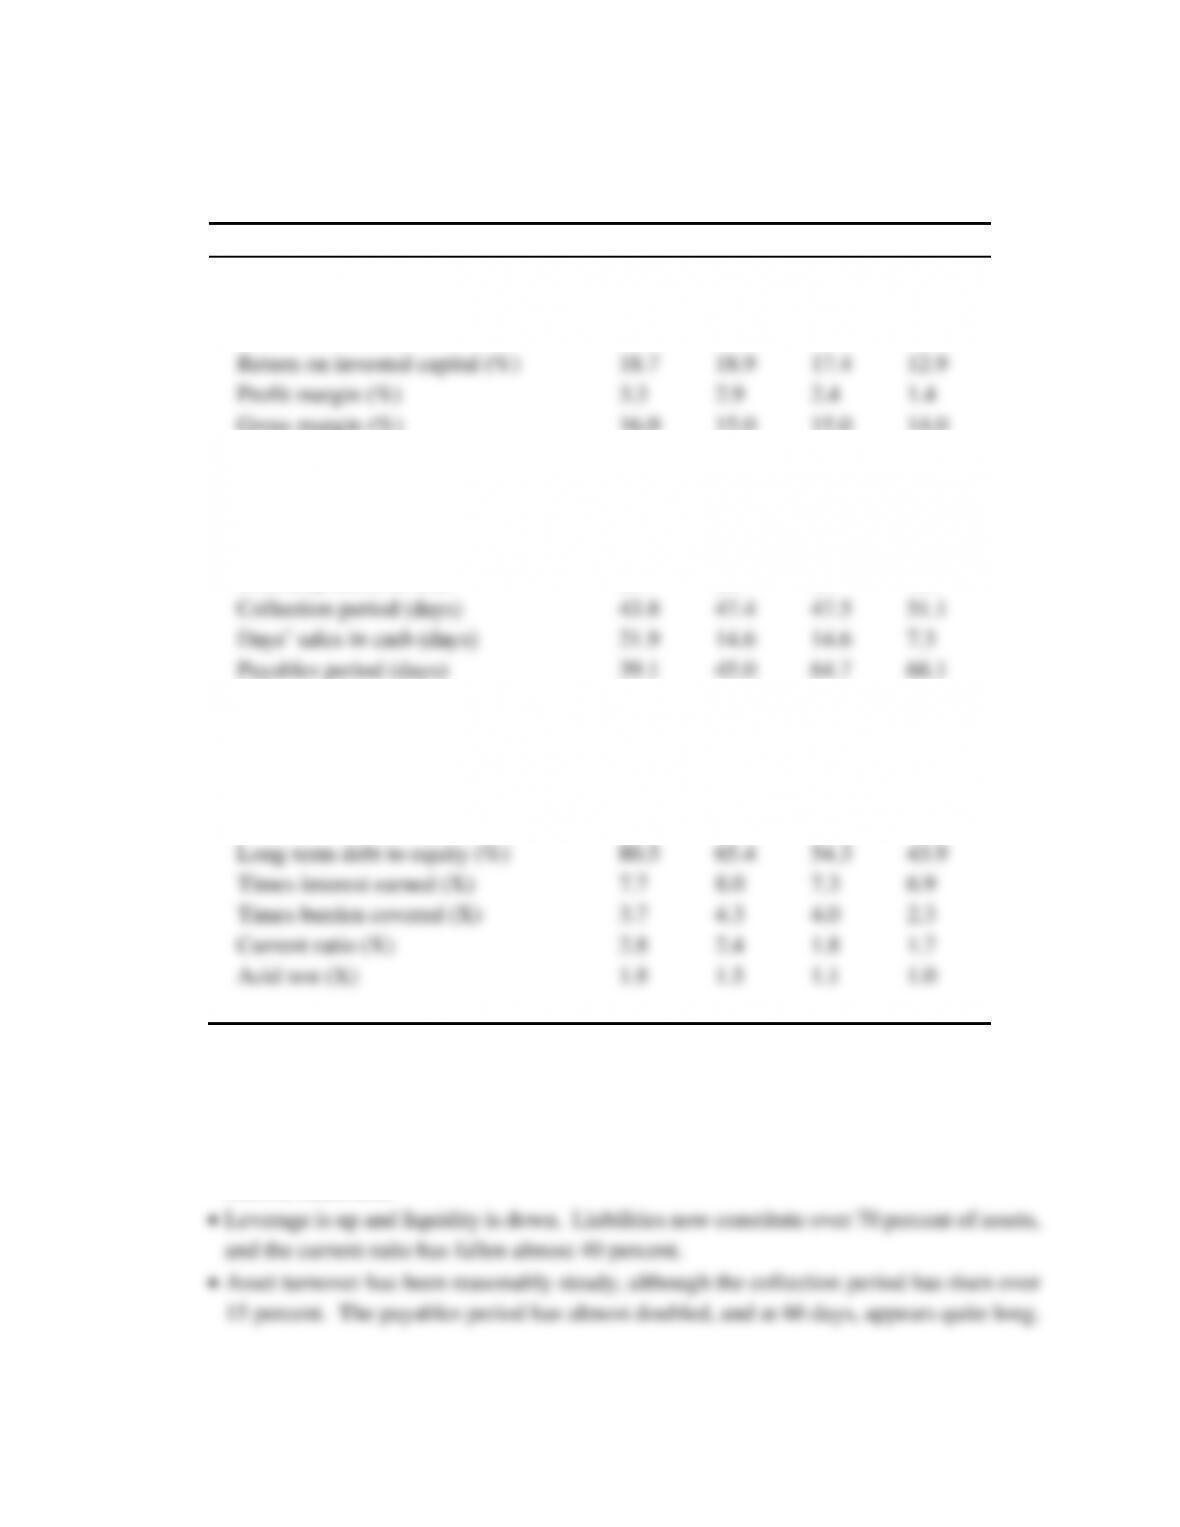
8. a. R&E Supplies, Inc.
Ratio Analysis
2011
2012
2013
2014
Profitability ratios:
Return on equity (%)
30.9
28.6
24.2
16.8
Return on assets (%)
11.3
10.3
7.7
5.0
Return on invested capital (%)
18.7
18.9
17.4
12.9
Profit margin (%)
3.3
2.9
2.4
1.4
Gross margin (%)
16.0
15.0
15.0
14.0
Turnover-control ratios:
Asset turnover (X)
3.4
3.6
3.2
3.5
Fixed-asset turnover (X)
87.4
111.0
54.6
71.8
Inventory turnover (X)
8.4
8.5
7.1
7.8
Collection period (days)
43.8
47.4
47.5
51.1
Days’ sales in cash (days)
21.9
14.6
14.6
7.3
Payables period (days)
39.1
45.0
64.7
66.1
Leverage and liquidity ratios:
Assets to equity (%)
274.5
276.7
314.4
339.3
Total liabilities to assets (%)
63.6
63.9
68.2
70.5
Total liabilities to equity (%)
174.5
176.7
214.4
239.3
Long-term debt to equity (%)
80.5
65.4
54.3
43.9
Times interest earned (X)
7.7
8.0
7.3
6.9
Times burden covered (X)
3.7
4.3
4.0
2.3
Current ratio (X)
2.8
2.4
1.8
1.7
Acid test (X)
1.8
1.5
1.1
1.0
b. Insights:
• All of the profitability ratios are down. ROE, while still respectable, has fallen by almost
half, and the profit margin is down by more than half. This suggests problems on the
income statement.
• R&E Supplies’s rapid growth causes a continuing need for external financing. Falling
operating margins have exacerbated this need. The company appears to have met this
10. a. i. Liabilities-to-equity ratio = 200/300 = 0.67
+ 24/(1 – 0.40)] = 1.76
b. i. To fail to cover the existing interest payments, the times interest earned ratio has to fall
ii. To fail to cover the interest and sinking fund payment, the times burden covered ratio
has to fall to below one. (1.76 – 1)/1.76 = 43.2%, or
iii. To fail to cover interest, principal, and dividend payments we must further subtract the
impact of dividends on the EBIT.
12. A = Walmart. The low profit margin is characteristic of supermarkets or discount retailers.
B = Boeing. The biggest giveaway is that the inventory turnover is very low, indicative of
Boeing’s long production process and relatively infrequent sales.
C = Facebook. The high price-to-earnings ratio is characteristic of a company that hasn’t
F = Apple. There isn’t one clear giveaway here, but the high profit margin is indicative of
Apple’s products.