Chapter 2 Problem 13
a. Use the spreadsheet to calculate as many of the company’s Profitability, Turnover-Control, and Leverage and
Liquidity ratios as you can for these years (see Table 2.5 in text for a list of possible ratios).
b. What do these ratios suggest about the company’s performance over this period?
ANNUAL BALANCE SHEET
($ MILLIONS)
MENS WEARHOUSE INC
Jan10 Jan09 Jan08 Jan07 Jan06
ASSETS
Cash & Short-Term Investments 186.018 104.533 99.367 179.694 263.001
Net Receivables 16.745 40.662 24.872 17.018 19.276
Inventories 431.492 440.099 492.423 448.586 416.603
Prepaid Expenses 26.603 27.179 0.000 0.000
Other Current Assets 74.075 19.718 27.154 35.531 30.732
—————— —————— —————— —————— ————–
Total Current Assets 708.330 631.615 670.995 680.829 729.612
Gross Plant, Property & Equipment 885.981 865.084 669.340 611.957
Accumulated Depreciation 498.509 454.917 379.700 342.371
—————— —————— —————— —————— ————–
Net Plant, Property & Equipment 344.746 387.472 410.167 289.640 269.586
Intangibles 59.414 65.268 75.609 61.765 63.073
Other Assets 119.616 103.375 99.696 64.718 61.003
—————— —————— —————— —————— ————–
TOTAL ASSETS 1,232.106 1,187.730 1,256.467 1,096.952 1,123.274
LIABILITIES
Long Term Debt Due In One Year 0.000 0.000 0.000 0.000 0.000
Accounts Payable 83.052 108.800 146.713 111.213 125.064
Taxes Payable 23.936 0.019 5.590 19.676 21.086
Accrued Expenses 66.542 70.222 75.458 72.531
Other Current Liabilities 117.047 44.862 54.730 19.791 19.404
—————— —————— —————— —————— ————–
Total Current Liabilities 224.035 220.223 277.255 226.138 238.085
Long Term Debt 43.491 62.916 92.399 72.967 207.750
Deferred Taxes 2.700 4.000 12.200 24.400
Other Liabilities 62.236 59.743 66.876 31.875 25.506
—————— —————— —————— —————— ————–
TOTAL LIABILITIES 329.762 345.582 440.530 343.180 495.741
EQUITY
Common Stock 0.705 0.700 0.696 0.691 0.671
Capital Surplus 327.742 315.404 305.209 286.120 255.214
Retained Earnings 986.523 938.580 923.713 775.857 641.558
Less: Treasury Stock 412.626 412.536 413.681 308.896 269.910
—————— —————— —————— —————— ————–
TOTAL EQUITY 902.344 842.148 815.937 753.772 627.533
—————— —————— —————— —————— ————–
TOTAL LIABILITIES & EQUITY 1,232.106 1,187.730 1,256.467 1,096.952 1,123.274
Common Shares Outstanding 52.288 51.918 51.479 53.919 53.069
ANNUAL INCOME STATEMENT
(MILLIONS, EXCEPT PER SHARE)
Jan10 Jan09 Jan08 Jan07 Jan06
Sales 1,909.575 1,972.418 2,112.558 1,882.064 1,724.898
Cost of Goods Sold 1,025.759 1,031.241 1,062.205 1,004.972 965.889
——————- —————— —————— —————— —————
Gross Profit 883.816 941.177 1,050.353 877.092 759.009
Selling, General, & Administrative Exp. 732.722 757.073 741.405 591.767 531.839
——————- —————— —————— —————— —————
Operating Income Before Deprec. 151.094 184.104 308.948 285.325 227.170
Depreciation,Depletion,&Amortization 86.090 90.665 80.296 61.387 61.874
——————- —————— —————— —————— —————
Operating Profit 65.004 93.439 228.652 223.938 165.296
Interest Expense 0.332 4.300 5.046 9.216 5.888
Non-Operating Income/Expense 0.000 2.592 5.987 9.786 3.280
Special Items 3.200 (2.968) 0.000 0.000 0.000
——————- —————— —————— —————— —————
Pretax Income 67.872 88.763 229.593 224.508 162.688
Total Income Taxes 22.364 29.919 82.552 75.933 58.785
——————- —————— —————— —————— —————
Income Before Extraordinary
Items & Discontinued Operations 45.508 58.844 147.041 148.575 103.903
——————- —————— —————— —————— —————
Savings Due to Common Stock Equiv. (0.834) 0.000 0.000 0.000 0.000
——————- —————— —————— —————— —————
Adjusted Net Income 44.674 58.844 147.041 148.575 103.903
EPS Basic from Operations 0.820 1.180 2.760 2.710 2.010
EPS Diluted from Operations 0.820 1.170 2.730 2.620 1.950
Dividends Per Share 0.280 0.280 0.230 0.200 0.000
Com Shares for Basic EPS 52.280 51.645 53.258 53.111 53.753
Com Shares for Diluted EPS 52.280 51.944 53.890 54.749 55.365
Chapter 2 Problem 13 Suggested Answers
a. Use the spreadsheet to calculate as many of the company’s Profitability, Turnover-Control, and Leverage and
Liquidity ratios as you can for these years (see Table 2.4 in text for a list of possible ratios).
b. What do these ratios suggest about the company’s performance over this period?
a.
2010 2009 2008 2007 2006
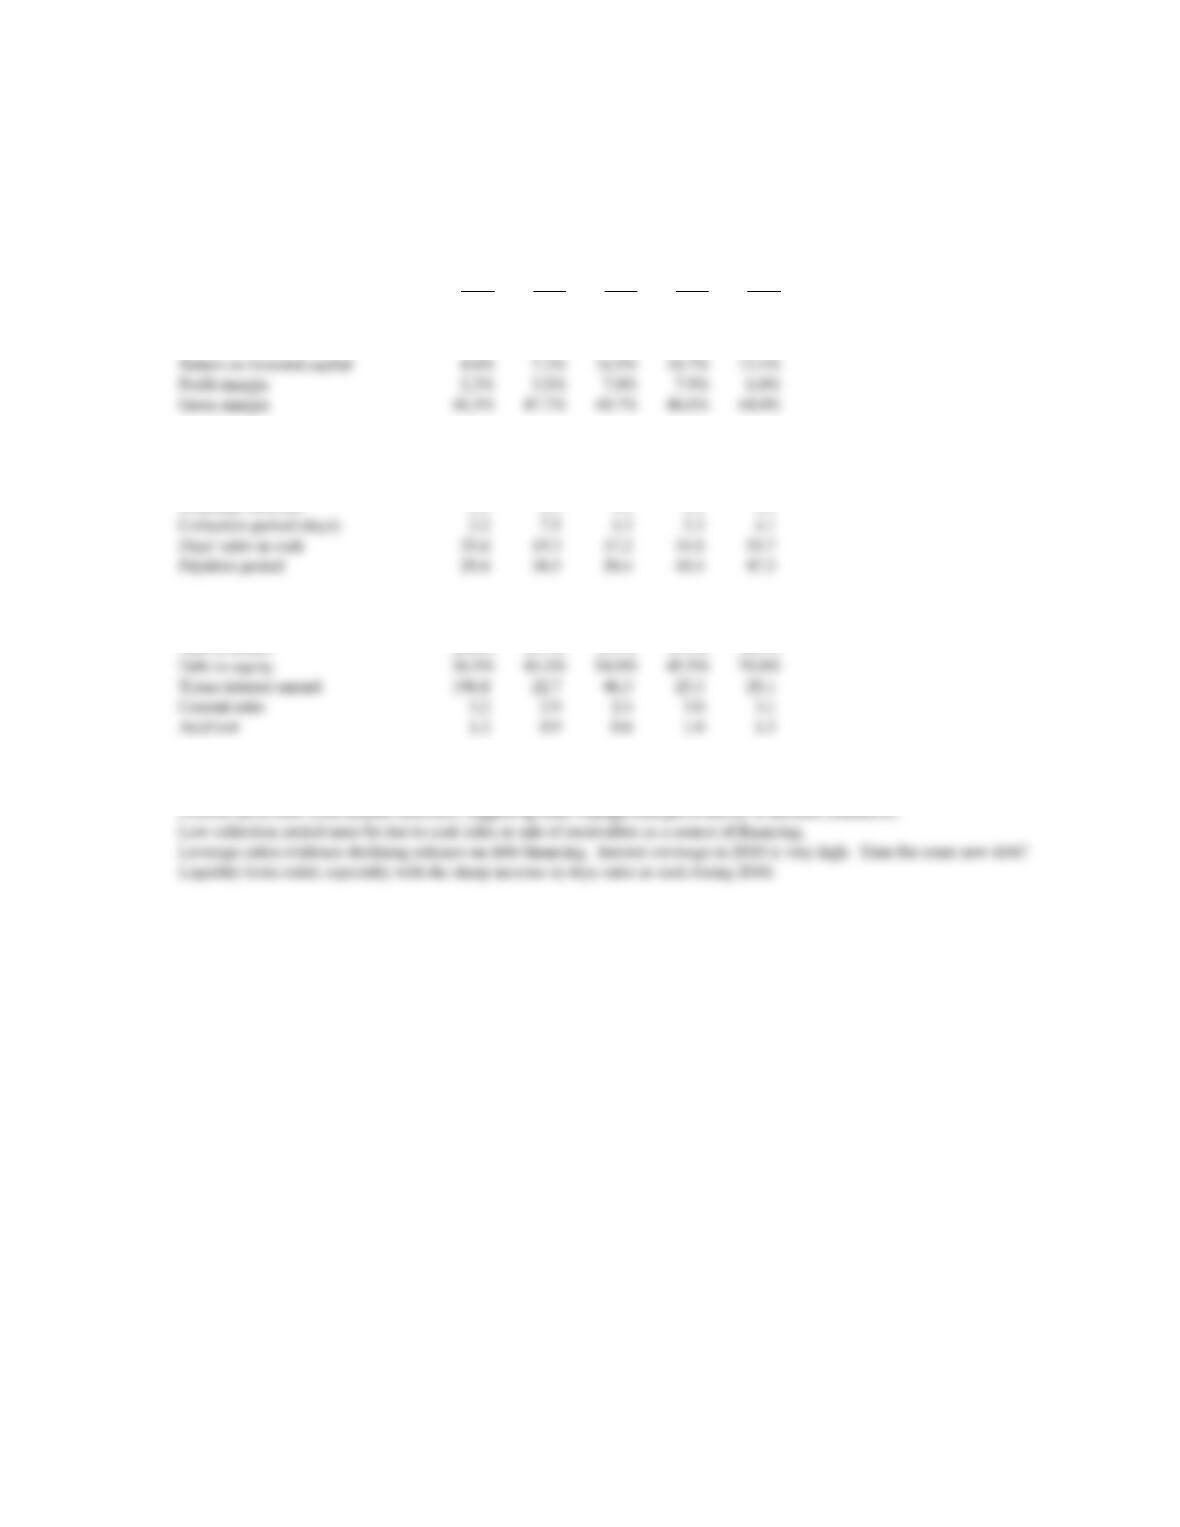
Profitability Ratios (in %)
Return on equity 5.0% 7.0% 18.0% 19.7% 16.6%
Return on assets 3.6% 5.0% 11.7% 13.5% 9.3%
Return on invested capital 4.6% 7.2% 16.5% 18.7% 13.1%
Profit margin 2.3% 3.0% 7.0% 7.9% 6.0%
Gross margin 46.3% 47.7% 49.7% 46.6% 44.0%
Turnover-Control Ratios
Asset turnover 1.5 1.7 1.7 1.7 1.5
Fixed-asset turnover 5.5 5.1 5.2 6.5 6.4
Inventory turnover 2.4 2.3 2.2 2.2 2.3
Collection period (days) 3.2 7.5 4.3 3.3 4.1
Days’ sales in cash 35.6 19.3 17.2 34.8 55.7
Payables period 29.6 38.5 50.4 40.4 47.3
Leverage and Liquidity Ratios
Assets to equity 1.4 1.4 1.5 1.5 1.8
Debt to assets 26.8% 29.1% 35.1% 31.3% 44.1%
Debt to equity 36.5% 41.0% 54.0% 45.5% 79.0%
Times interest earned 196.8 22.7 46.3 25.3 29.1
Current ratio 3.2 2.9 2.4 3.0 3.1
Acid test 1.2 0.9 0.6 1.0 1.3
b. COMMENTS
Margins are down after 2008 due to Great Recession, but the company is continuously profitable.
Control ratios look solid despite recession, suggesting solid management performance in difficult conditions.
Low collection period must be due to cash sales or sale of receivables as a source of financing.
Leverage ratios evidence declining reliance on debt financing. Interest coverage in 2010 is very high. Time for some new debt?
Liquidity looks solid, especially with the sharp increase in days sales in cash during 2010.

Chapter 2 Problem 14
a. For the years 2005 – 2009, calculate Boeing’s
i. Total liabilities-to-equity ratio
ii. Times interest earned ratio
iii. Times burden covered ratio
b. What percentage decline in earnings before interest and taxes could Boeing have sustained in these years before failing to cover
i. Interest and principal repayment requirements,
ii. Interest, principal and common dividend payments?
c. What do these calculations suggest about Boeing’s financial leverage during this period?
ANNUAL BALANCE SHEET
($ MILLIONS)
BOEING CO
Dec09 Dec08 Dec07 Dec06 Dec05
ASSETS
Cash & Short-Term Investments 11,223 3,279 9,308 6,386 5,966
Net Receivables 6,153 6,027 6,068 5,655 5,613
Inventories 16,933 15,612 9,563 8,105 7,940
Other Current Assets 966 1,046 2,341 2,837 2,449
——————
——————
——————
—————— ————–
Total Current Assets 35,275 25,964 27,280 22,983 21,968
Gross Plant, Property & Equipment 21,579 21,042 20,180 19,310 19,692
Accumulated Depreciation 12,795 12,280 11,915 11,635 11,272
——————
——————
——————
—————— ————–
Net Plant, Property & Equipment 8,784 8,762 8,265 7,675 8,420
Investments at Equity 974 942 1,085 964 84
Other Investments 5,522 6,243 9,803 11,641 12,407
Intangibles 7,196 6,332 5,174 4,745 2,799
Deferred Charges – – – – 13,251
Other Assets 4,302 5,536 7,379 3,786 1,129
——————
——————
——————
—————— ————–
TOTAL ASSETS 62,053 53,779 58,986 51,794 60,058
LIABILITIES
Long Term Debt Due In One Year 707 560 762 1,381 1,189
Accounts Payable 7,096 5,871 5,714 5,643 5,124
Taxes Payable 182 41 253 670 556
Accrued Expenses 12,822 6,169 6,637 6,106 6,590
Other Current Liabilities 12,076 18,284 18,172 15,901 14,729
——————
——————
——————
—————— ————–
Total Current Liabilities 32,883 30,925 31,538 29,701 28,188
Long Term Debt 12,217 6,952 7,455 8,157 9,538
Deferred Taxes – – 1,190 – 2,067
Minority Interest 97
Other Liabilities 14,728 17,196 9,799 9,197 9,206
——————
——————
——————
—————— ————–
TOTAL LIABILITIES 59,925 55,073 49,982 47,055 48,999
EQUITY
Common Stock 5,061 5,061 5,061 5,061 5,061
Capital Surplus 3,724 3,456 4,757 4,655 4,371
Retained Earnings 10,869 9,150 16,780 10,236 15,498
Less: Treasury Stock 17,526 18,961 17,594 15,213 13,871
——————
——————
——————
—————— ————–
TOTAL EQUITY 2,128 (1,294) 9,004 4,739 11,059
——————
——————
——————
—————— ————–
TOTAL LIABILITIES & EQUITY 62,053 53,779 58,986 51,794 60,058
Common Shares Outstanding 726.291 698.138 736.681 757.836 760.577
ANNUAL INCOME STATEMENT
Dec09 Dec08 Dec07 Dec06 Dec05
Sales 68,281 60,909 66,387 61,530 54,845
Cost of Goods Sold 55,092 48,950 51,977 48,926 44,757
——————-
——————
——————
—————— —————
Gross Profit 13,189 11,959 14,410 12,604 10,088
Selling, General, & Administrative Exp. 9,870 6,852 7,381 7,428 6,433
——————-
——————
——————
—————— —————
Operating Income Before Deprec. 3,319 5,107 7,029 5,176 3,655
Depreciation,Depletion,&Amortization 1,273 1,179 1,130 1,158 1,092
——————-
——————
——————
—————— —————
Operating Profit 2,046 3,928 5,899 4,018 2,563
Interest Expense 604 524 608 657 713
Non-Operating Income/Expense 289 591 827 709 391
Special Items (876) 578
——————-
——————
——————
—————— —————
Pretax Income 1,731 3,995 6,118 3,194 2,819
Total Income Taxes 396 1,341 2,060 988 257
——————-
——————
——————
—————— —————
Income Before Extraordinary
Items & Discontinued Operations 1,335 2,654 4,058 2,206 2,562
Discontinued Operations (23) 18 16 9 (7)
——————-
——————
——————
—————— —————
Adjusted Net Income 1,312 2,672 4,074 2,215 2,555
Chapter 2 Problem 14 Suggested Answers
Boeing Company
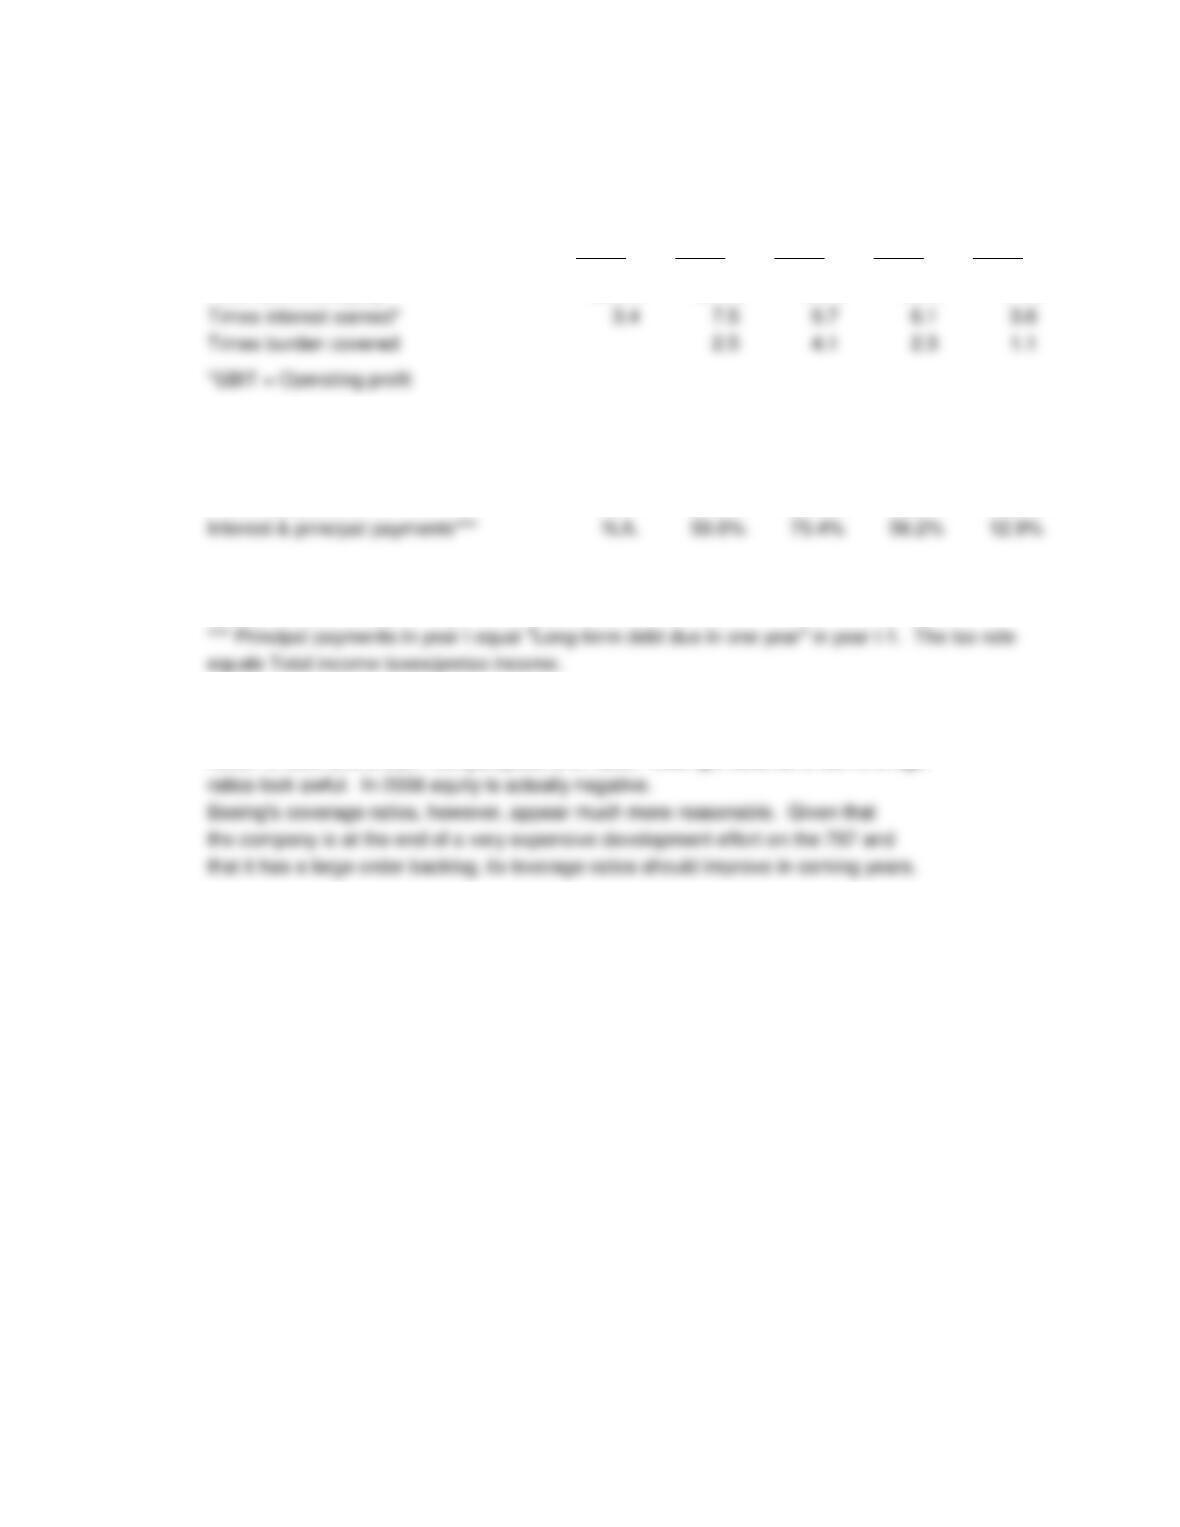
a. Ratios Dec09 Dec08 Dec07 Dec06 Dec05
Total liabilities/equity 28.2% -42.6% 5.6% 9.9% 4.4%
Times interest earned* 3.4 7.5 9.7 6.1 3.6
Times burden covered 2.5 4.1 2.3 1.1
*EBIT = Operating profit
b. Percentage decline in earnings before interest and taxes
before failing to cover:**
Interest payments* 70.5% 86.7% 89.7% 83.6% 72.2%
Interest & principal payments*** N.A. 59.6% 75.4% 56.2% 12.9%
** Consider the ratio N/D. What percentage decline in N causes the ratio to equal 1? N
can fall to $D, or in percentage terms to (N-D)/N, or 1-1/(N/D).
*** Principal payments in year t equal “Long-term debt due in one year” in year t-1. The tax rate
equals Total income taxes/pretax income.
c. Comments
This problem illustrates the sharp differences that can exist between a balance sheet
notion of debt and a cash flow perspective on debt. Boeing’s balance sheet leverage
ratios look awful. In 2008 equity is actually negative.
Boeing’s coverage ratios, however, appear much more reasonable. Given that
the company is at the end of a very expensive development effort on the 787 and
that it has a large order backlog, its leverage ratios should improve in coming years.