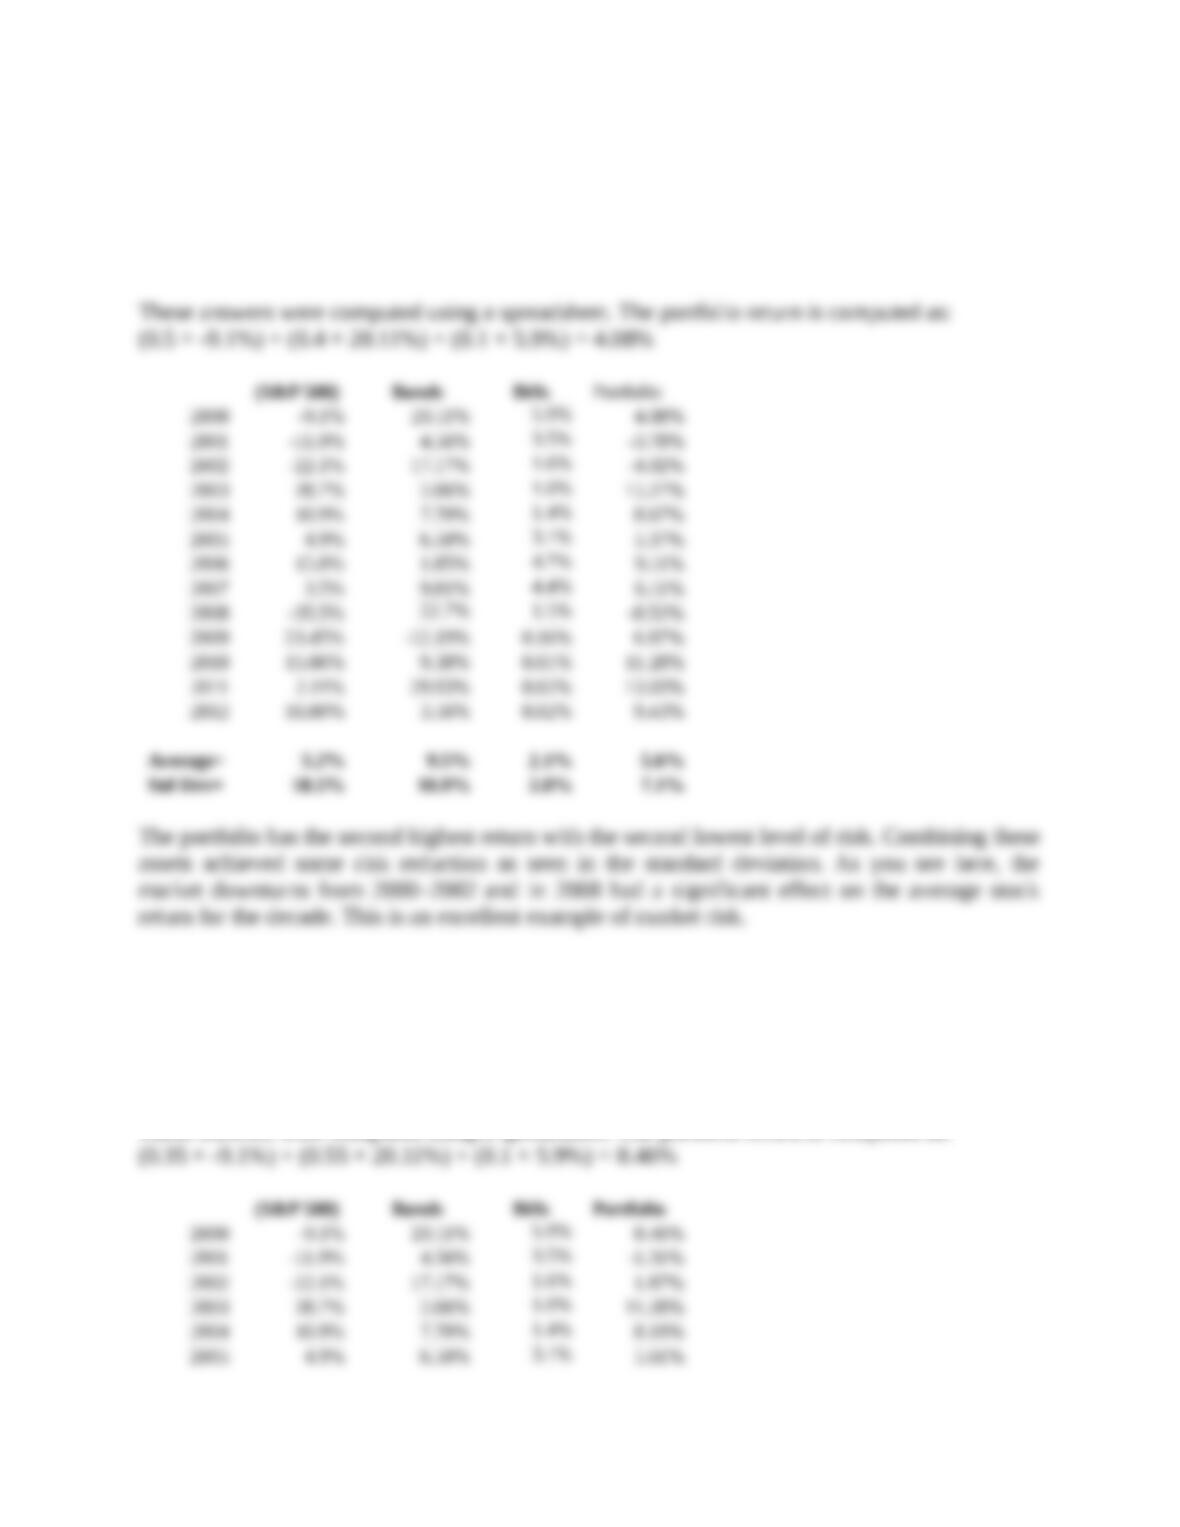
LG2&5 9-27 Asset Allocation You have a portfolio with an asset allocation of 50 percent stocks,
40 percent long-term Treasury bonds, and 10 percent T-bills. Use these weights and the returns in
Table 9.2 to compute the return of the portfolio in the year 2000 and each year since. Then
compute the average annual return and standard deviation of the portfolio and compare them
with the risk and return profile of each individual asset class.
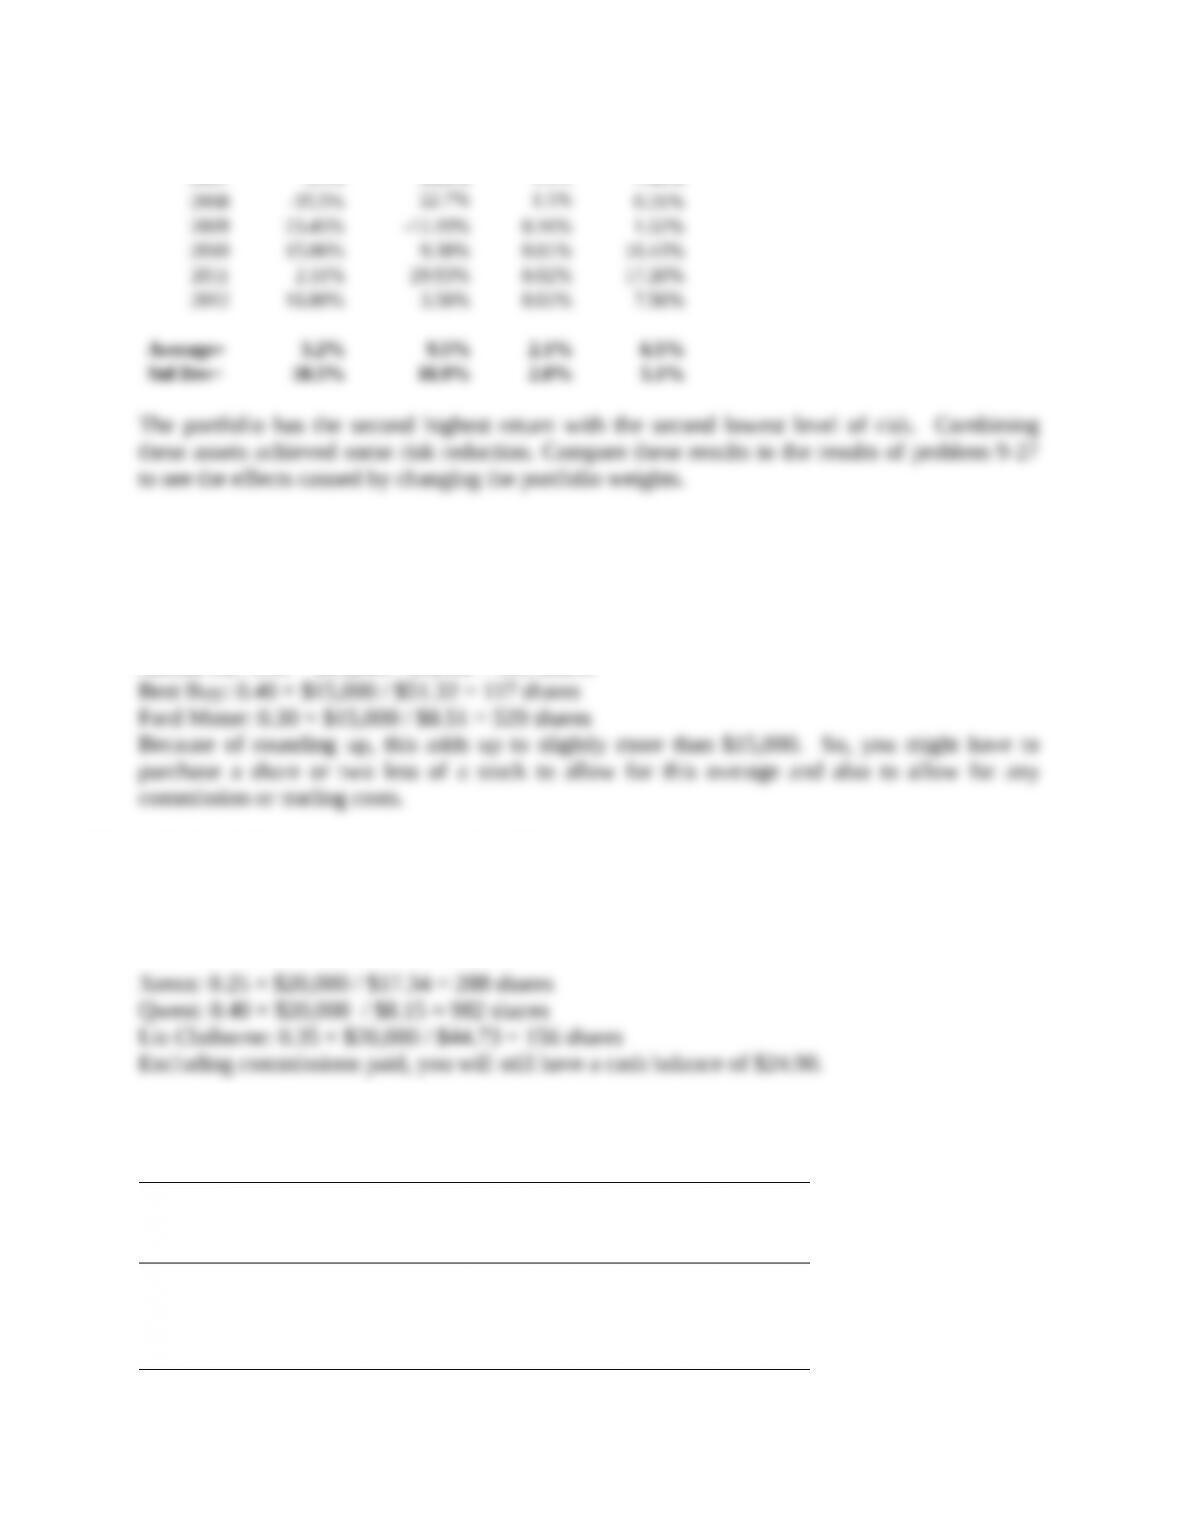
LG2&5 9-28 Asset Allocation You have a portfolio with an asset allocation of 35 percent stocks, 55
percent long-term Treasury bonds, and 10 percent T-bills. Use these weights and the returns in
Table 9.2 to compute the return of the portfolio in the year 2000 and each year since. Then
compute the average annual return and standard deviation of the portfolio and compare them
with the risk and return profile of each individual asset class.
2006 15.8% 1.85% 4.7% 7.02%
LG7 9-29 Portfolio Weights You have $15,000 to invest. You want to purchase shares of Alaska Air
at $42.88, Best Buy at $51.32, and Ford Motor at $8.51. How many shares of each company
should you purchase so that your portfolio consists of 30 percent Alaska Air, 40 percent Best
Buy, and 30 percent Ford Motor? Report only whole stock shares.
LG7 9-30 Portfolio Weights You have $20,000 to invest. You want to purchase shares of Xerox at
$17.34, Qwest at $8.15, and Liz Claiborne at $44.73. How many shares of each company should
you purchase so that your portfolio consists of 25 percent Xerox, 40 percent Qwest, and 35
percent Liz Claiborne? Report only whole stock shares.
LG7 9-31 Portfolio Return The following table shows your stock positions at the beginning of the
year, the dividends that each stock paid during the year, and the stock prices at the end of the
year. What is your portfolio dollar return and percentage return?
Company Shares
Beginning
of Year
Price
Dividen
d per
Share
End of
Year
Price
US Bank 300 $43.50 $2.06 $43.43
PepsiCo 200 59.08 1.16 62.55
JDS Uniphase 500 18.88 16.66
Duke Energy 250 27.45 1.26 33.21
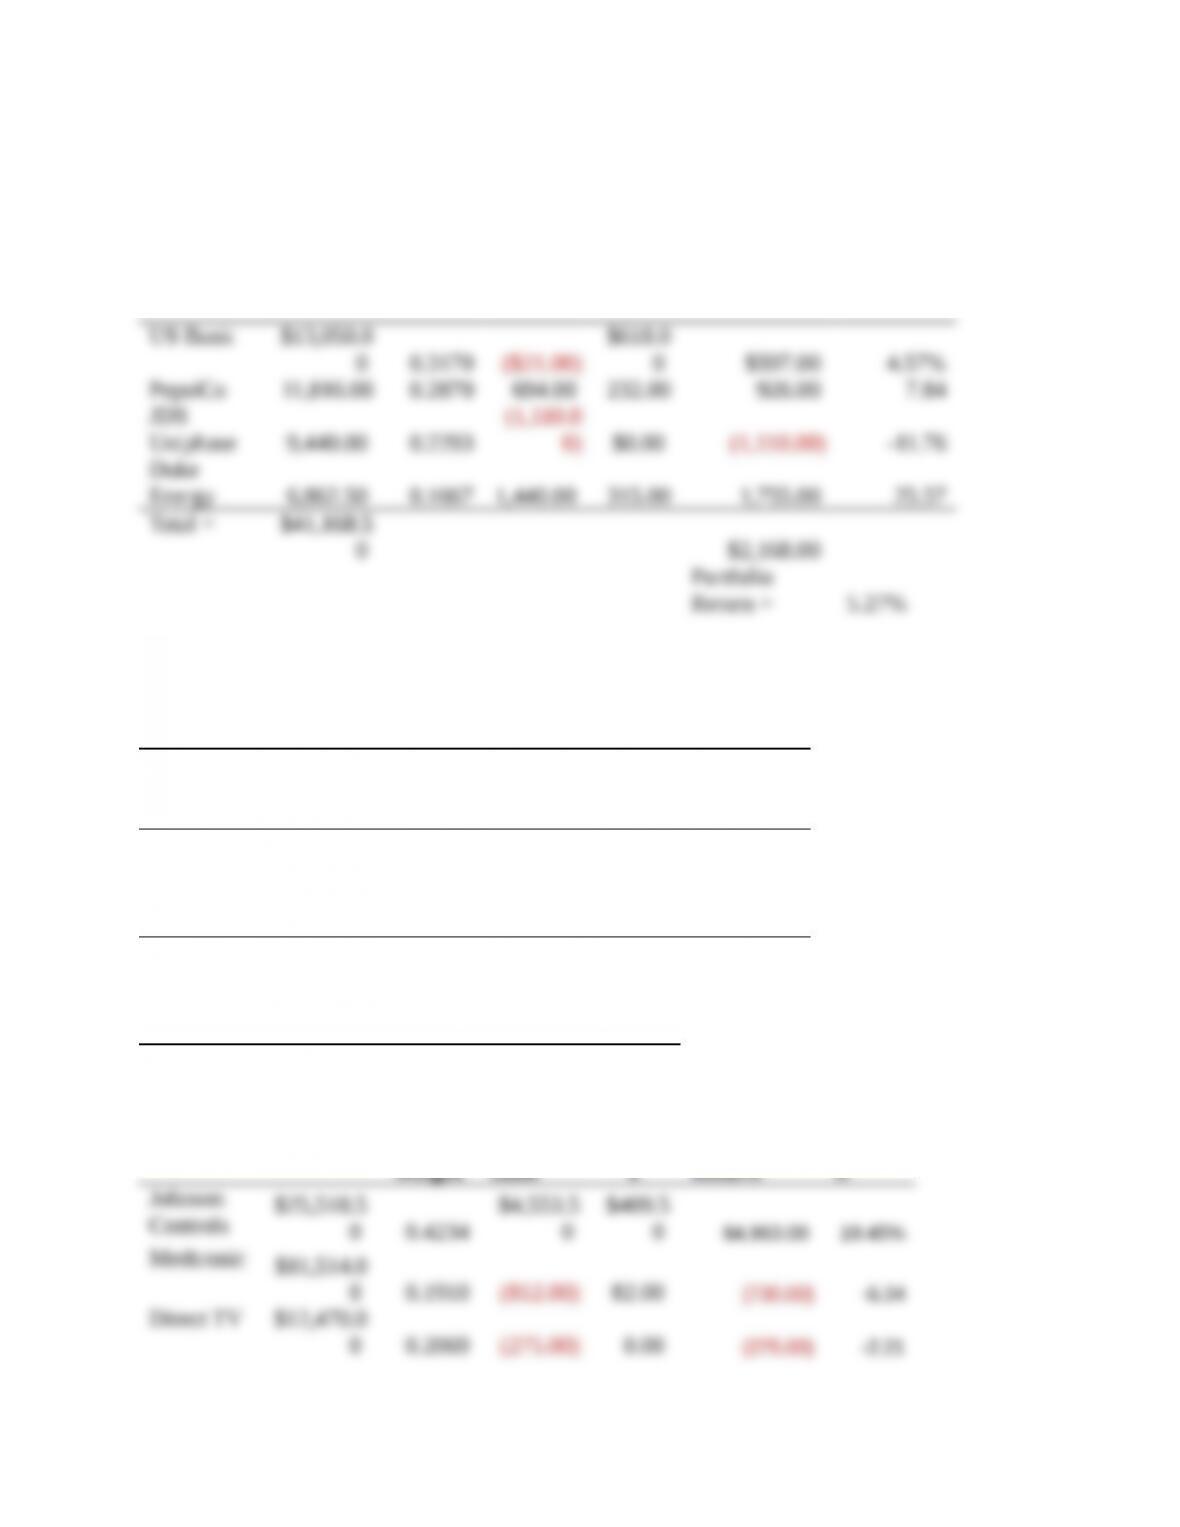
Solution by spreadsheet:
Company
Beginnin
g Value
Portfoli
o
Weight
Capital
Gain
Incom
e Total Return
Percentag
e Return
LG7 9-32 Portfolio Return The table below shows your stock positions at the beginning of
the year, the dividends that each stock paid during the year, and the stock prices at the end of the
year. What is your portfolio dollar return and percentage return?
Company Shares
Beginning
of Year
Price
Dividen
d per
Share
End of
Year
Price
Johnson Controls 350 $72.91 $1.17 $85.92
Medtronic 200 57.57 0.41 53.51
Direct TV 500 24.94 24.39
Qualcomm 250 43.08 0.45 38.92
Solution by spreadsheet:
Portfoli
o
Capital
Incom
Company Beginnin
g Value
Total
Percen
t
Retur
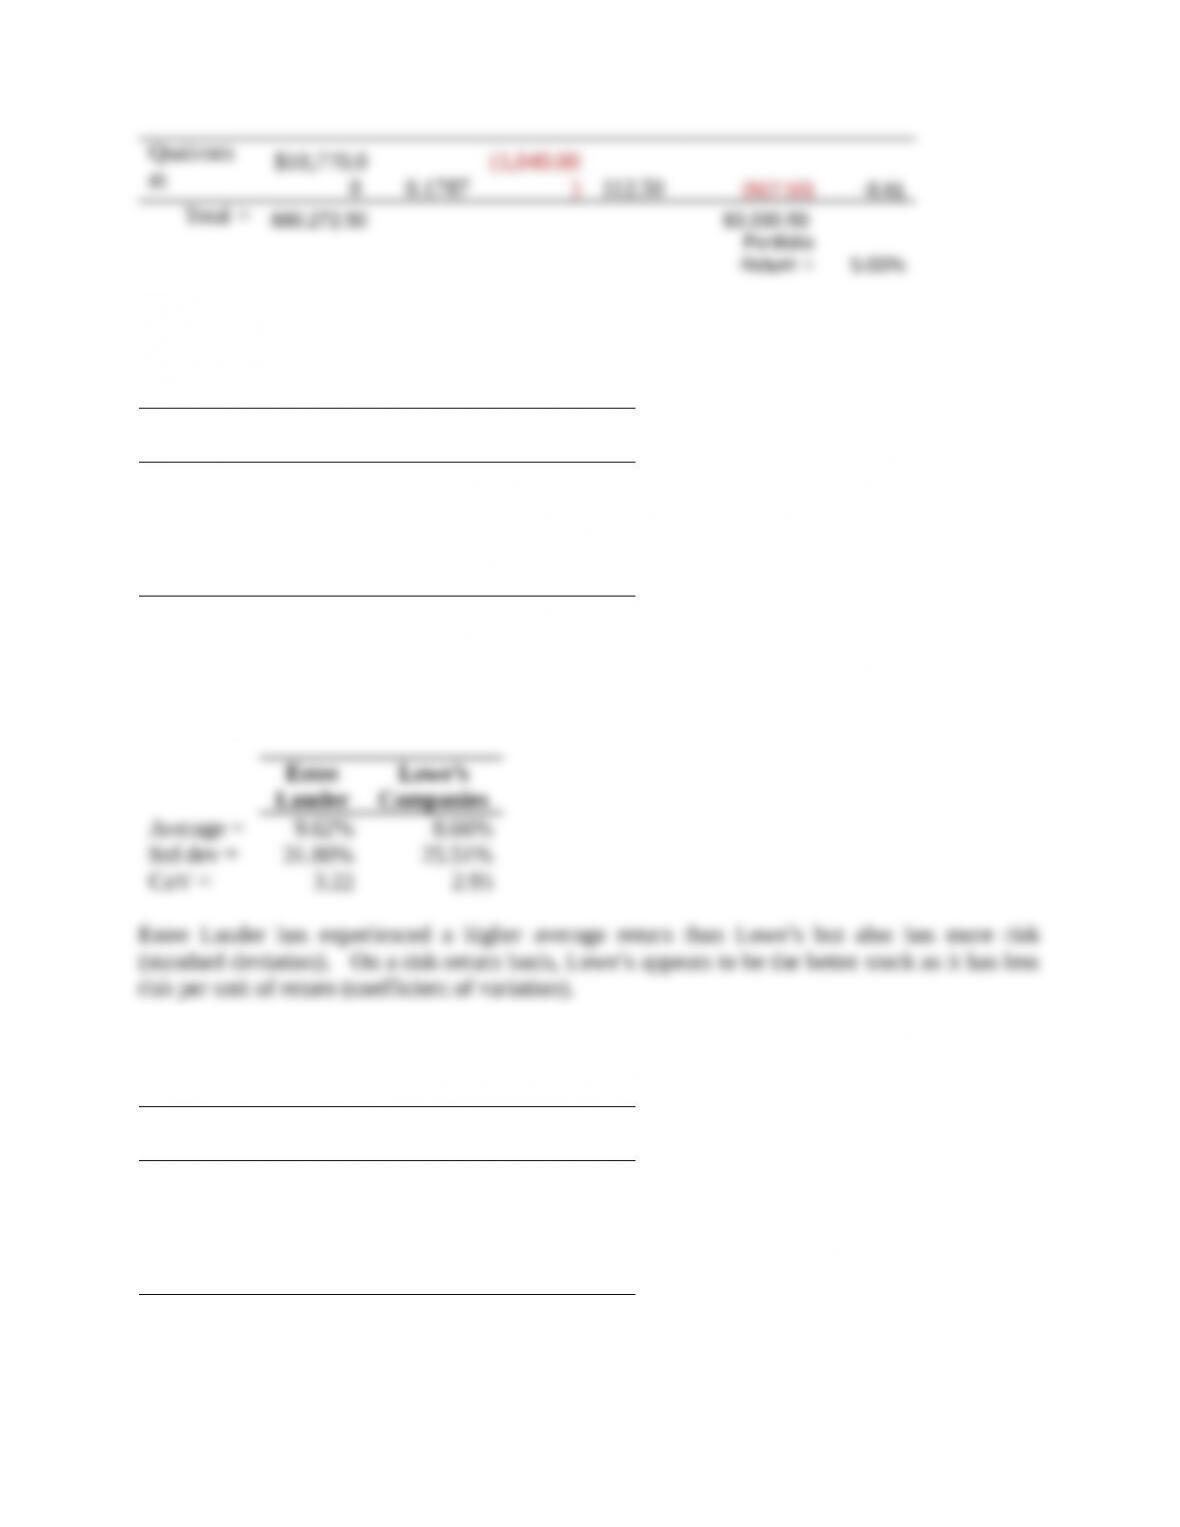
LG3&4 9-33 Risk, Return, and Their Relationship Consider the following annual returns of Estee
Lauder and Lowe’s Companies:
Estee Lauder Lowe’s
Companies
Year 1 23.4% -6.0%
Year 2 -26.0 16.1
Year 3 17.6 4.2
Year 4 49.9 48.0
Year 5 -16.8 -19.0
Compute each stock’s average return, standard deviation, and coefficient of variation. Which
stock appears better? Why?
Solution by spreadsheet:
LG3&4 9-34 Risk, Return, and Their Relationship Consider the following annual returns of Molson
Coors and International Paper:
Molson
Coors
International
Paper
Year 1 16.3% 4.5%
Year 2 -9.7 -17.5
Year 3 36.5 -0.2
Year 4 -6.9 26.6
Year 5 16.2 -11.1
Compute each stock’s average return, standard deviation, and coefficient of variation. Which
stock appears better? Why?
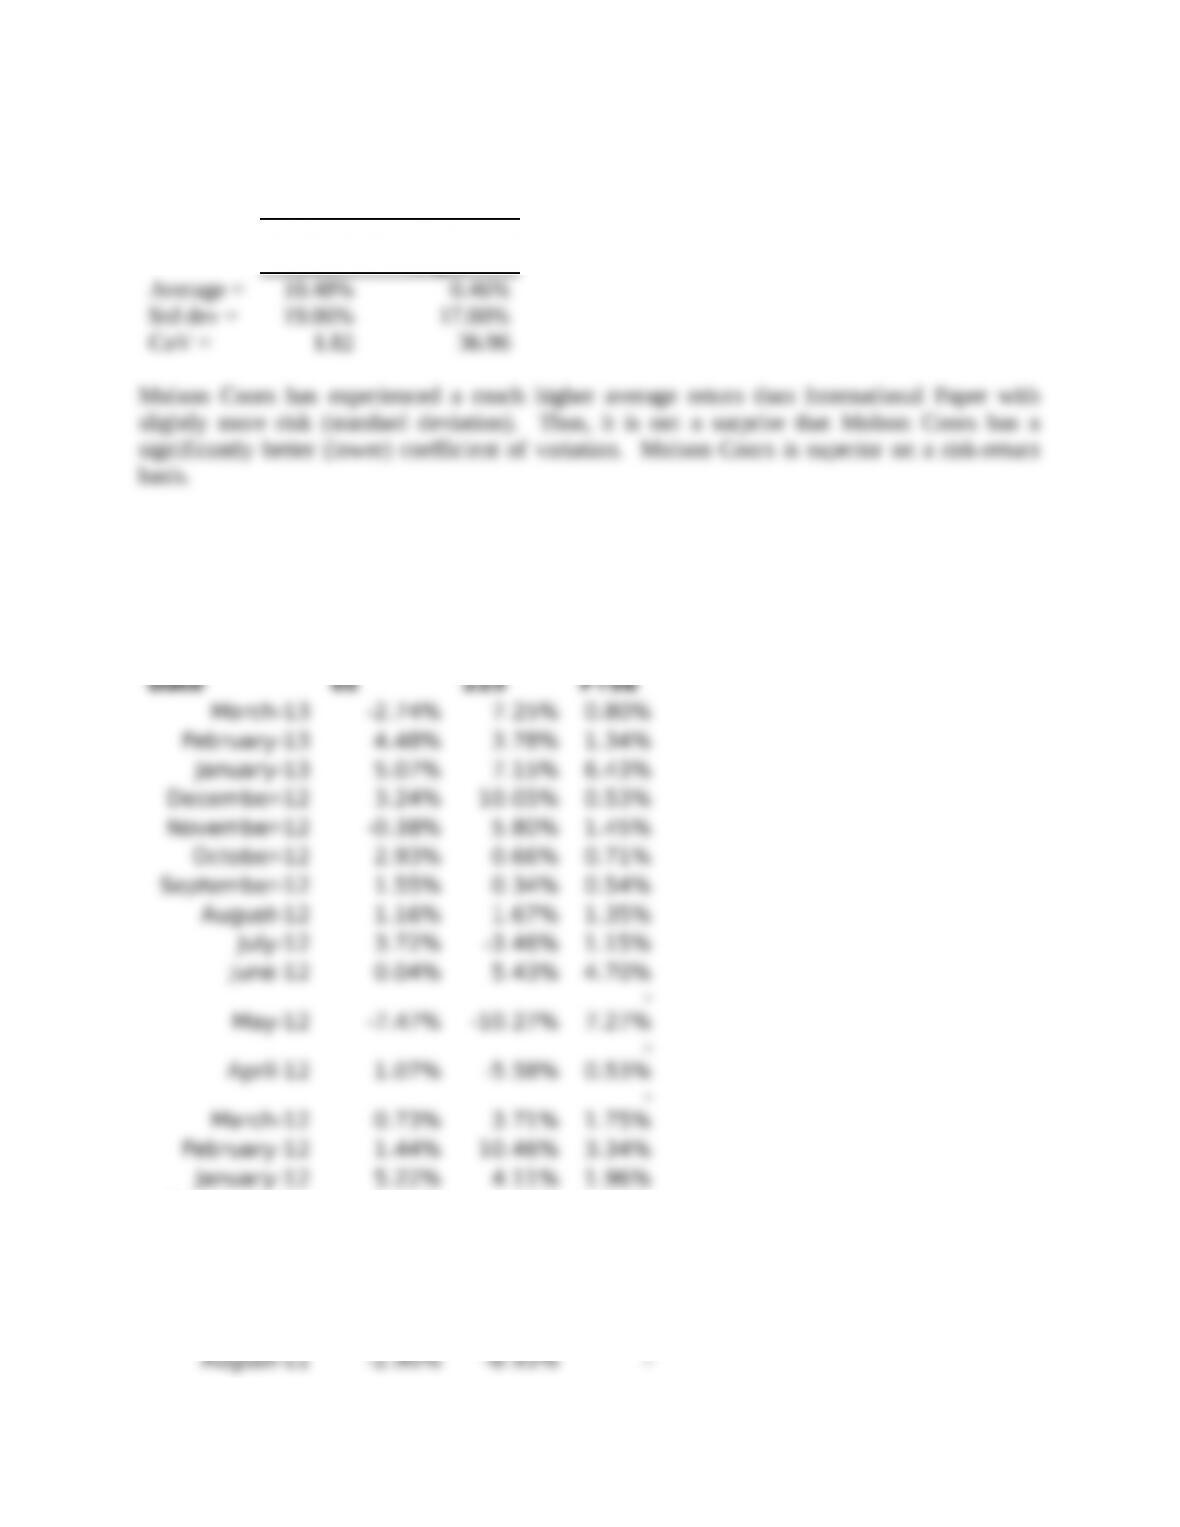
Solution by spreadsheet:
Molson
Coors
International
Paper
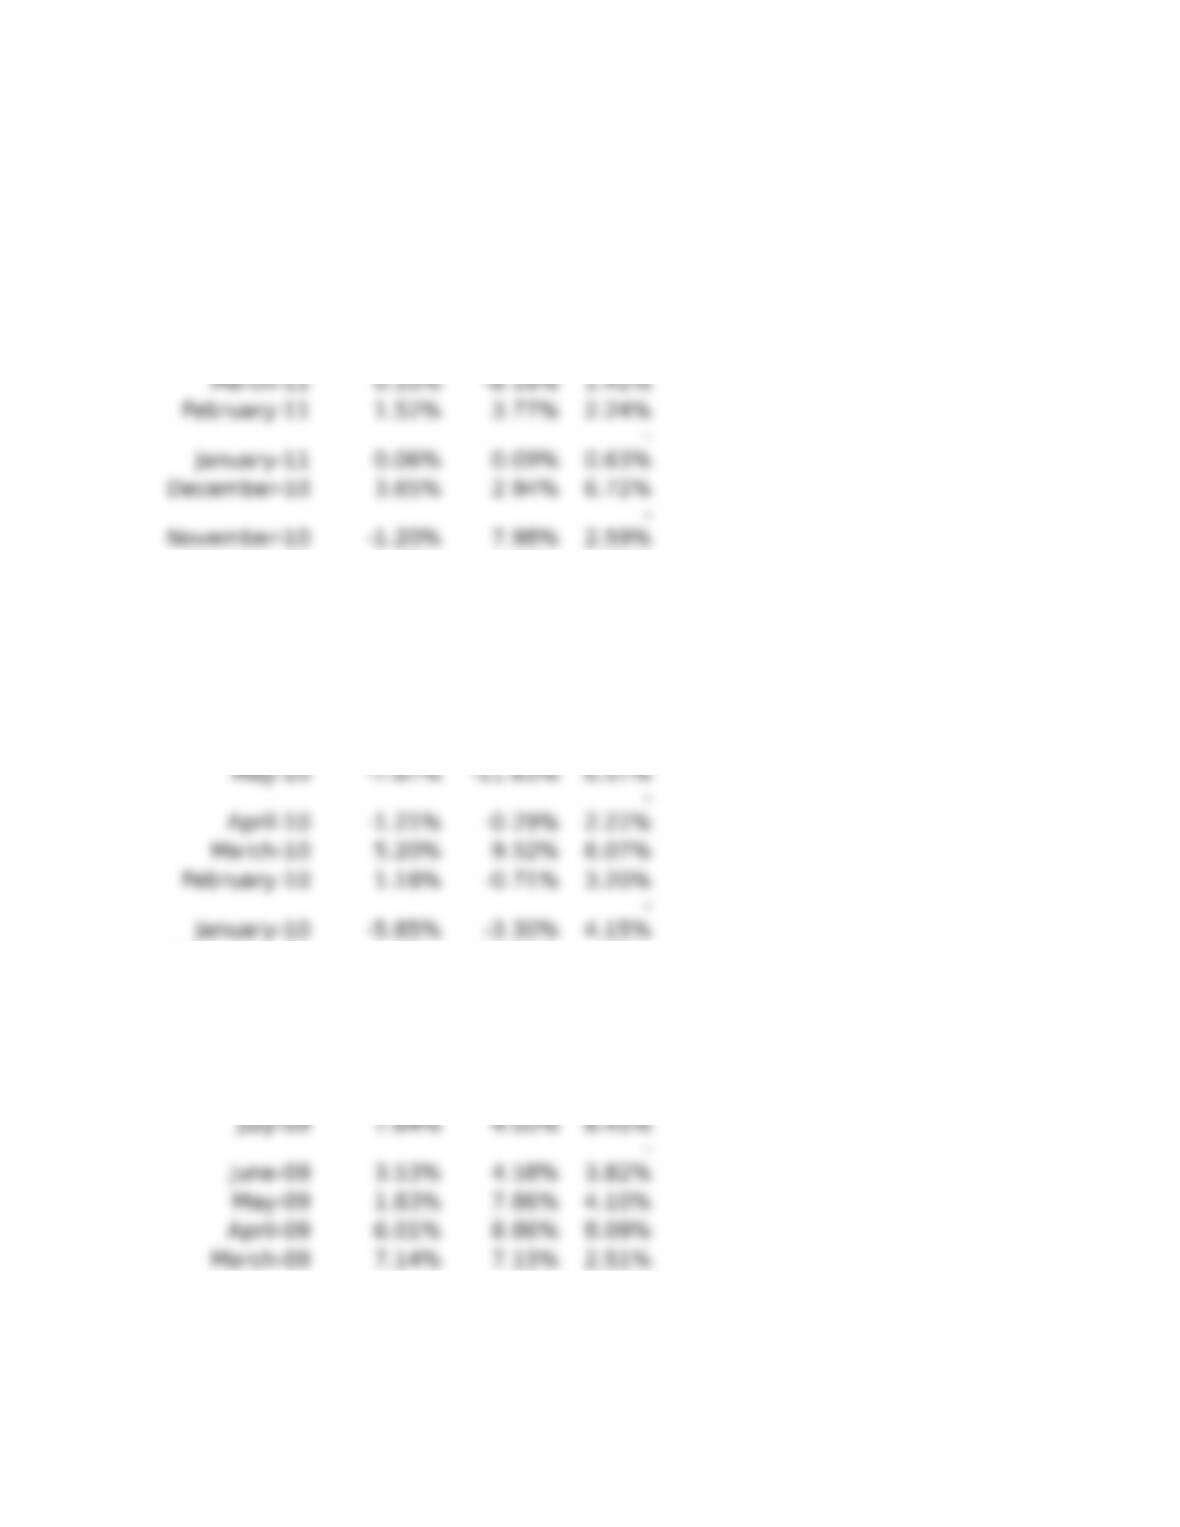
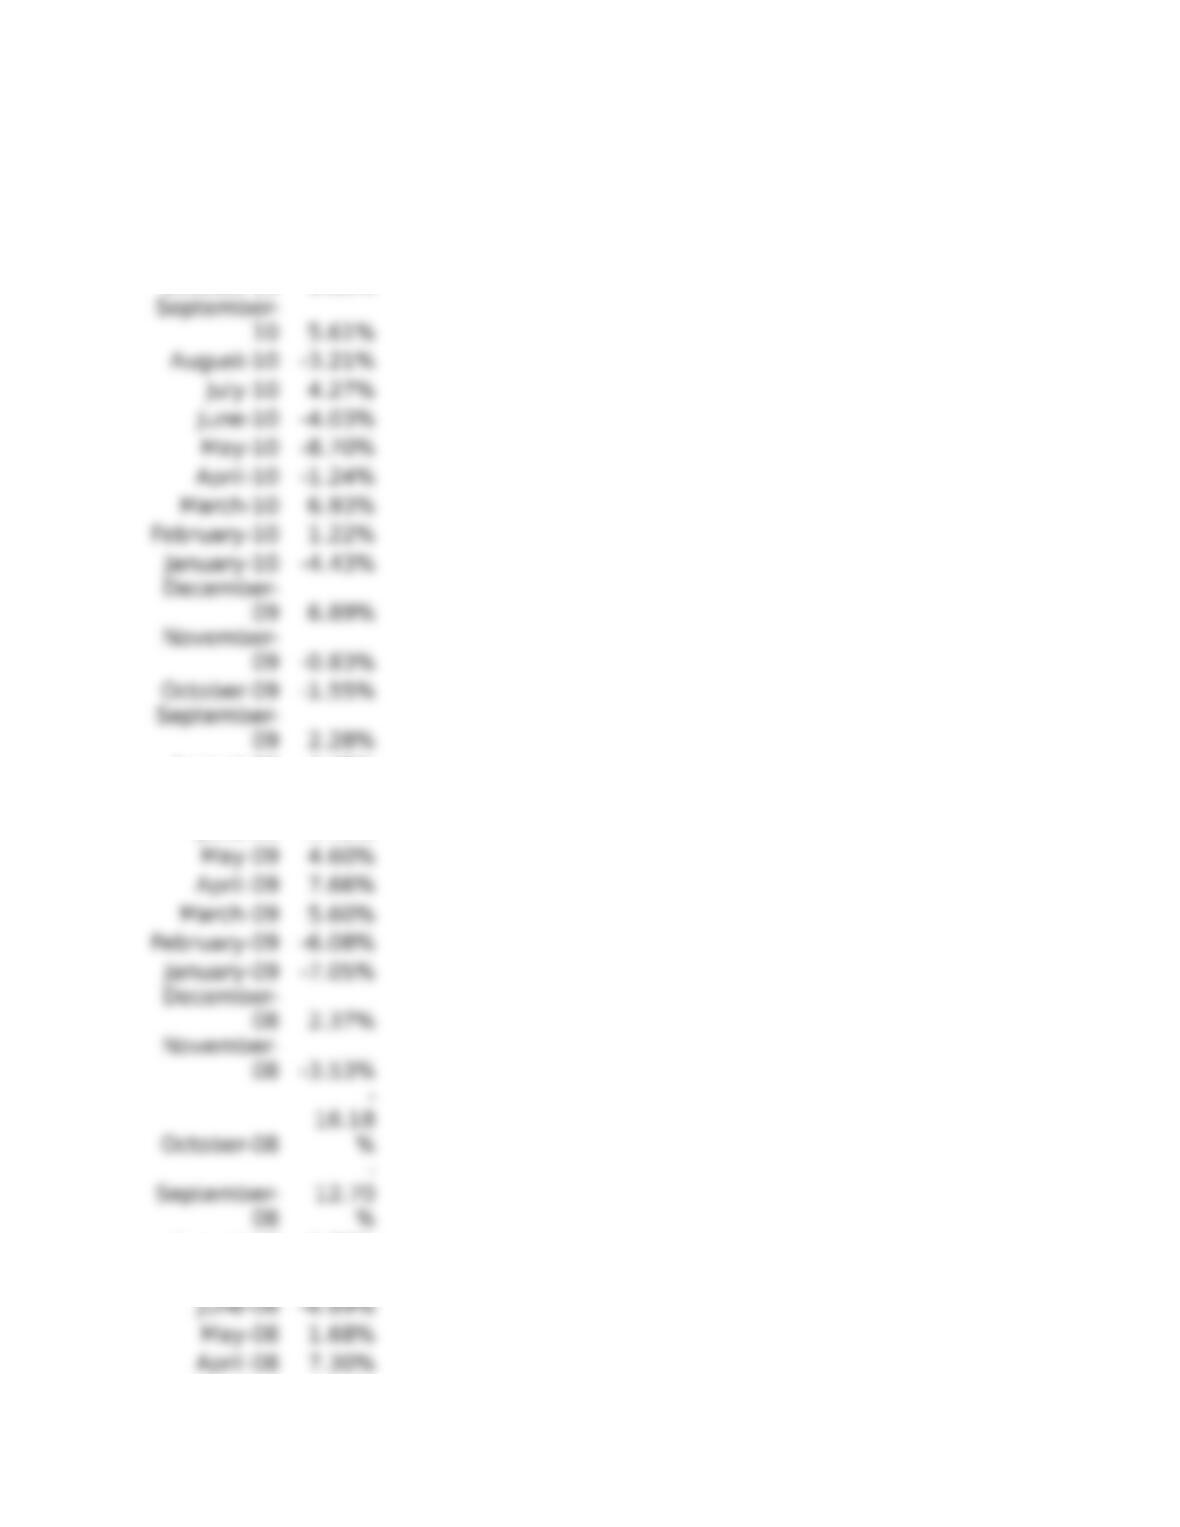
9-35 Excel Problem Following are the monthly returns for October 2007 to March 2013 of three
international stock indices; All Ordinaries of Australia, Nikkei 225 of Japan, and FTSE 100 of
England.
All
Ordinari
NIKKEI
December-11 -1.76% 0.25% 1.22%
November-11 -4.03% -6.16%
–
0.70%
October-11 7.13% 3.31% 8.11%
September-11 -6.86% -2.85%
–
4.93%
7.23%
July-11 -3.42% 0.17%
–
2.19%
June-11 -2.70% 1.26%
–
0.74%
May-11 -2.25% -1.58%
–
1.32%
April-11 -0.60% 0.97% 2.73%
–
October-10 2.08% -1.78% 2.28%
September-10 4.46% 6.18% 6.19%
August-10 -1.52% -7.48%
–
0.62%
July-10 4.22% 1.65% 6.94%
June-10 -2.89% -3.95%
–
5.23%
–
December-09 3.55% 12.85% 4.28%
November-09 1.48% -6.87% 2.90%
October-09 -1.95% -0.97%
–
1.74%
September-09 5.69% -3.42% 4.58%
August-09 5.52% 1.31% 6.52%
February-09 -5.21% -5.32%
–
7.70%
January-09 -4.95% -9.77%
–
6.42%
December-08 -0.36% 4.08% 3.41%
November-08 -7.78% -0.75%
–
2.04%
October-08 -14.00% -23.83%
–
10.71
%
September-08 -11.20% -13.87%
–
13.02
%
August-08 3.22% -2.27% 4.15%
–
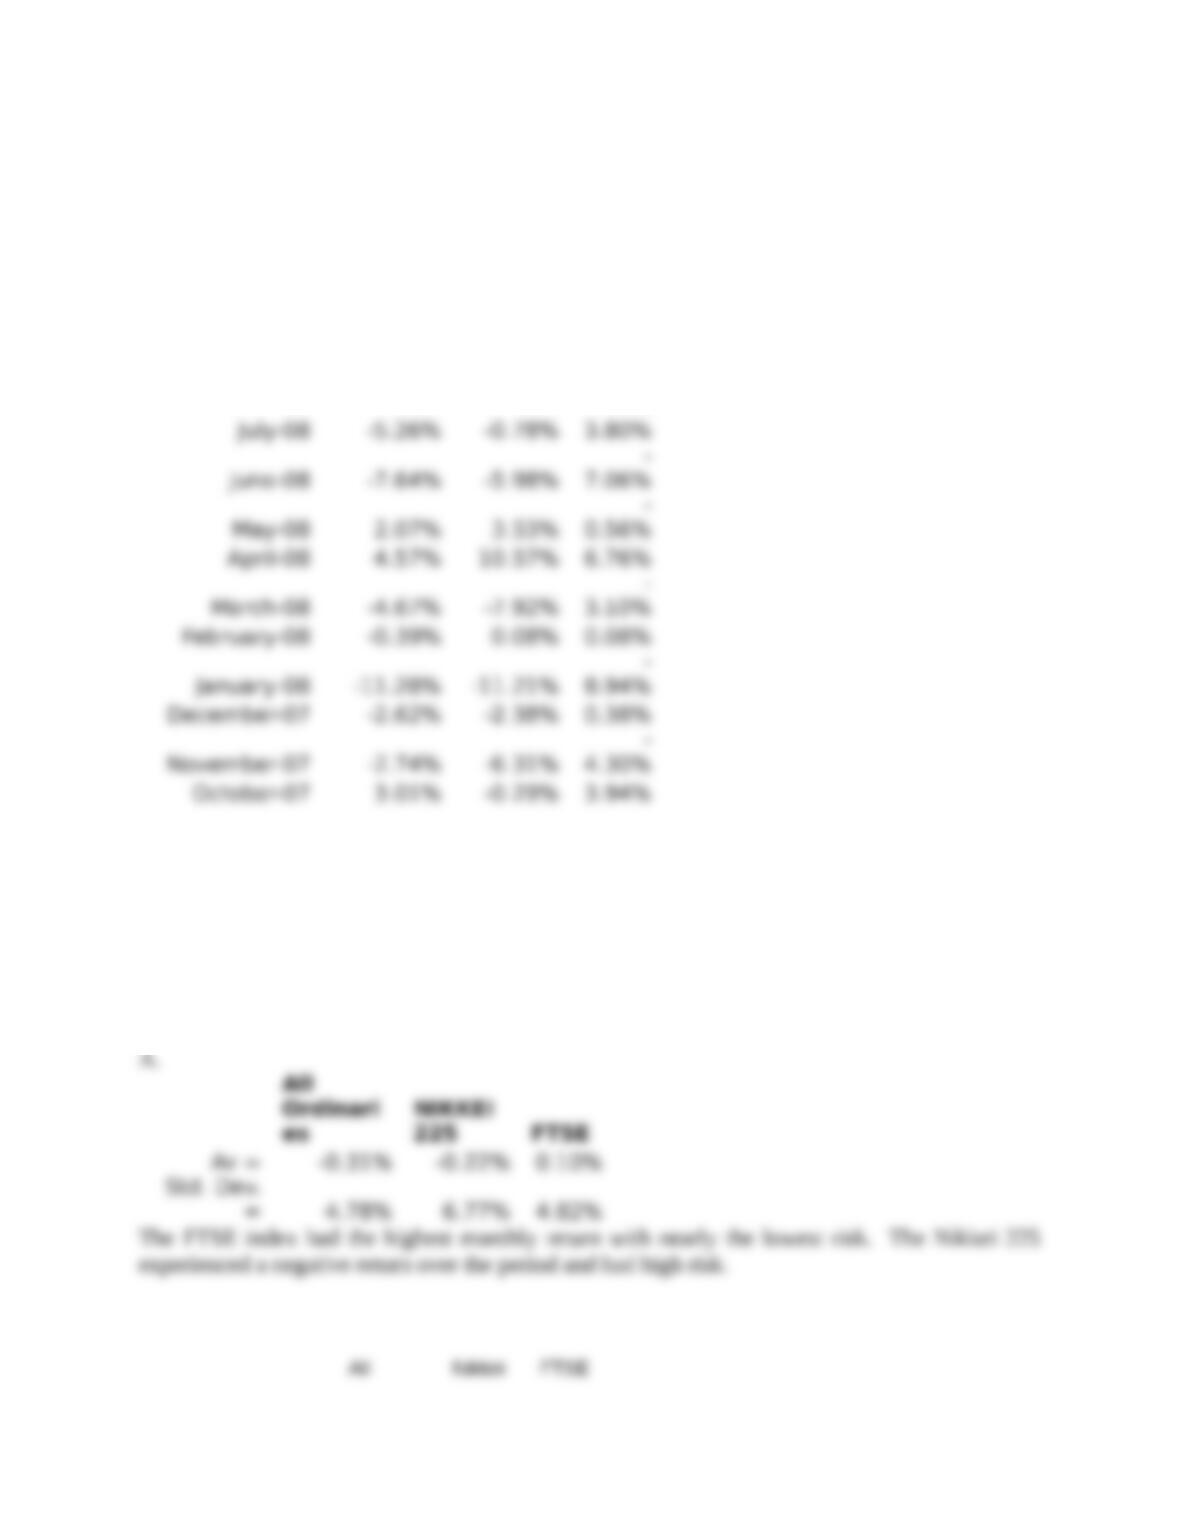
A. Compute and compare each indices’ monthly average return and standard deviation.
B. Compute the correlation between (i) All Ordinaries and Nikkei 225, (ii) All Ordinaries and
FTSE 100, and (iii) Nikkei 225 and FTSE 100, and compare them.
C. Form a portfolio consisting of one third of each of the indices and show the portfolio return
each year, and the portfolio’s return and standard deviation.
B. Correlations
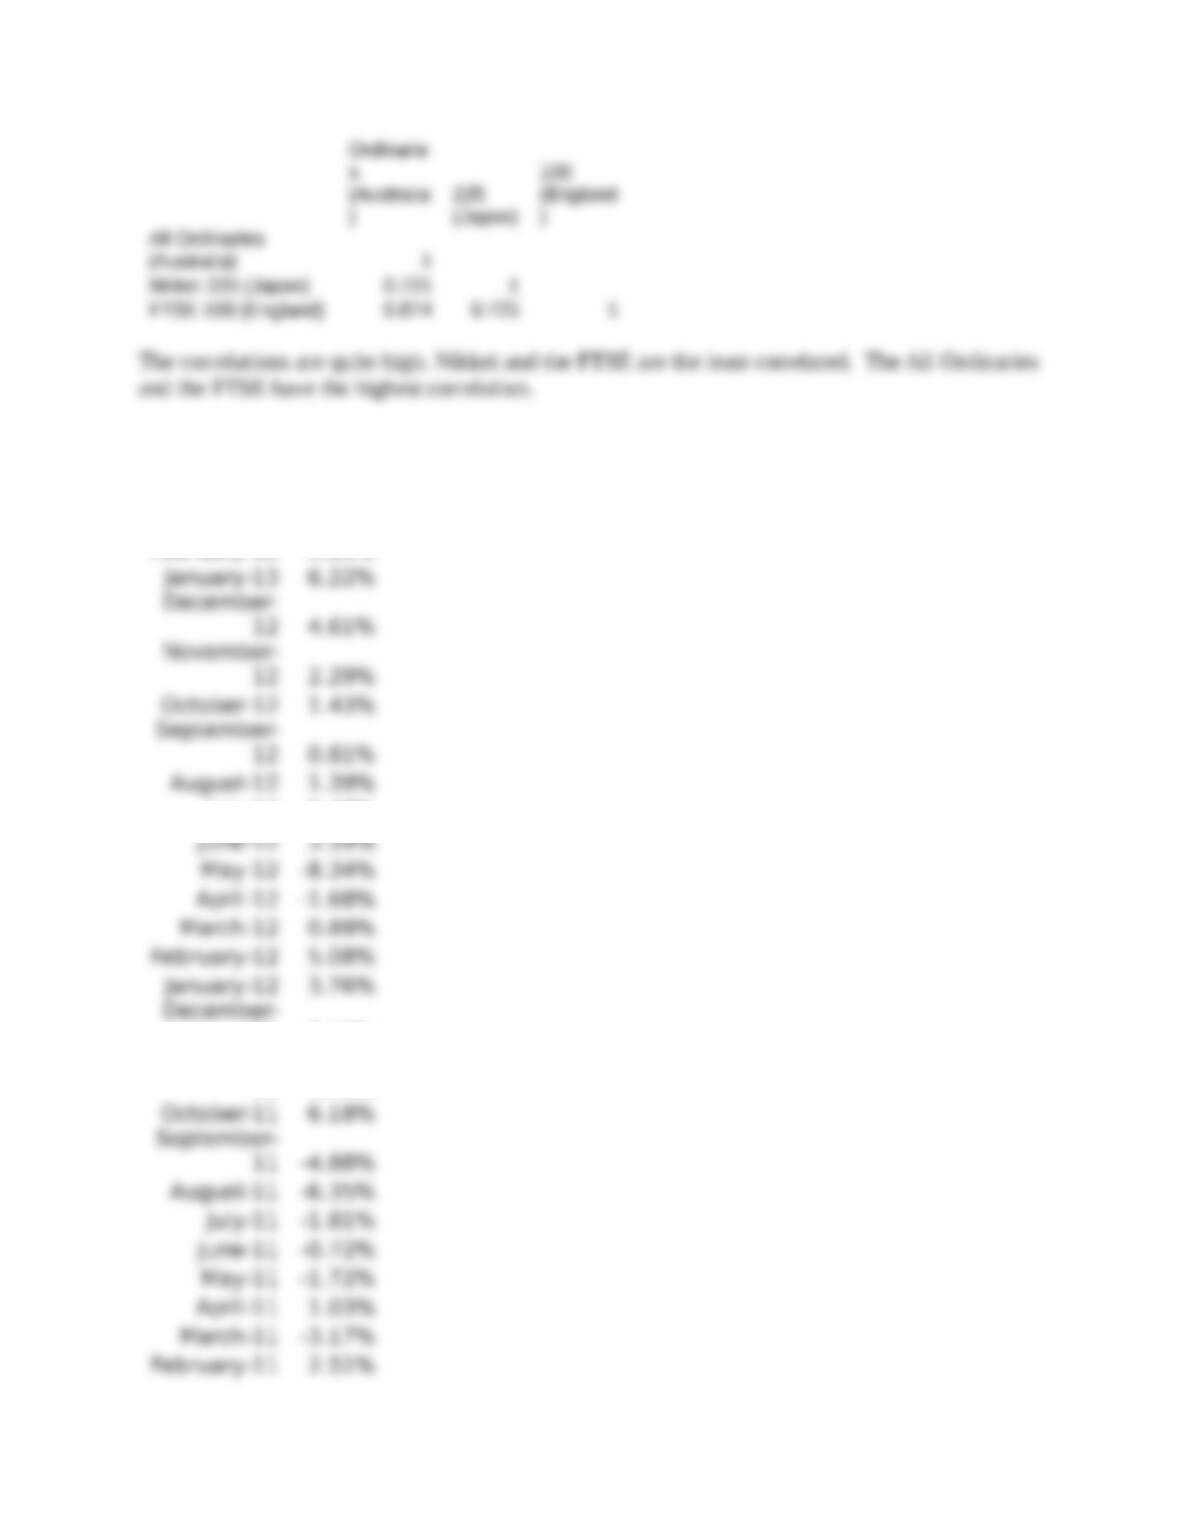
C.
Date
Portfo
lio
March-13 1.77%
July-12 0.47%
11 -0.10%
November–
11 -3.63%
January-11 -0.16%
December–
10 4.44%
November–
10 1.40%
August-09 4.45%
July-09 6.70%
June-09 1.43%
August-08 1.70%
July-08 -3.28%
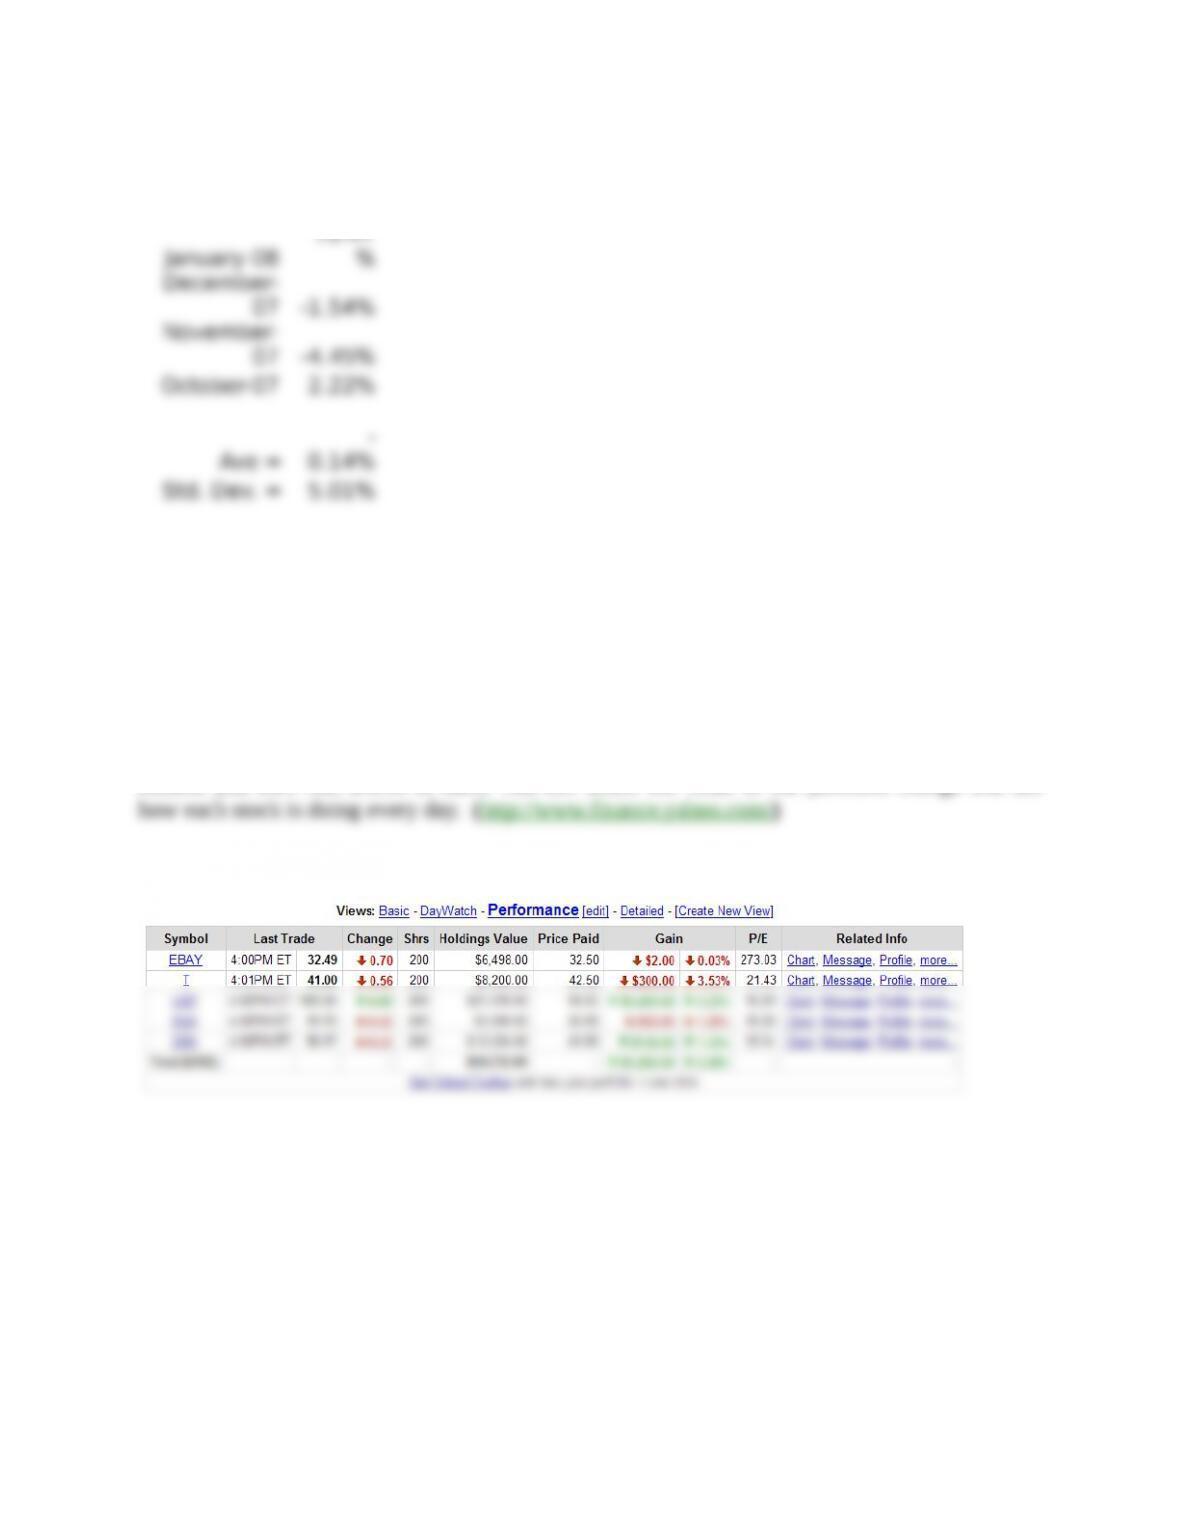
March-08 -5.23%
February-08 -0.08%
–
research it!
Following a Portfolio
Following stocks in a portfolio is easier than ever. Many financial websites have the capability to
follow the stocks in your portfolio over time. Just enter your stocks, the number of shares, your
purchase price, and your commission cost and you can see how your portfolio is doing. These
portfolio managers will update your portfolio as stock prices change, minute to minute. Yahoo!
Finance has a portfolio management tool. Go to the site and start a portfolio to watch (which
requires free registration). Try entering symbols EBAY, T, LMT, DUK, and GSK. As a start,
The portfolio might look something like this:
integrated mini-case: Diversifying with Other Asset Classes
Many more types of investments are available besides stocks, bonds, and cash securities. Many
people invest in real estate and in precious metals, primarily gold. What are the risk and return
characteristics of these investments and do they provide diversification opportunities to the
typical stock investor?
You can invest in real estate in many ways. You can build properties, own rental units,
and trade raw land. These activities take enormous time and expertise. One of the easiest ways
to invest in real estate is through real estate investment trusts (REITs) that trade like stocks on
the stock exchanges. A REIT represents ownership in a portfolio consisting of a pool of real
estate assets. An index of all REITs is a good measure of the performance of the real estate
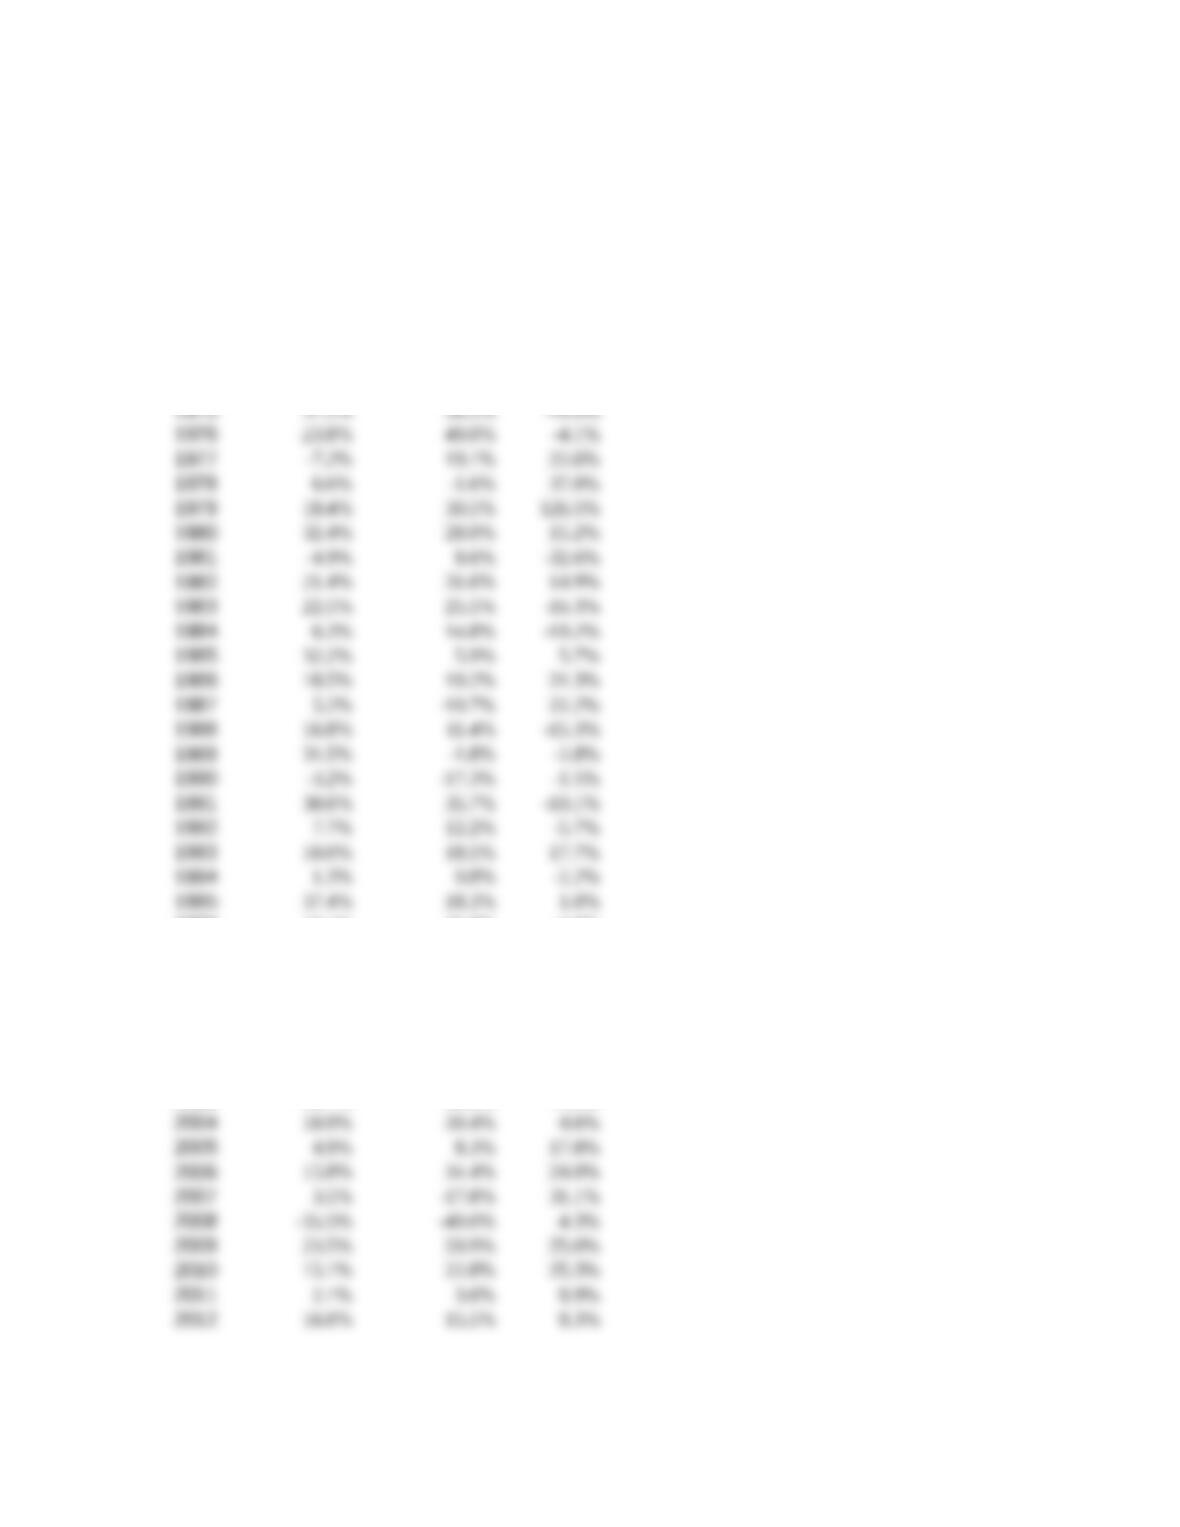
market. The following table shows the annual returns for the All REITs Index alongside the
returns of the S&P 500 Index.
S&P 500
Index
All REITs
Index
Gold
Price
1996 23.1% 35.8% -4.6%
1997 33.4% 18.9% -21.4%
1998 28.6% -18.8% -0.8%
1999 21.0% -6.5% 0.9%
2000 -9.1% 25.9% -5.4%
2001 -11.9% 15.5% 0.7%
2002 -22.1% 5.2% 25.6%
Gold has been a highly sought-after asset all over the world, and has retained at least
some economic value over thousands of years. The United States has had a very chaotic history
with gold. Americans have sought to “strike it rich” through gold rushes in North Carolina (early
1800s), California and Nevada (mid-1800s), and Alaska (late 1800s). Struggling in the Great
Depression, President Franklin D. Roosevelt ordered U.S. citizens to hand in all the gold they
possessed. The ban on U.S. citizens owning gold was not lifted until the end of 1974. The table
also shows the return from gold prices.
The returns for stocks, real estate, and gold are all volatile. However, during many years,
the return of one asset is up while the others are down. This looks promising for diversification
opportunities.
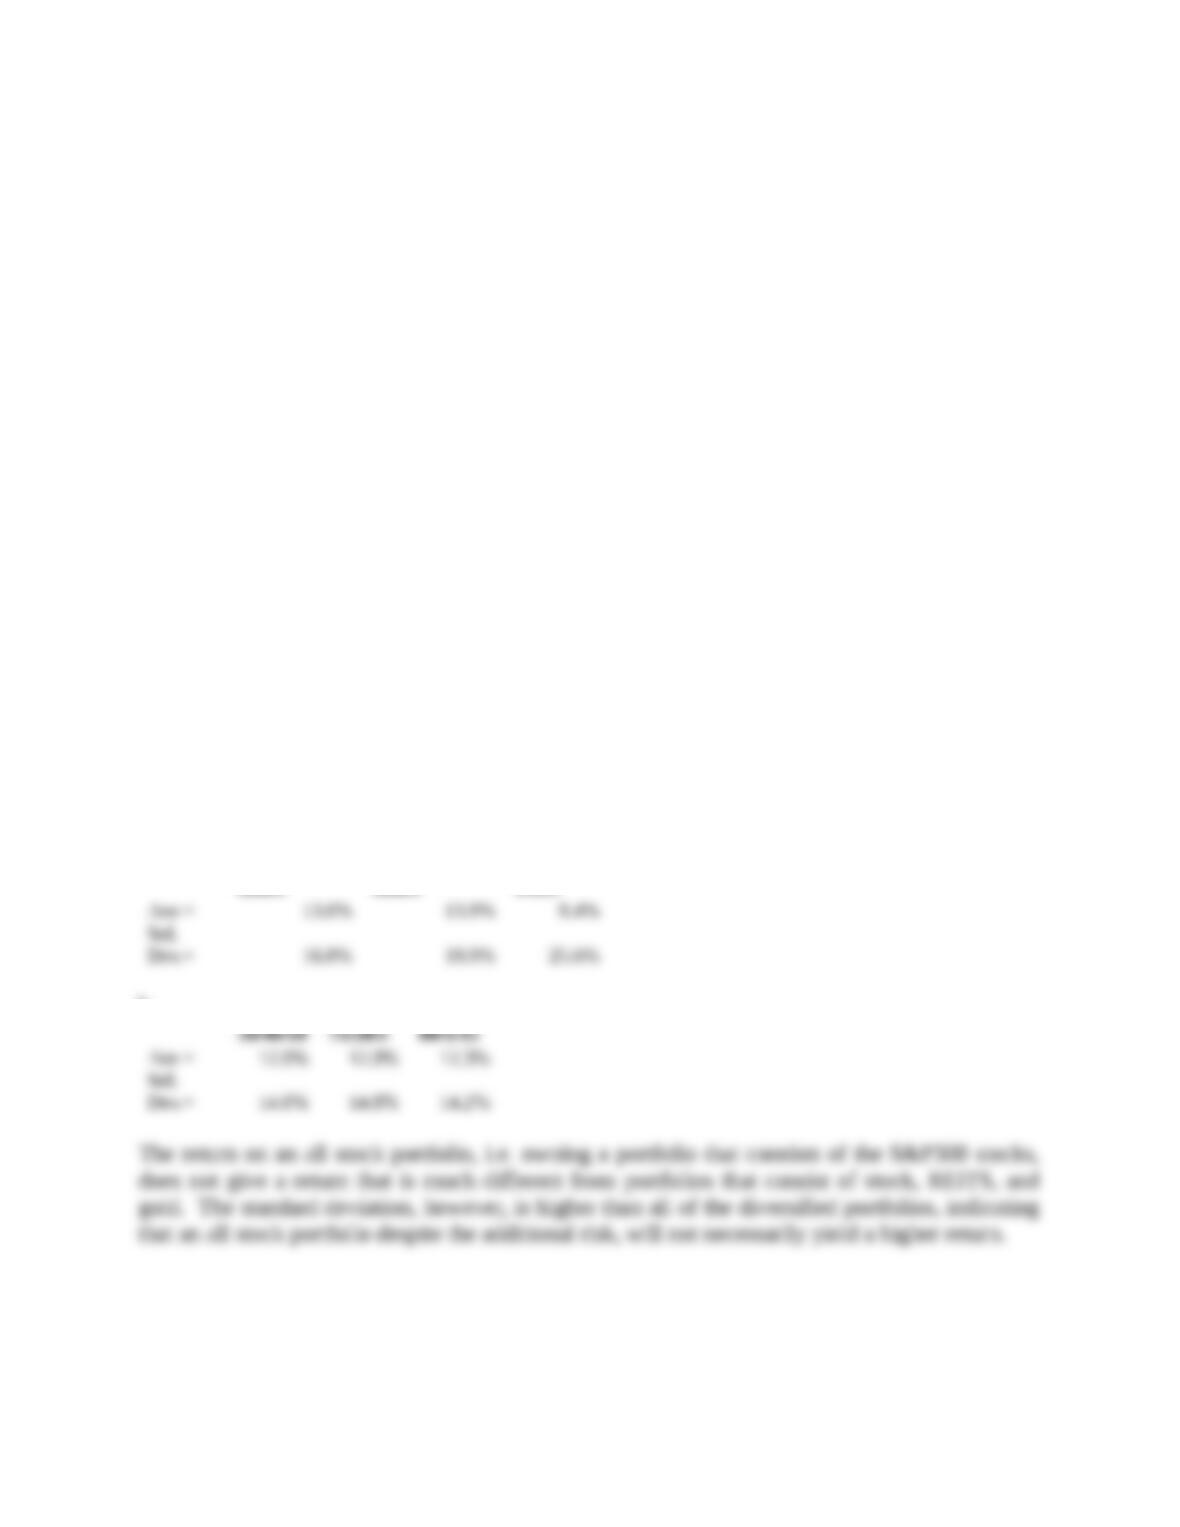
a. Using a spreadsheet, compute the average return and standard deviation of each of the
three asset classes.
b. Compute the annual returns of a portfolio consisting of 50 percent stocks / 40 percent real
estate / 10 percent gold. What is the average return and standard deviation of this portfolio?
Also compute the average return and standard deviation of the following portfolios: 75
percent/20 percent/5 percent and 80 percent/5 percent/15 percent. How do these portfolios
perform compared to owning just stocks?
c. Plot the average return and standard deviation of the three assets and the three portfolios
on a risk-return graph like Figure 9.3.
SOLUTION:
a.
S&P 500
All REITs
Gold
b.

c.
8.4%
13.9%
13.0%
12.3%
12.9%
12.9%
50/40/10
75/20/5
80/5/15
S&P 500 Index
All REITs
Index
Gold Price
Standard Deviation of Annual Returns
Average Return