Unlock document.
This document is partially blurred.
Unlock all pages and 1 million more documents.
Get Access
Chapter 04 - Time Value of Money 1: Analyzing Single Cash Flows
LG8 4-32 Solving for Time How long will it take $2,000 to reach $5,000 when it grows at 10 percent
per year?
advanced problems
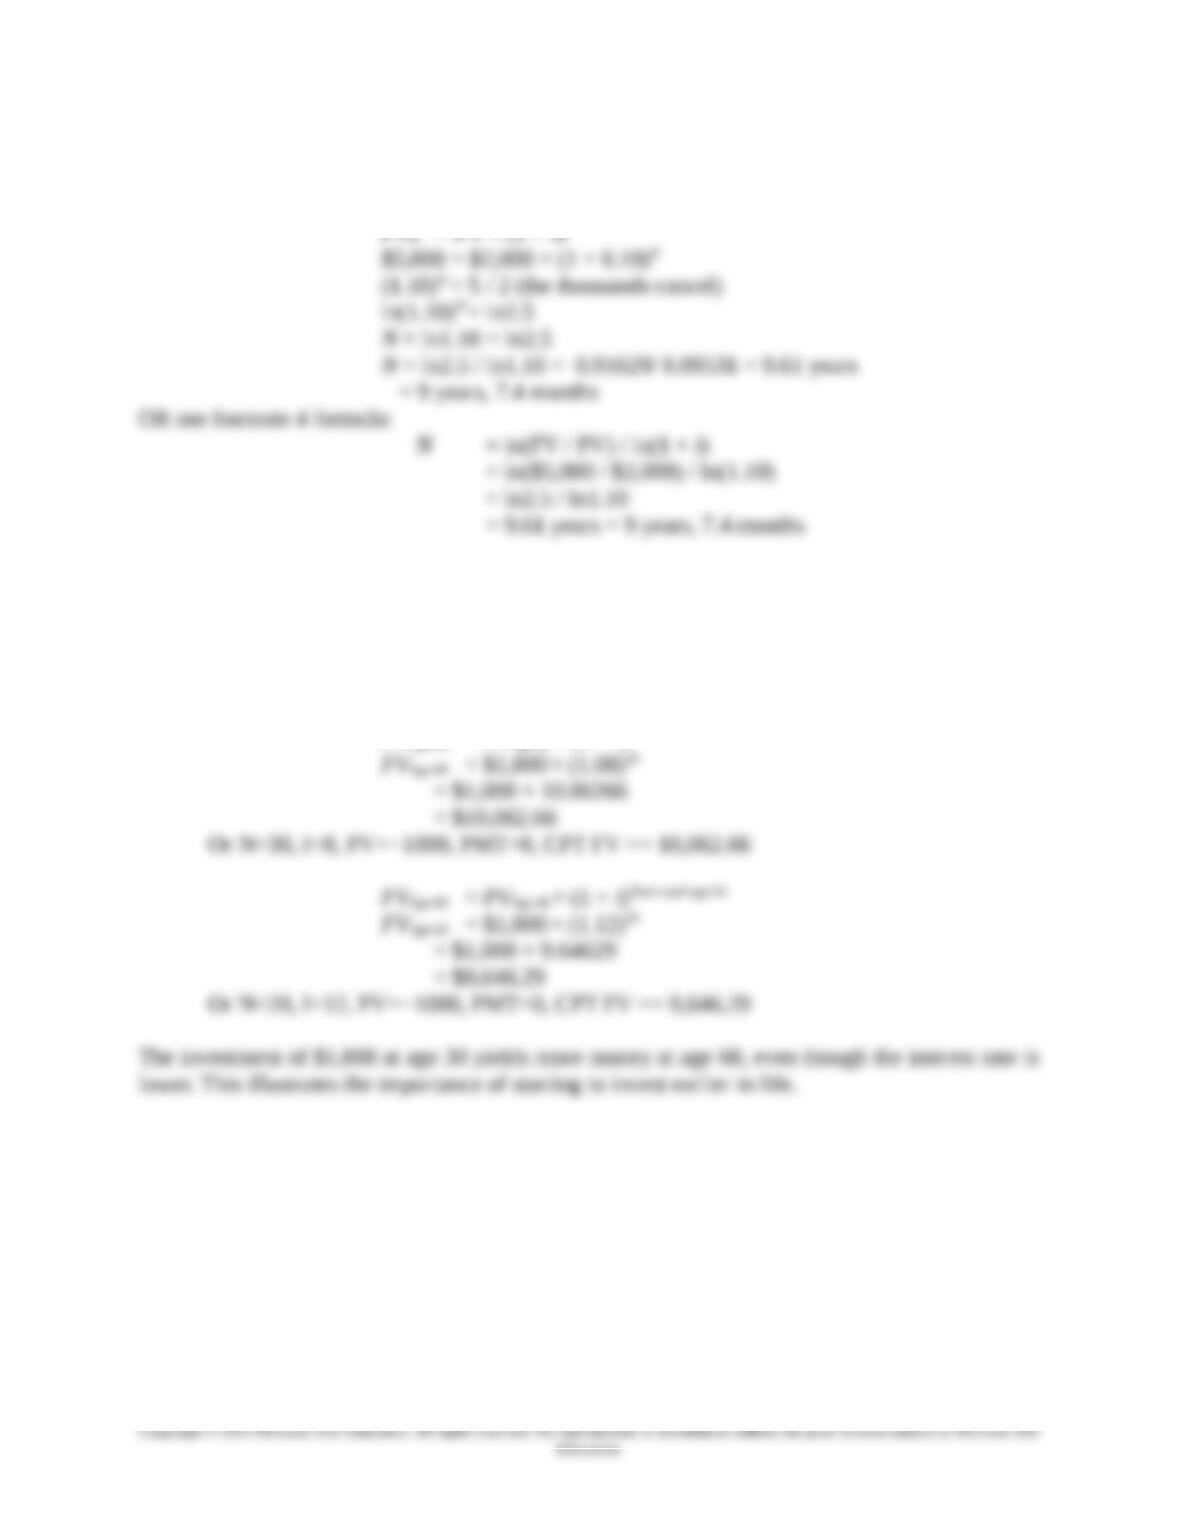
LG2 4-33 Future Value At age 30 you invest $1,000 that earns 8 percent each year. At age 40
you invest $1,000 that earns 12 percent per year. In which case would you have more money at
age 60?
4-1
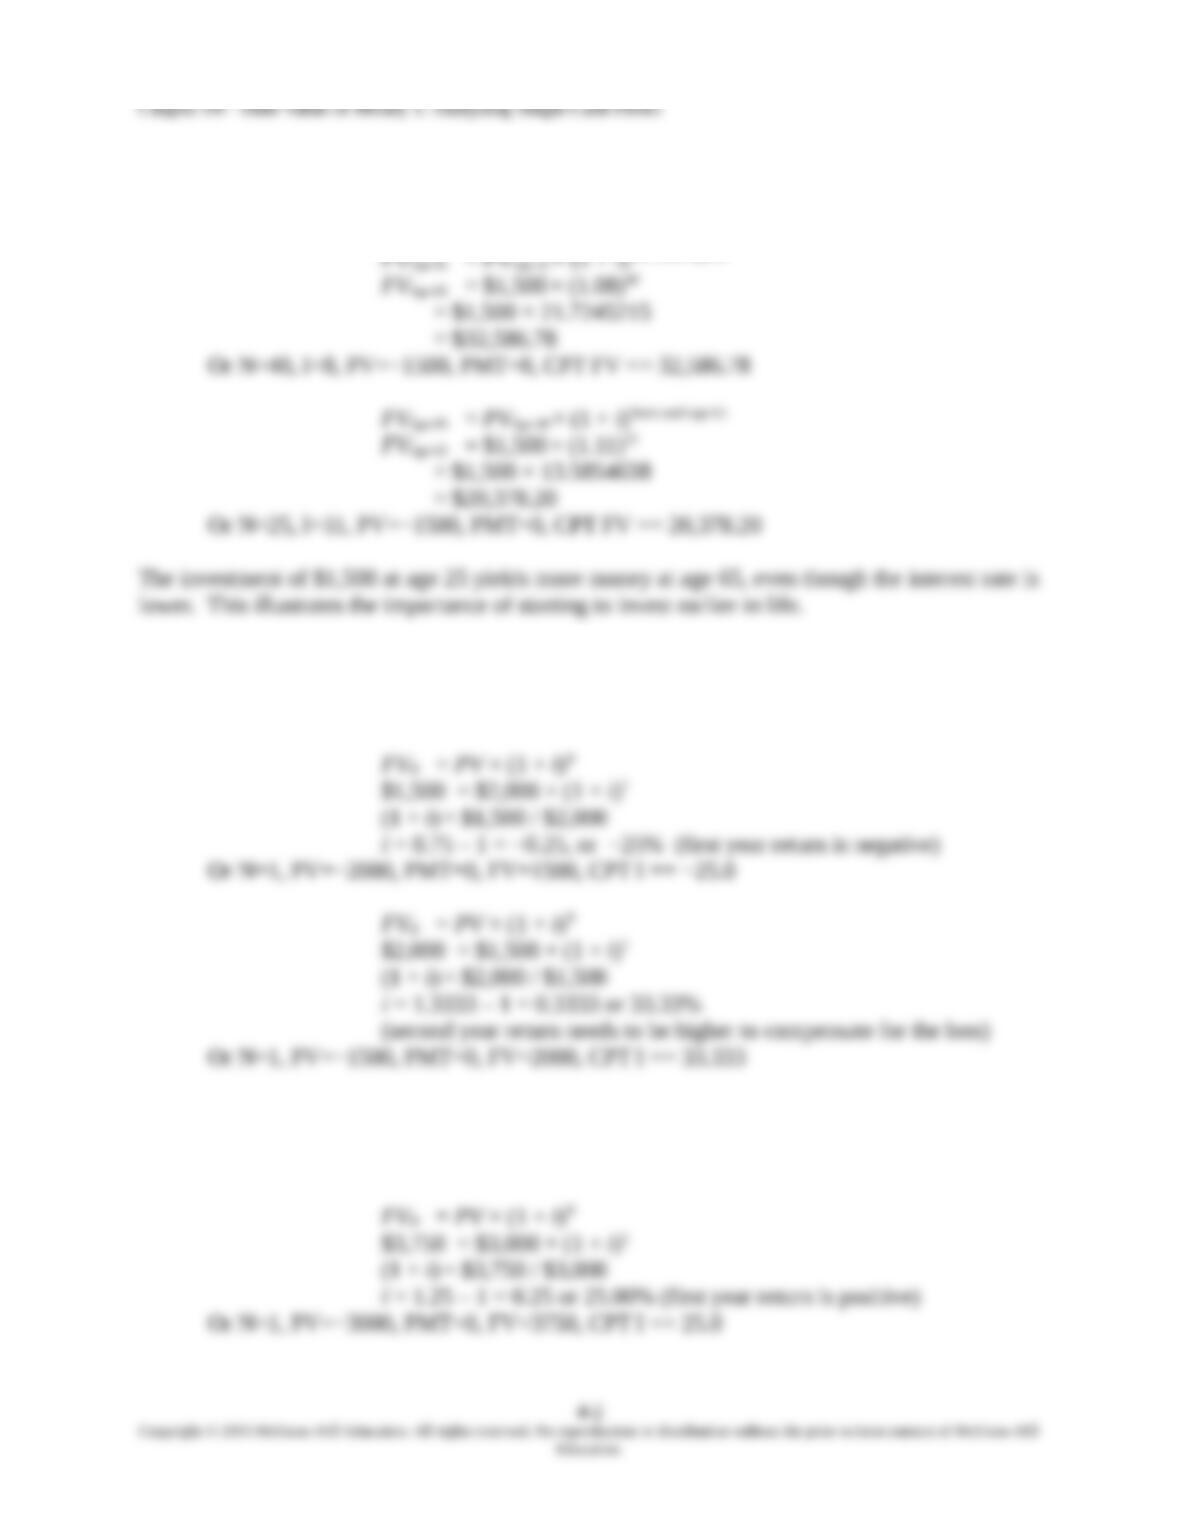
LG2 4-34 Future Value At age 25 you invest $1,500 that earns 8 percent each year. At age 40 you
invest $1,500 that earns 11 percent per year. In which case would you have more money at age
65?
LG7 4-35 Solving for Rates You invested $2,000 in the stock market one year ago. Today, the
investment is valued at $1,500. What return did you earn? What return would you need to get
next year to break even overall?
LG7 4-36 Solving for Rates You invested $3,000 in the stock market one year ago. Today, the
investment is valued at $3,750. What return did you earn? What return would you suffer next
year for your investment to be valued at the original $3,000?
Chapter 04 - Time Value of Money 1: Analyzing Single Cash Flows
LG7 4-37 Solving for Rates What annual rate of return is earned on a $4,000 investment made in
year 2 when it grows to $6,500 by the end of year seven?
LG7 4-38 Solving for Rates What annual rate of return is implied on a $2,500 loan taken next year
when $3,500 must be repaid in year 4?
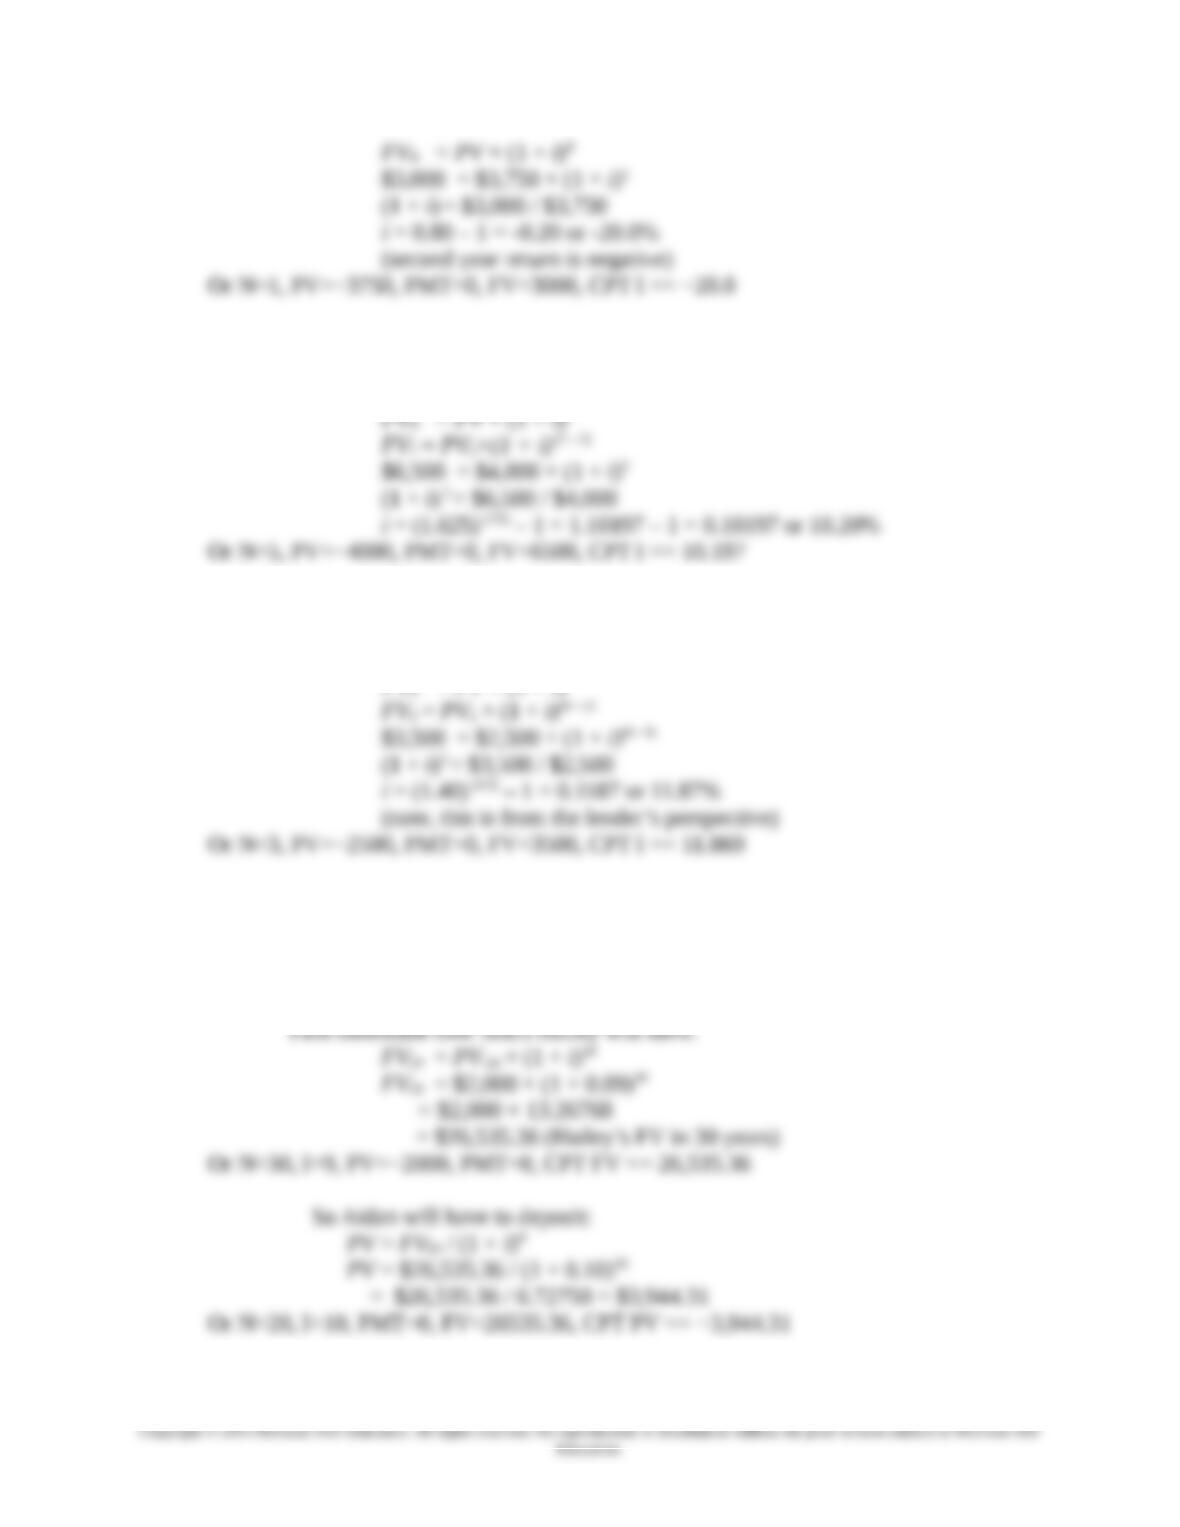
LG2&4 4-39 General TVM Ten years ago, Hailey invested $2,000 and locked in a 9 percent annual
interest rate for 30 years (end 20 years from now). Aidan can make a 20-year investment today
and lock in a 10 percent interest rate. How much money should he invest now in order to have
the same amount of money in 20 years as Hailey?
4-3
LG2&4 4-40 General TVM Ten years ago, Hailey invested $3,000 and locked in an 8 percent annual
interest rate for 30 years (end 20 years from now). Aidan can make a 20-year investment today
and lock in a 10 percent interest rate. How much money should he invest now in order to have
the same amount of money in 20 years as Hailey?
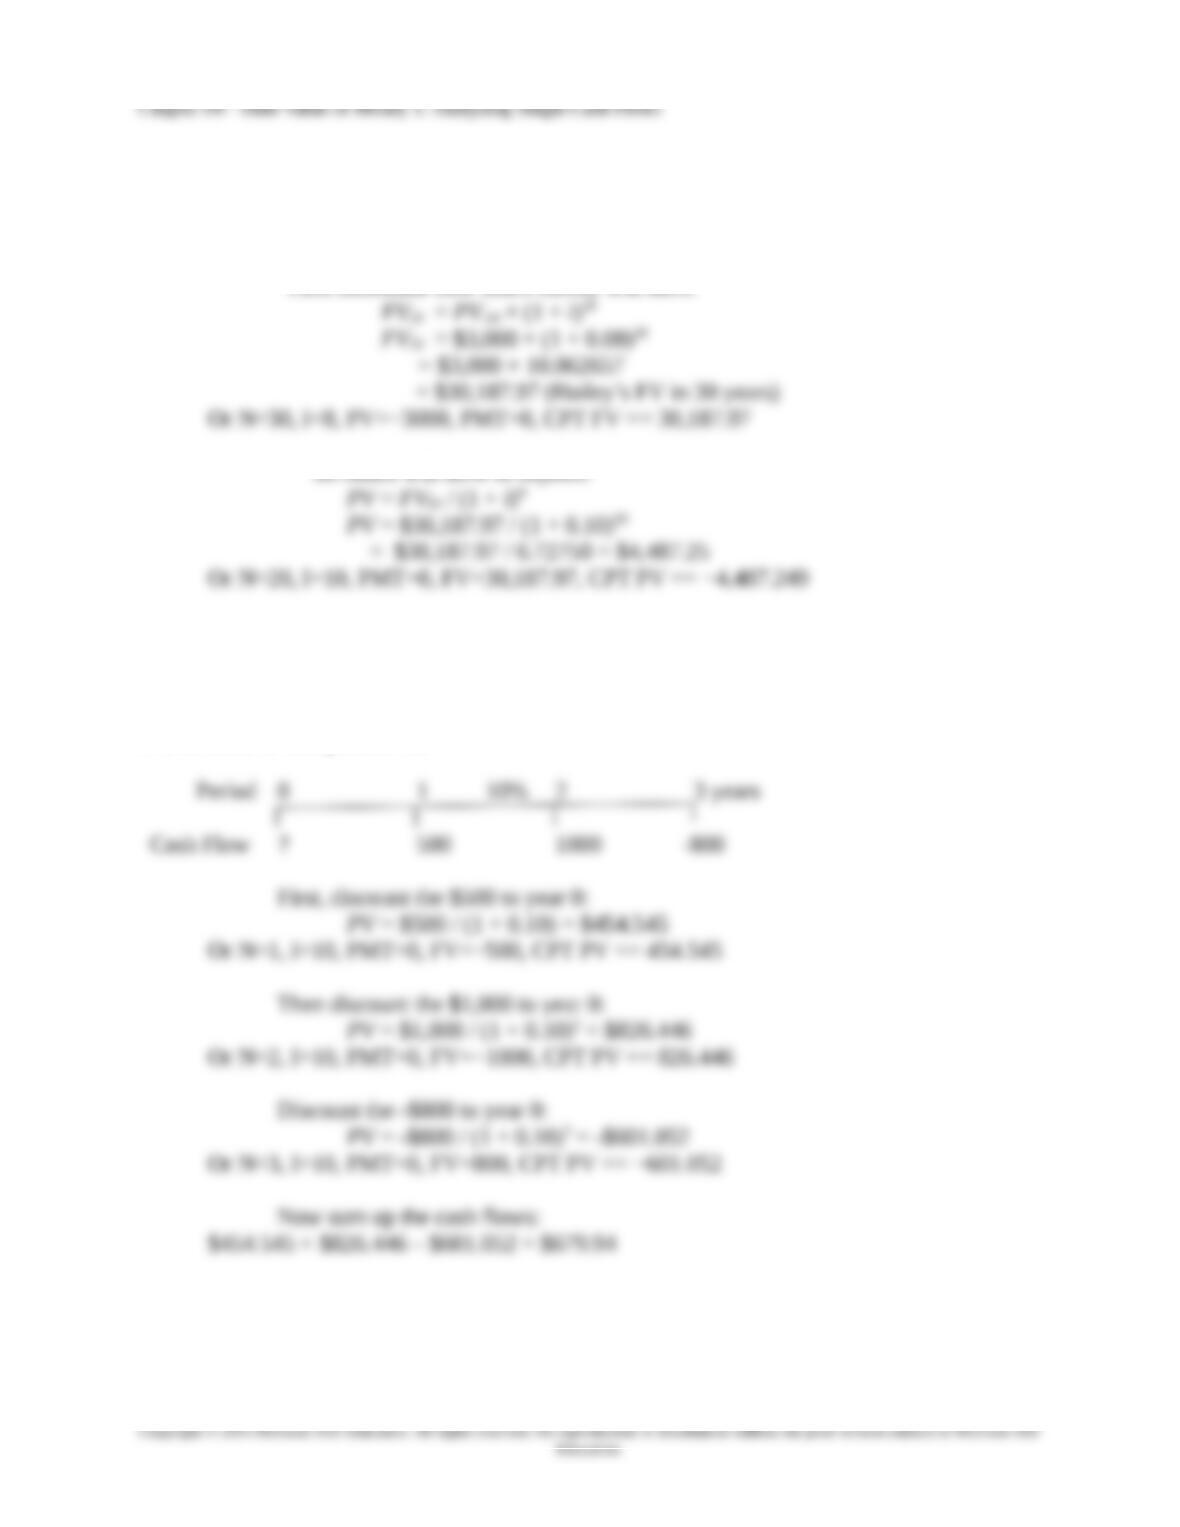
LG5 4-41 Moving Cash Flows You are scheduled to receive a $500 cash flow in one year, a $1,000
cash flow in two years, and pay an $800 payment in three years. If interest rates are 10 percent
per year, what is the combined present value of these cash flows?
The timeline of this problem is:
4-4
Chapter 04 - Time Value of Money 1: Analyzing Single Cash Flows
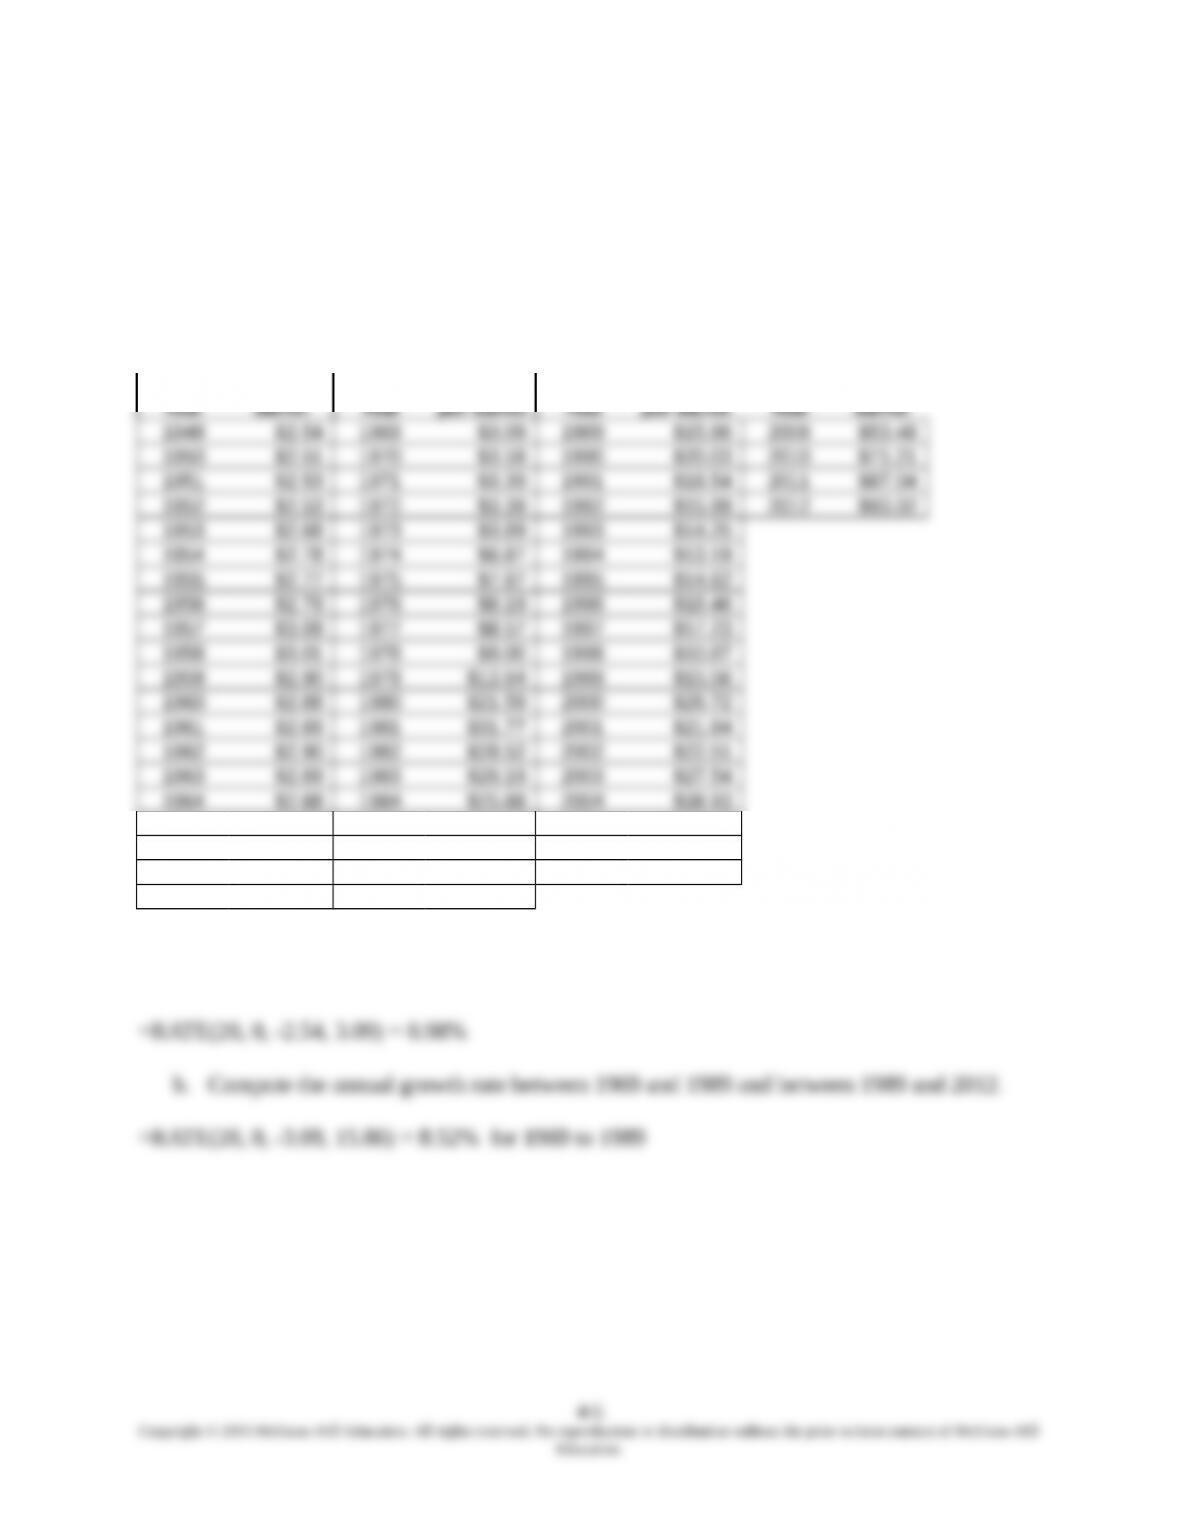
4-42 Spreadsheet Problem Oil prices have increased a great deal in the last decade. The table
below shows the average oil price for each year since 1949. Many companies use oil products as
a resource in their own business operations (like airline firms and manufacturers of plastic
products). Managers of these firms will keep a close watch on how rising oil prices will impact
their costs. The interest rate in the PV/FV equations can also be interpreted as a growth rate in
sales, costs, profits, and so on (see Example 4-5).
Average Oil Prices
per
per
1965 $2.86 1985 $24.09 2005 $46.47
1966 $2.88 1986 $12.51 2006 $58.30
1967 $2.92 1987 $15.40 2007 $64.67
1968 $2.94 1988 $12.58 2008 $91.48
a. Using the 1949 oil price and the 1969 oil price, compute the annual growth rate in oil
prices during those 20 years.
Chapter 04 - Time Value of Money 1: Analyzing Single Cash Flows
research it!
What kind of returns might you expect in the stock market? One way to measure how the stock
market has performed is to examine the rate of return of the S&P 500 Index. To see historical
prices of the S&P 500 Index, go to Yahoo! Finance (finance.yahoo.com) and click on the “S&P
500” link on the left hand side. Then click “Historical Prices” on the left menu, select “Monthly”
prices and click the “Get Prices” button.
Compute the 1-year, 5-year, and 10-year returns over time. What do you conclude about
the returns during each of these periods?
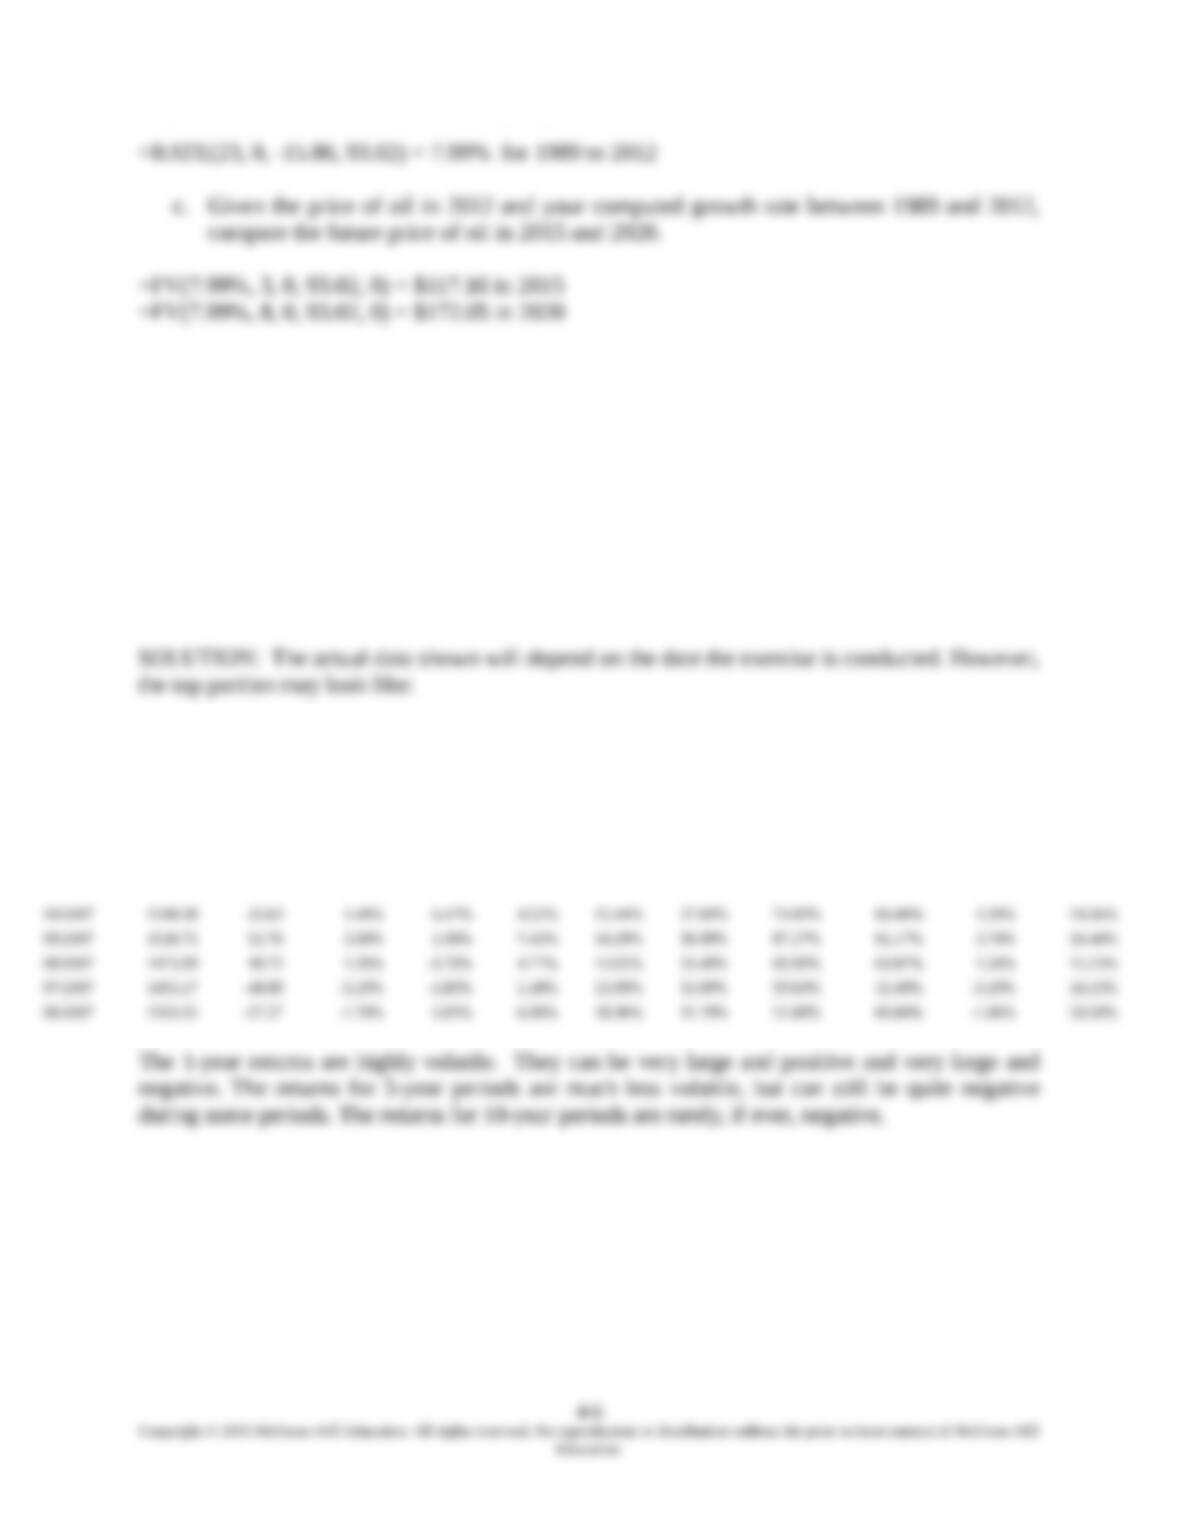
STANDARD & POOR'S INDEX SERVICES
S&P 500 MONTHLY RETURNS, OCTOBER 31, 2007
1 MONTH 12 MONTH
MONTH OF PRICE PRICE 1 MONTH 3MONTH 6MONTH 1 YEAR 3 YEAR 5 YEARS 10 YEARS TOTAL TOTAL
CLOSE CHANGE CHANGE CHANGE CHANGE CHANGE CHANGE CHANGE CHANGE RETURN RETURN
Chapter 04 - Time Value of Money 1: Analyzing Single Cash Flows
integrated mini-case Investing in Gold
People have had a fascination with gold for thousands of years. Archaeologists have discovered
gold jewelry in Southern Iraq dating to 3000 BC and gold ornaments in Peru dating to 1200 BC.
The ancient Egyptians were masters in the use of gold for jewelry, ornaments, and economic
exchange. By 1000 BC, squares of gold were a legal form of money in China. The Romans
issued a popular gold coin called the Aureus (aureus is the Latin word for gold). By 1100 AD,
gold coins had been issued by several European countries. Gold has been a highly sought-after
asset all over the world and has always retained at least some economic value over thousands of
years.
The United States has had a very chaotic history with gold. For example, in the Great
Depression, President Franklin D. Roosevelt banned the export of gold and ordered U.S. citizens
to hand in all the gold they possessed. It was not until the end of 1974 that the ban on gold
ownership by U.S. citizens was lifted. By 1986, the U.S. government’s attitude on gold
ownership had completely turned around, as evidenced by the resumption of the U.S. Mint’s
production of gold coins with the American Eagle. However, U.S. investors have little more than
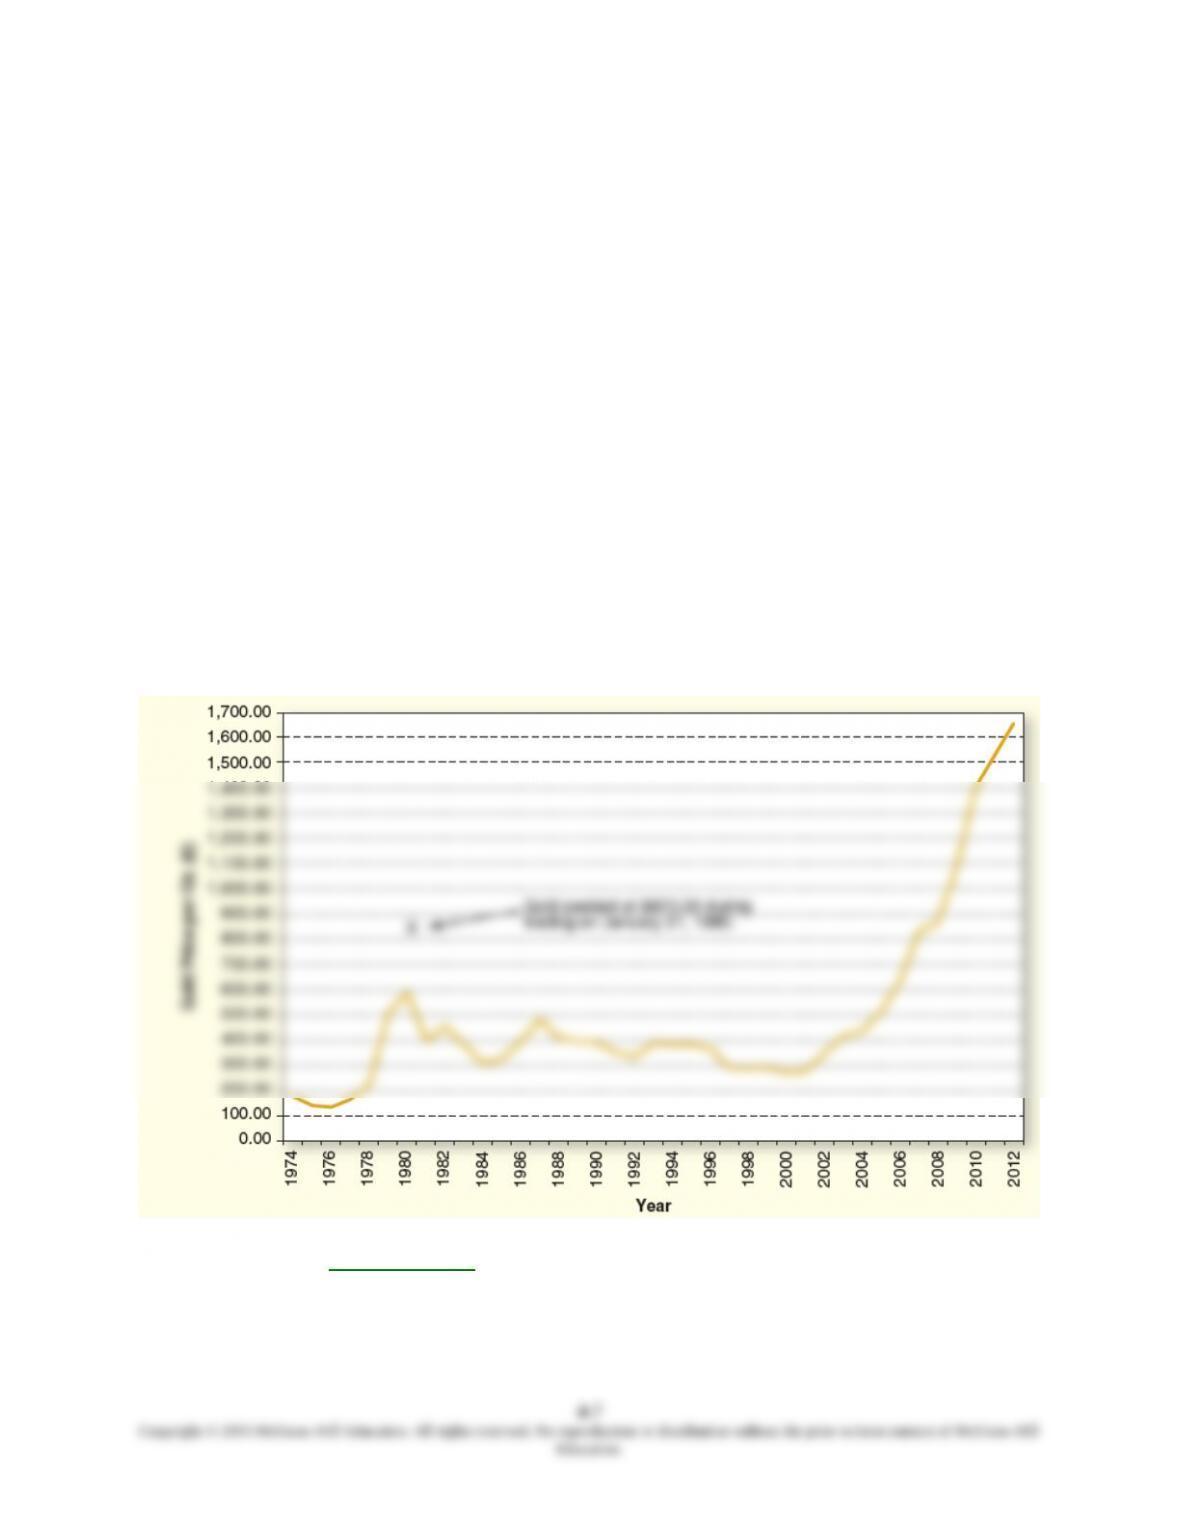
30 years of gold-investing experience. Figure 4.5 shows how the price of gold per ounce has
changed since 1974.
Figure 4.5 December Gold Prices Since 1974
Data Source: Kitco (www.kitco.com)
Chapter 04 - Time Value of Money 1: Analyzing Single Cash Flows
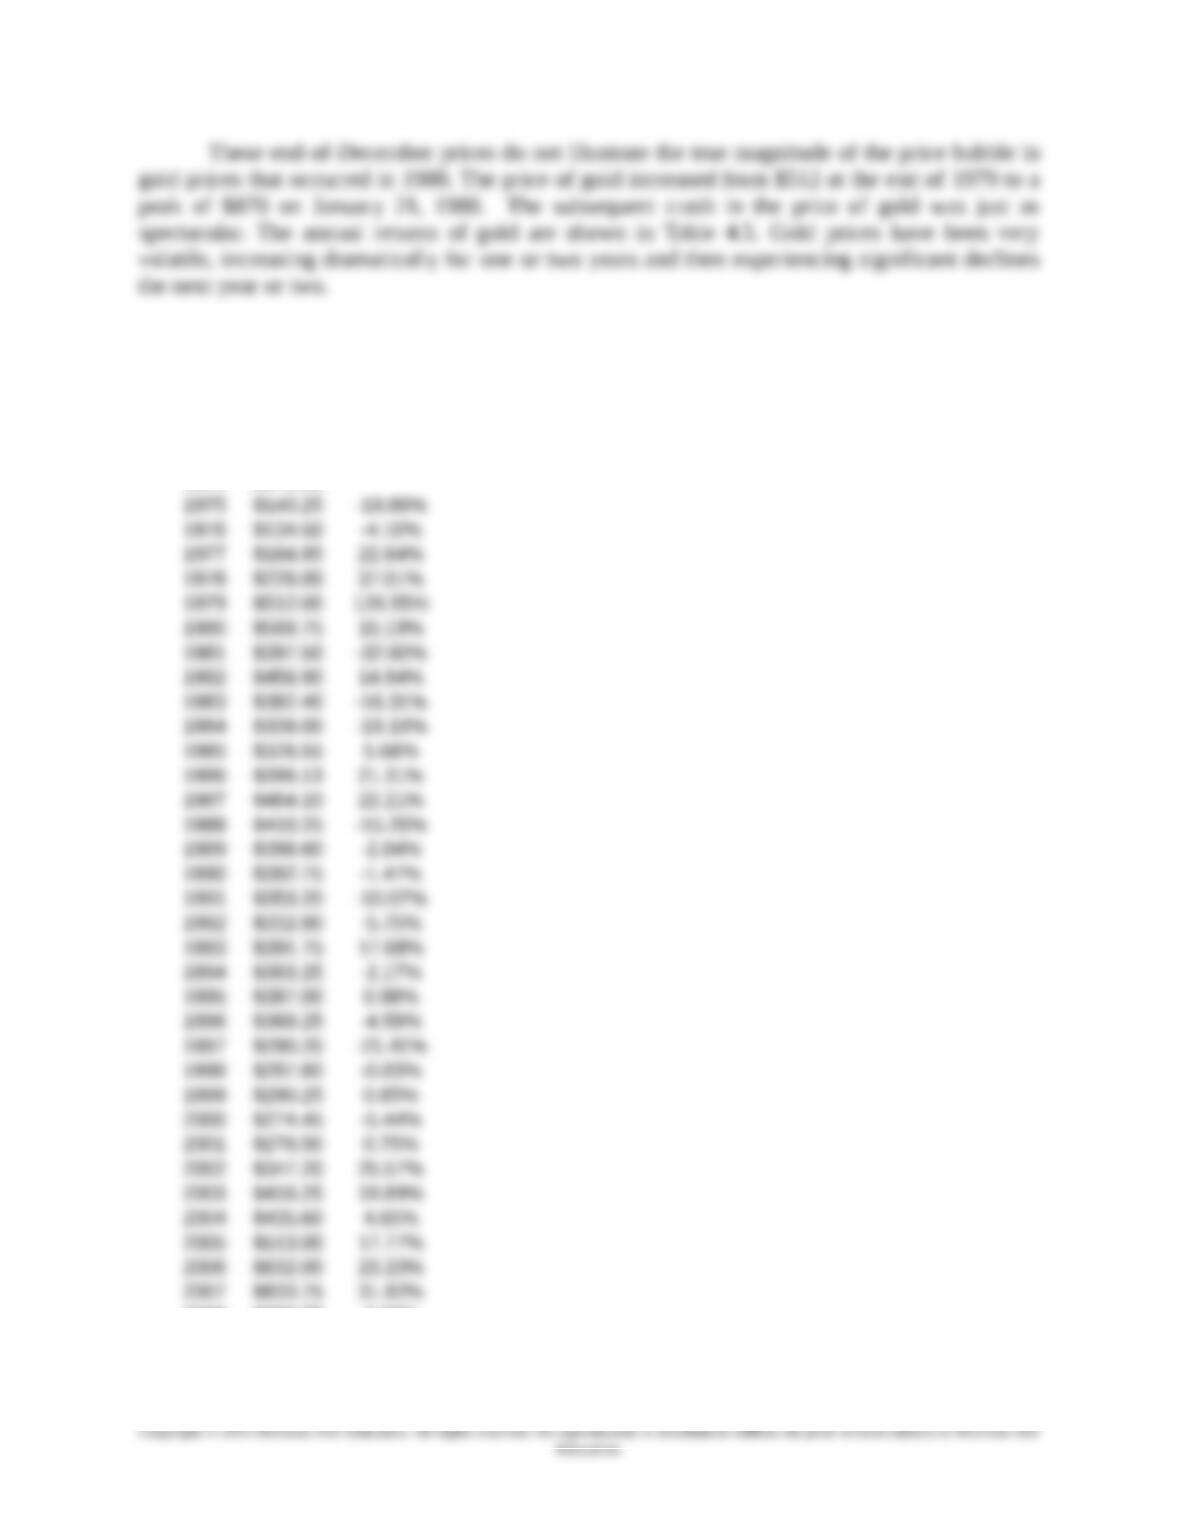
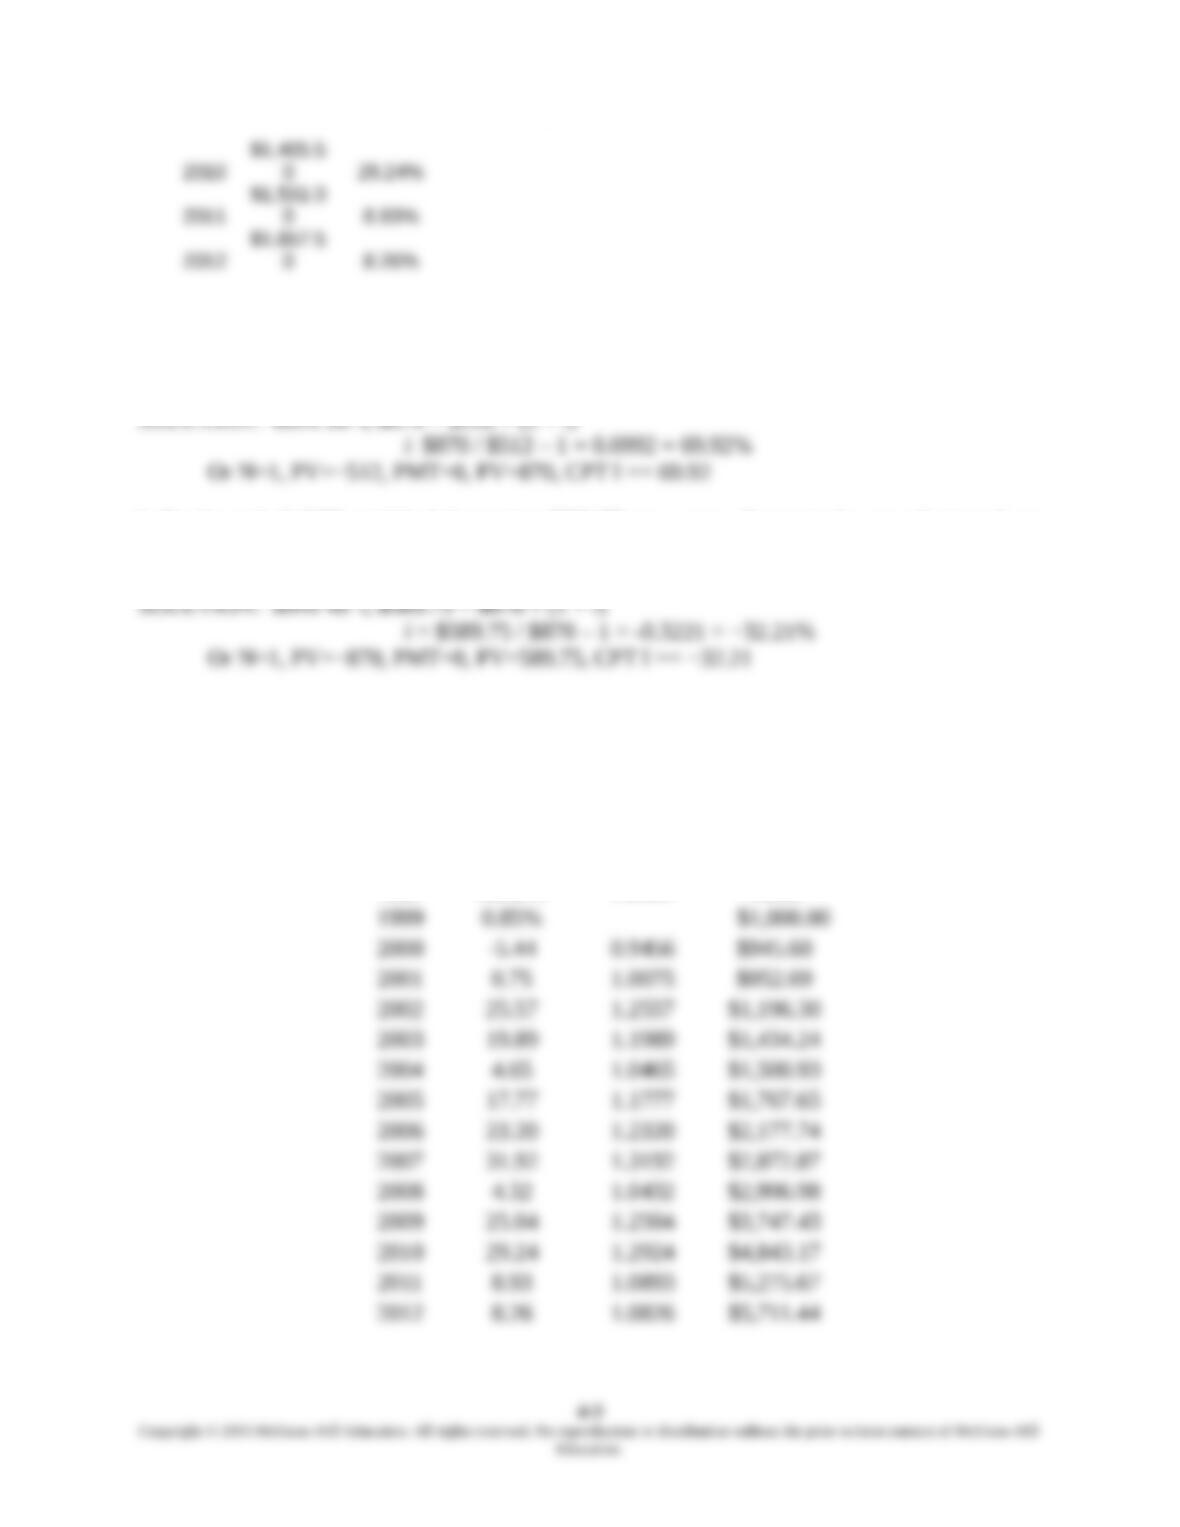
Table 4.5 Annual Gold Returns Since 1975
Decembe
r Annual
Year
Gold
Price
Gold
Return
2008 $869.75 4.32%
2009
$1,087.5
0 25.04%
4-8
Chapter 04 - Time Value of Money 1: Analyzing Single Cash Flows
$1,405.5
a. Compute the rate of return in gold prices that occurred during the three weeks between the last
day of 1979 and the January 21, 1980 peak.
b. By the end of 1980, gold had dropped to $589.75 per ounce. Compute the rate of return from
the peak to the end of 1980.
c. Imagine that you invested $1,000 in gold at the end of 1999. Use the returns in Table 4.5 to
determine the value of the investment at the end of 2012.
SOLUTION:
Annual Investment
Year
Gold
Return Factor Value


