Chapter 19 – International Corporate Finance
LG3 19-23 Triangular Arbitrage The U.S. dollar spot exchange rate with the Canadian dollar is $1 = CA$1.18. The
U.S. dollar and Swiss franc exchange rate is $1 = 1.219 francs. If the cross rate between the franc and Canadian
dollar is 1 franc = CA$0.9750 then show that an arbitrage is possible. What positions should be taken to profit from
the mispricing?
LG3 19-24 Triangular Arbitrage The U.S. dollar spot exchange rate with the Australian dollar is $1 = AU$1.2697. The
U.S. dollar and euro exchange rate is $1 = €0.7559. If the cross rate between the euro and Australian dollar is €1 =
19-25 Spreadsheet Problem Following are the Consumer Price Index inflation rates each year for the United States
and Japan. Also shown is the spot exchange rate for the beginning of each year.
A. Using PPP (equation 19.3), compute what the 1-year forward exchange rate should be each year.
B. Compare the forward rates computed in part (a) to the actual exchange rate at the beginning of the next year. How
well does PPP predict the future exchange rate? Is it biased too high, too low, or about right?
Year
Beginning of
Year Exchange
Rate
US CPI
Inflation
Rate
Japan CPI
Inflation Rate
1990 146.25 6.1 3.9
1991 134.60 3.1 2.8
1992 124.50 2.9 0.9
1993 125.40 2.8 0.9
1994 112.50 2.7 0.5
1995 100.52 2.5 -0.4
1996 103.92 3.3 0.5
1997 115.49 1.7 1.8
1998 132.40 1.6 0.6
1999 112.15 2.7 -1.3
2000 101.70 3.4 -0.3
2001 114.73 1.6 -1.6
2002 132.02 2.4 -0.3
2003 119.86 1.9 -0.4
2004 106.95 3.3 0.3
2005 102.83 3.4 -0.4
2006 116.34 2.5 0.4
2007 118.83 4.1 0.9
2008 109.70 0 0.4
2009 91.12 2.6 -1.8
2010 92.55 1.6 0.1
2011 81.56 2.9 -0.2
19-1
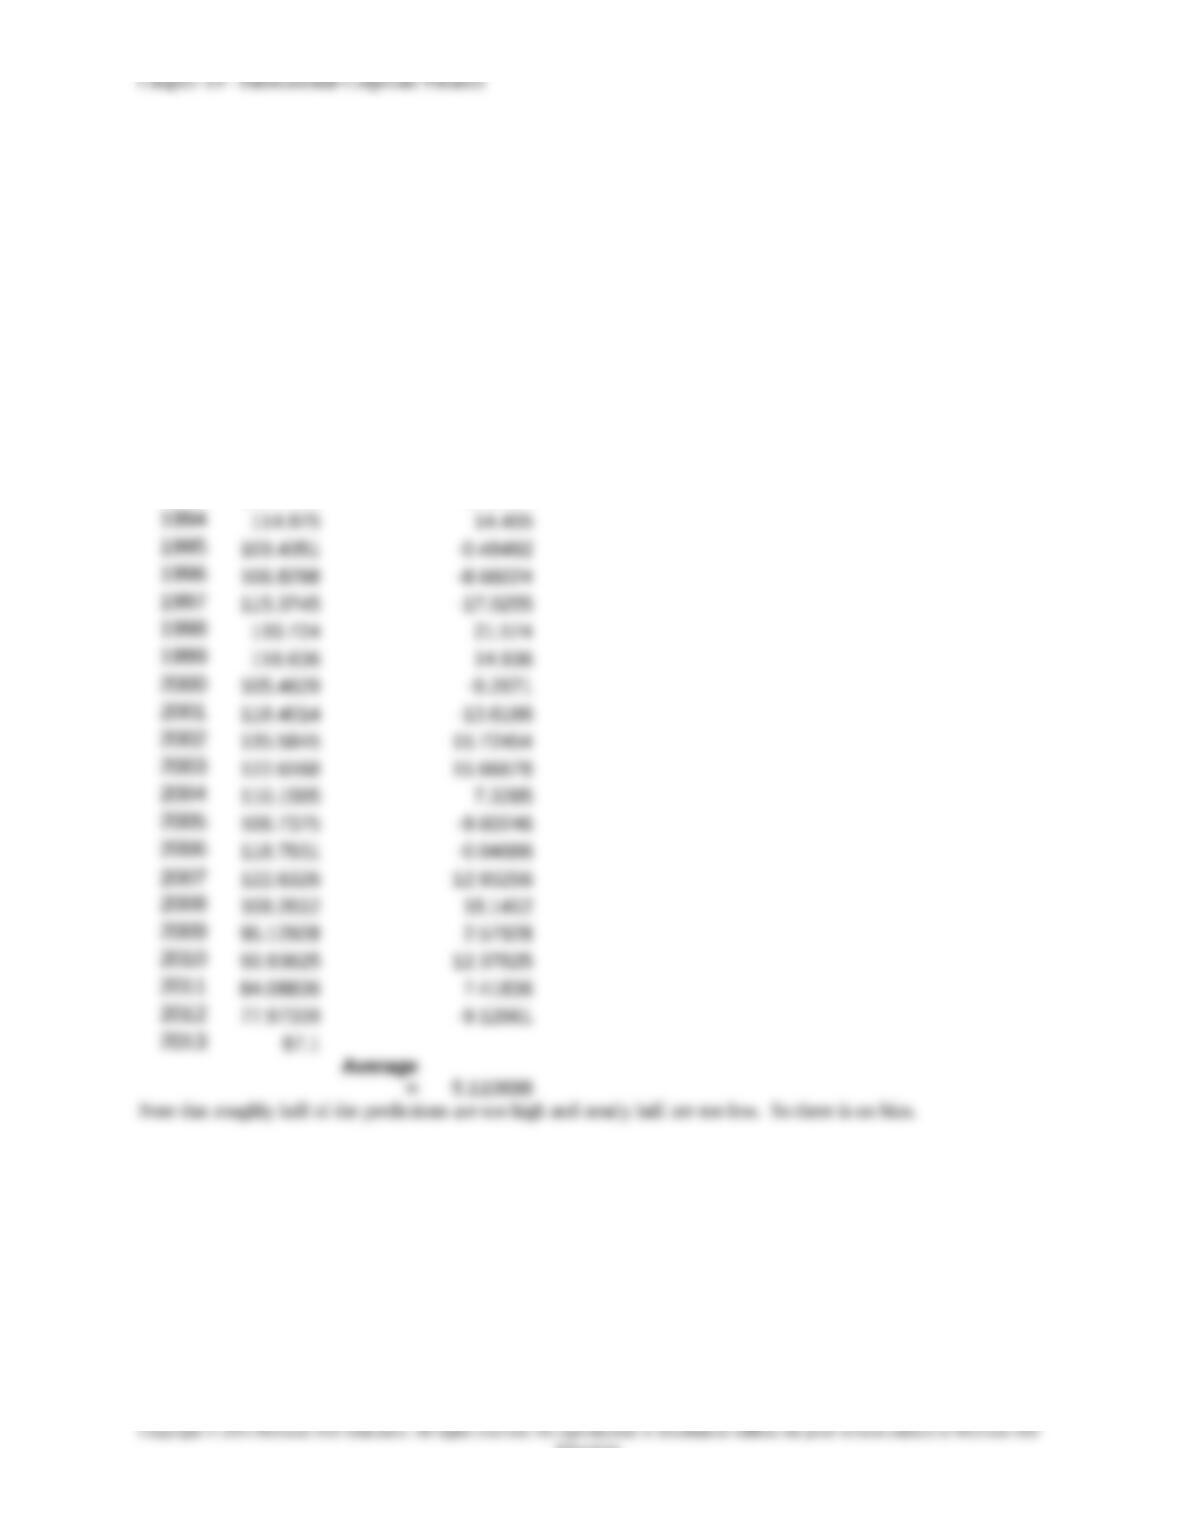
2012 76.67 1.6 -0.1
2013 87.10
Spreadsheet solution:
Predicted
Exchange Rate
Difference
with real
1990 149.4675 14.8675
1991 135.0038 10.5038
1992 126.99 1.59
1993 127.7826 15.2826
19-2
Education.
Chapter 19 – International Corporate Finance
research it!
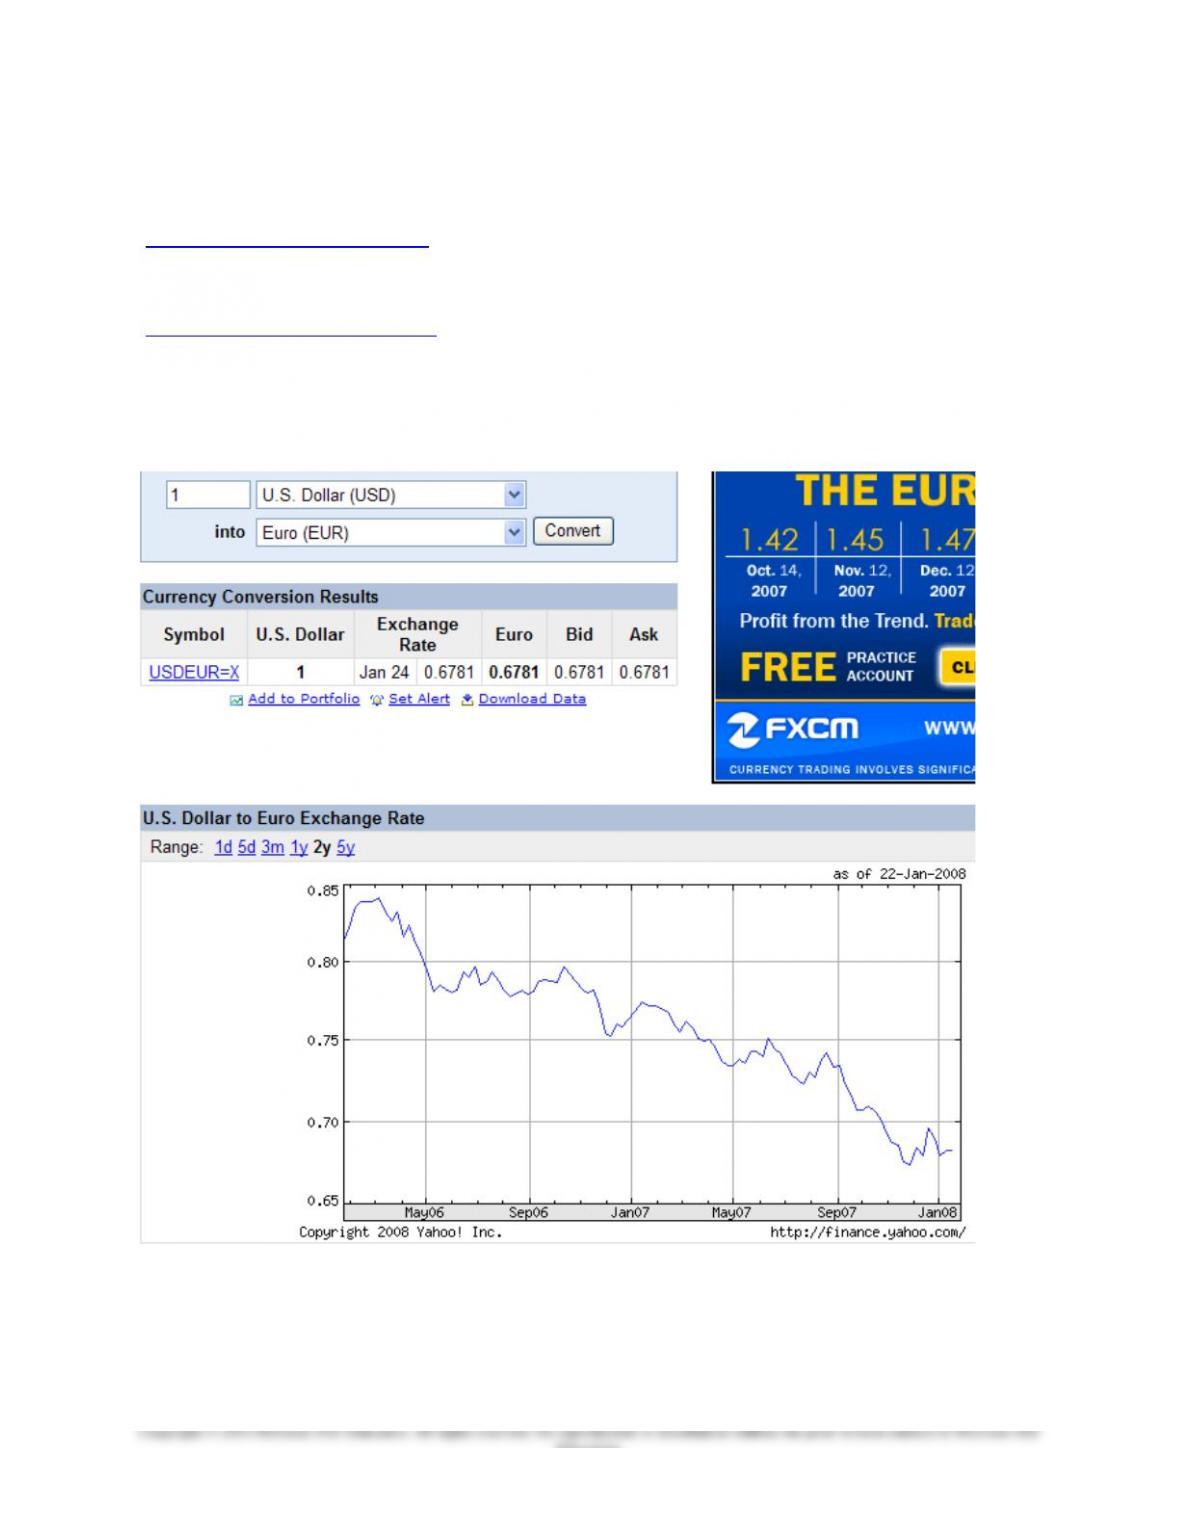
Find Currency Exchange Rates
Currency spot exchange rates are widely available on the Web. For example, at Yahoo! Finance
(http://finance.yahoo.com/currency) you can find the exchange rates between more than 150 currencies. The
calculator the site provides computes the amount of one currency resulting from converting money in another
currency. You can also see a graph of the desired exchange rate for a history of up to five years. Daily and monthly
historical data for the dollar exchange rates are available at the Federal Reserve website
(http://research.stlouisfed.org/fred2/). Many of the exchange rate data are available for more than 30 years. See
how exchange rates have changed over the years.
SOLUTION: The answer will depend on which currencies the student uses and when the assignment is completed. An
example may look like:
19-3
Education.

Chapter 19 – International Corporate Finance
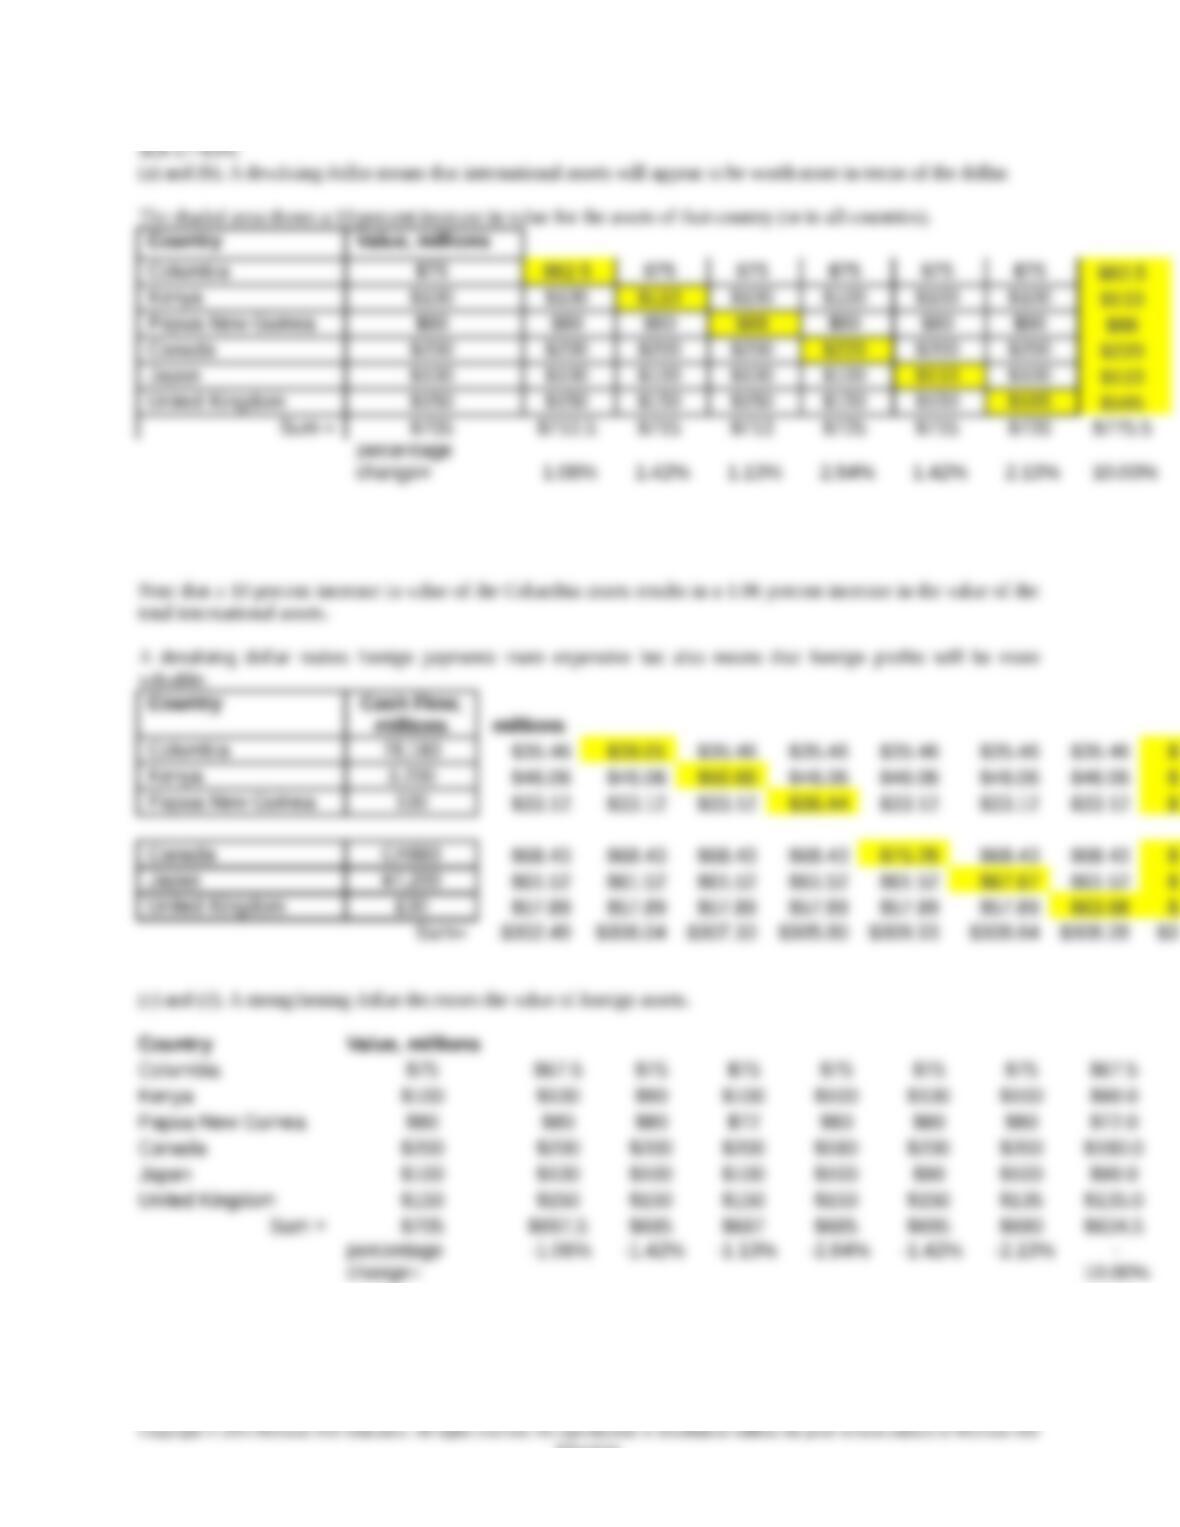
integrated mini-case: Assessing Exchange Rate Risk
Imagine that you are a financial manager of a multinational corporation, like Starbucks Coffee, in charge of
determining the impact of exchange rate changes on the firm. Changes in currency exchange affect both the balance
sheet and the income statement. The balance sheet impact occurs when the value of international assets are
translated to U.S. dollars. The values of those assets change as the exchange rate changes. The value of costs,
revenue, and profit also are impacted on the income statement because of exchange rate risk. Consider that your firm
has the following investments in coffee bean production and processing:
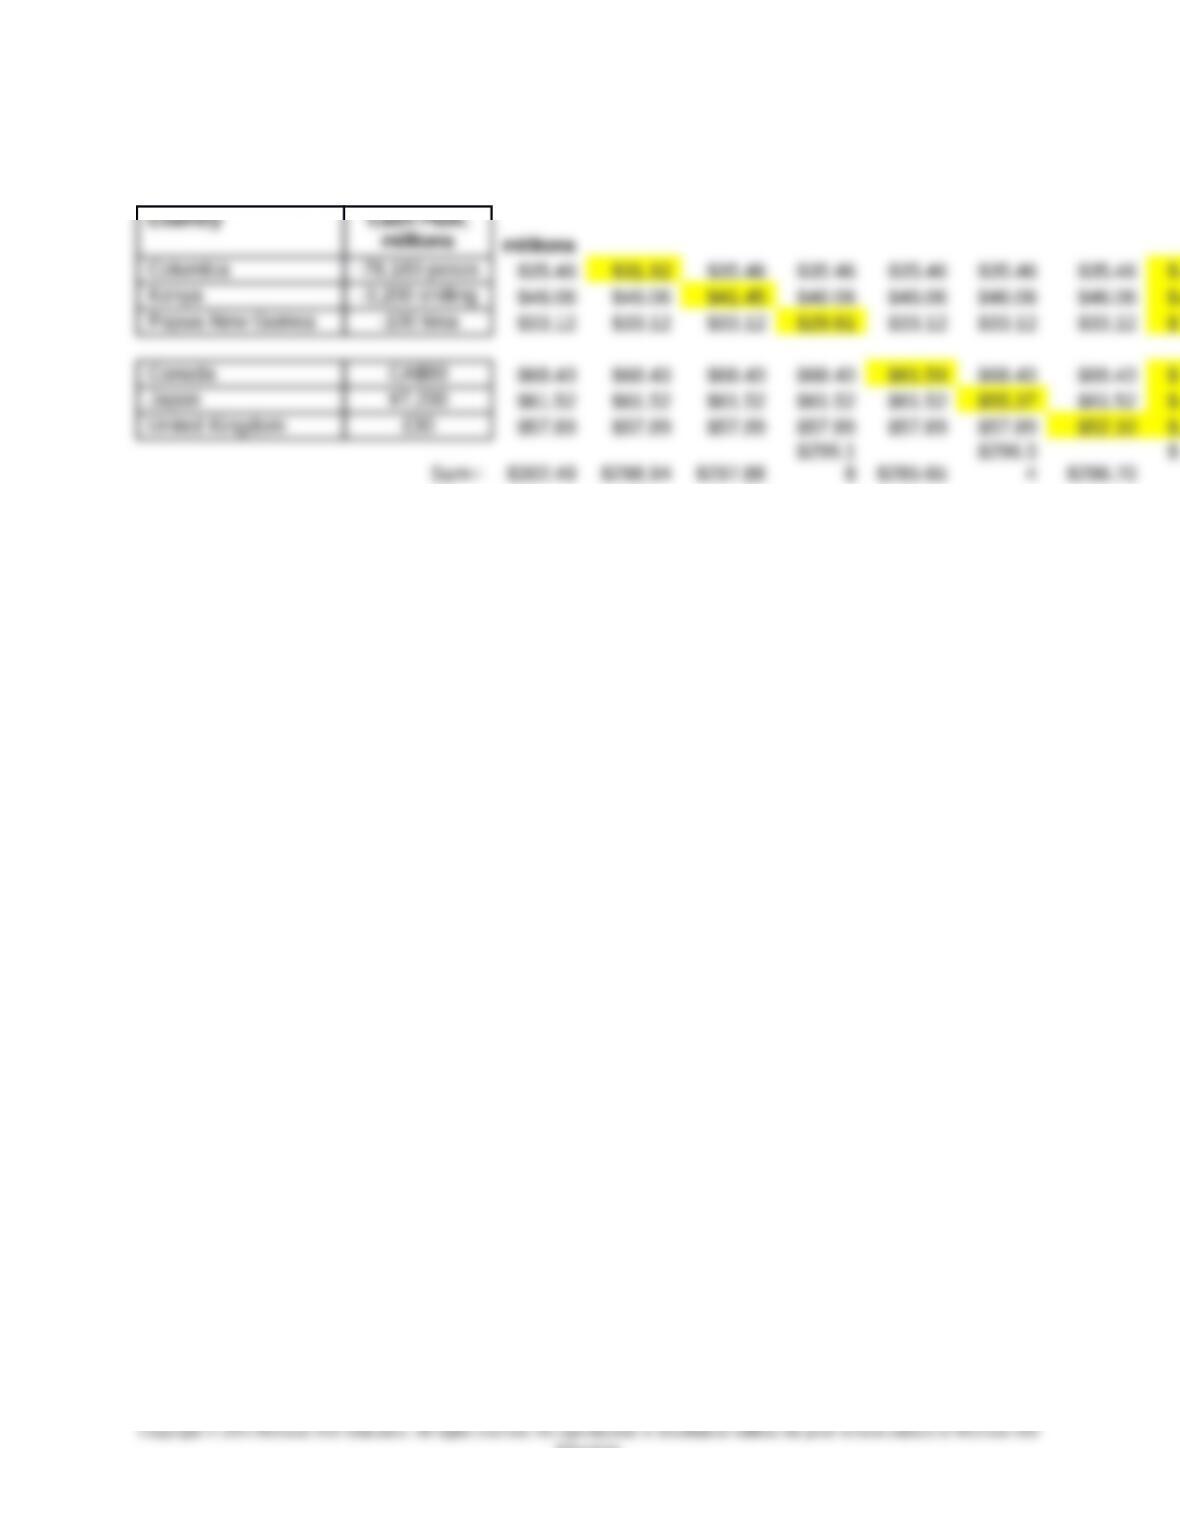
COUNTRY VALUE
(MILLIONS)
Columbia $75
Kenya 100
Papua New Guinea 80
The expense of all the labor, production, and beans will require the following exchanges to the foreign currency:
COUNTRY CASH FLOW
(MILLIONS)
Columbia 78,180 pesos
Kenya 3,200 shilling
Papua New Guinea 100 kina
Your firm has also invested in store facilities to sell the coffee products. The countries and the value of the
investments are:
COUNTRY VALUE
(MILLIONS)
Canada $200
Japan 100
United Kingdom 150
The net profit from these countries next year is projected to be:
COUNTRY CASH FLOW
(MILLONS)
Canada CA$80
Japan ¥7,200
United Kingdom £30
Current spot exchange rates are:
$1 = 2,204.5 Columbian pesos
$1 = 69.480 Kenyan shilling
$1 = 3.0189 Papua New Guinea kina
$1 = 1.1690 Canadian dollar
$1 =117.04 Japanese yen
$1 = 0.5182 British pound
Your task is to determine the following:
a. What is the impact on the value of the international assets and the cash flow if the dollar were to devalue by
ten percent against each currency (one at a time)?
b. What is the overall impact of a 10 percent dollar devaluation against every currency?
c. What the impact on the value of the international assets and the cash flow if the dollar were to strengthen
by ten percent against each currency (one at a time)?
d. What is the overall impact of a 10 percent strengthening against every currency?
e. What can be done to hedge this risk?
19-4
Education.
Chapter 19 – International Corporate Finance
19-5
Education.
Chapter 19 – International Corporate Finance
A strengthening dollar lowers the effective cost of foreign payments but also reduces the value of foreign profits.
Sum= $302.49 $298.94 $297.88
8 $295.65
4 $296.70
19-6
Education.