Chapter 08 – Stock Markets 6th Edition
1. Stock Market Participants
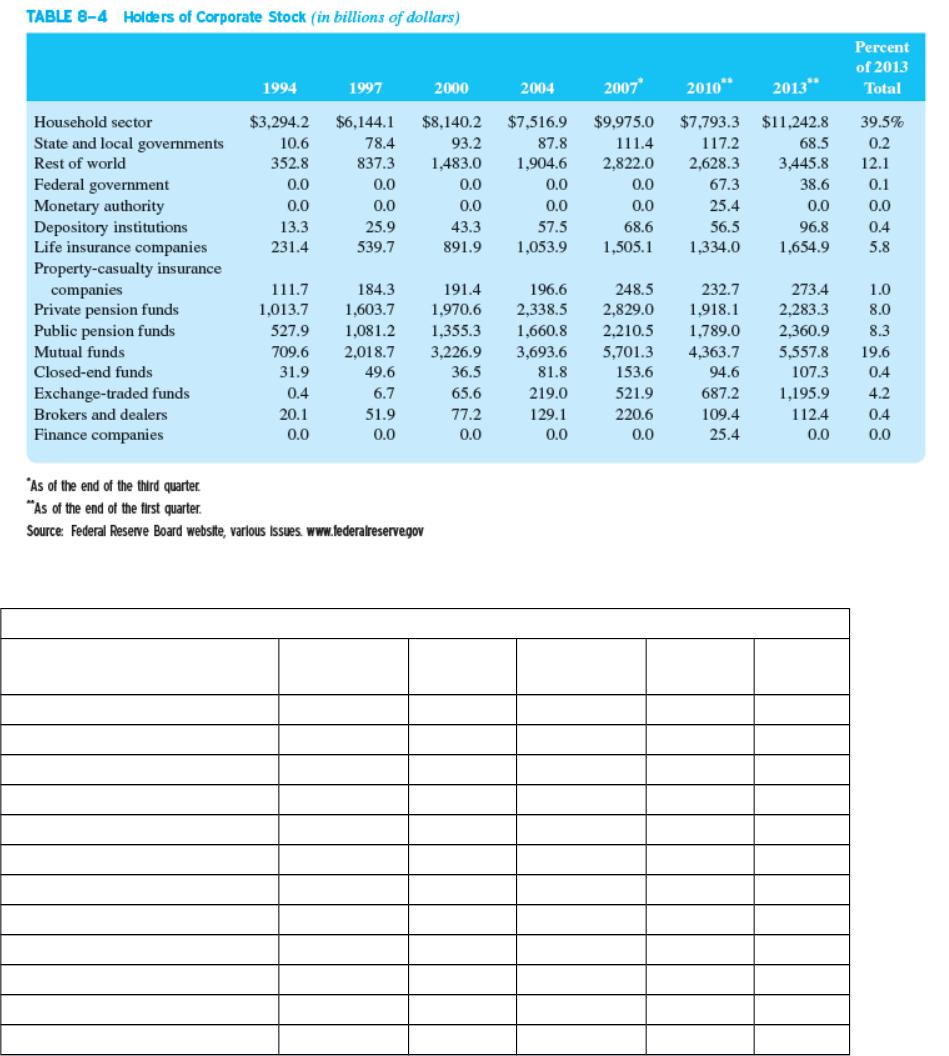
In 2013 the amount of corporate stock directly held by households was $11,242.8 billion,
or about 39.5% of the total (see the two tables below). Breadth of ownership peaked at
65% of the public in 2007 and was at 52% in April 2013 although total household
ownership of stocks as a percent has actually increased slightly from 2007 to 2013.
Holders of Corporate Stock Selected Years 1994 through 2013
Holders of Corporate Stock 2007 and 2013
Modified Text TABLE 8–4 Holders of Corporate Stock (in billions of dollars)
Sector 2007
% of
Total 2013
% of
Total
Chang
e
Household sector $9,975.00 37.8% $11,242.80 39.53% 1.70%
State & local govt. 111.40 0.4% 68.50 0.24% -0.18%
Rest of world 2822.00 10.7% 3445.80 12.12% 1.41%
Federal Government 0.00 0.0% 38.60 0.14% 0.14%
Monetary Authority 0.00 0.0% 0.00 0.00% 0.00%
Depository Institution 68.60 0.3% 96.80 0.34% 0.08%
Life insurance companies 1505.10 5.7% 1654.90 5.82% 0.11%
Property-casualty insurers 248.50 0.9% 273.40 0.96% 0.02%
Private pensions 2829.00 10.7% 2283.30 8.03% -2.70%
Public pensions 2210.50 8.4% 2360.90 8.30% -0.08%
Mutual funds 5701.30 21.6% 5557.80 19.54% -2.08%
Closed-end funds 153.60 0.6% 107.30 0.38% -0.21%
8-1

Chapter 08 – Stock Markets 6th Edition
ETFs 521.90 2.0% 1195.90 4.21% 2.23%
Brokers & Dealers 220.60 0.8% 112.40 0.40% -0.44%
Finance Companies 0.00 0.0% 0.00 0.00% 0.00%
$26,367.5
0 100.0%
$28,438.4
0 100.0%
Mutual funds at 19.5% comprise the single largest institutional holder of stocks followed
by the rest of the world and private pension funds. The 50-64 age group holds the most
shares by number and by value. Higher incomes are associated with greater stock
holdings as well.
2. Other Issues Pertaining to Stock Markets
a. Economic Indicators
Stock market prices are a leading indicator of economic activity. In theory, stock prices
are the present value of expected future dividends discounted at an appropriate risk
adjusted rate. A rise in stock prices could then ‘foretell’ higher expected future dividends,
a lower risk premium, a lower inflation premium (after tax), a lower real interest rate, or a
decline in expected future tax rates. Nevertheless, changes in stock indexes are often
poor predictors of future economic performance. For instance, between 1900 and 1987
declines in stock prices have preceded only 11 of the 27 recessions that occurred in that
time period.. Things change, usually unpredictably!
Leading Economic Indicators
Average weekly hours of manufacturing production workers
Average weekly initial claims for unemployment insurance
Manufactures’ new orders for consumer goods and materials
Vendor performance, slower deliveries diffusion index
Manufactures’ new orders for nondefense capital goods
Building permits for new private housing units
Stock prices
Money supply (M2)
Interest rate spread of 10 year Treasury over federal funds rate
Index of consumer expectations
b. Market Efficiency
In an efficient market, one cannot consistently use information to predict price changes
in order to earn a return greater than commensurate with the risk level of the investment.
In other words you cannot use information to consistently earn more than you should for
the risk level you are taking.
To complicate this simple concept we define three types of information: historical, all
publicly available information, and inside information.
Events often cause stock prices to diverge from their fair present value as news
‘randomly arrives’.
8-2

Chapter 08 – Stock Markets 6th Edition
If one can use historical news, or historical price and volume information to
consistently predict future stock price changes then the markets are not weak form
efficient.
If one can use any publicly available information, including forecasts based on
publicly available information, to consistently predict future stock price changes then
the markets are not semi-strong form efficient.
If one can use any information, including ‘inside’ information to consistently predict
future stock price changes then the markets are not strong form efficient.
The stock markets appear to exhibit weak form efficiency and with some glaring
exceptions, appear to be semi-strong efficient as well. The markets are not strong form
efficient. If they are the government owes some major apologies to people such as
Martha Stewart, Dr. Waksal, Michael Milken, Ivan Boesky and others who were arrested
for insider trading.1
Teaching Tip: The markets can only be strong form efficient if a) market prices are
irrational or b) insiders do not really have useful information so the question is moot, or
c) general market volatility is so large that inside information is not useful It is the
actions of profit seeking, non-collusive traders that bring about market efficiency. Why
would one expect prices to reflect information that no trader has access to before the
trades makes the inside information public? By what mechanism would this information
be reflected in prices?
A more strict definition of efficiency is that stock prices follow a random walk, akin to
the path an inebriated person would take staggering across a field. The person’s last step
cannot tell us anything about their next step because the choice of direction of the next
step is random. This implies zero serial correlation of returns. Stock prices do not
strictly conform to a random walk, but deviations are generally not large enough to allow
abnormal trading profits after consideration of trading costs.
c. Stock Market Regulations
The SEC oversees the exchanges and The Financial Industry Regulatory Authority
(FINRA) is the regulator for all U.S. securities firms. FINRA was created by the 2007
merger of the NASD and the regulatory arm of the NYSE. FINRA oversees registering
and educating brokers and dealers, examining securities firms, promulgating rules,
enforcing federal securities laws and conducting dispute arbitration. The SEC has been
heavily criticized for failing to uncover the Madoff fraud. This led to many personnel
changes and supposedly a more adversarial culture at the agency.
One of the functions of the SEC is to limit insider trading and stock price manipulation
and promote investor confidence in the markets. In October 2000 the SEC adopted
Regulation Fair Disclosure to stop firms from selectively disclosing information to only
1 One could still argue they acted unfairly, but if the markets are strong form efficient
there would be no damages resulting from their actions unless outright market
manipulation was involved.
8-3

Chapter 08 – Stock Markets 6th Edition
certain parties in part to help ensure that more investors have equal access to material
information.
U.S. hedge fund manager of Galleon Fund, Raj Rajaratnam, was found guilty of insider
trading activity in May 2011. The fund exploited inside tips from corporate executives
for various companies, including IBM, Sun Microsystems, Atheros, Google, and AMD.
He apparently also received information from an executive at Moody’s. Authorities
claimed he made profits of almost $64 million.2 He was recently sentenced to 11 years in
prison.
The hedge fund SAC Capital Advisors LP has been accused of extensive usage of insider
trading to the point where it seemed to be their major trading strategy. SAC has agreed to
pay $616 million in civil settlements, the largest amount ever on inside trading and head
Mr. Cohen, and other officials, now face additional charges.
3. International Aspects of Stock Markets
The U.S. stock markets are the world’s largest, but global markets are growing and the
formation of the euro continues to boost growth in Europe’s markets. Indeed the
subprime problems in the U.S. and generally weaker U.S. growth have reduced the U.S.’
dominance in global market statistics although the U.S. share is now beginning to grow
once more.
The two main reasons investors seek international investments are to provide a)
additional diversification and b) potentially higher returns. The text provides correlation
information and correlation levels indicate benefits from international diversification,
with two caveats. First, correlations have generally tended to increase over time as the
world’s economies become more synchronized and interconnected and second,
correlations increase significantly during crises. Diversification strategies can fail just
when they are most needed.
Because most countries do not require as much disclosure as U.S. markets however, an
investor can face additional informational risks in overseas investments. Dealing with
foreign regulations, currency fluctuations and withholding taxes can also be onerous. For
these reasons FIs have purchased foreign stocks and then issued dollar denominated
American Depository Receipts (ADRs) in the U.S. The ADR is a claim to foreign
stock. It trades in dollars, receives dollar dividends and has identical brokerage fees as a
U.S. security. Exchange listed ADRs must meet the same disclosure requirements as U.S.
firms, but information on OTC ADRs may be more difficult to obtain. In 2012 there
were more than 1200 ADRs available covering $2.79 trillion; the main issuer is the Bank
of New York Mellon. Through ADRs 20% of the top 100 non U.S. companies are owned
by U.S. investors.
There are three types of ADRs. Level 1 ADRs trade OTC and are not required to meet
2 Galleon Boss Rajaratnam Found Guilty of Insider Trading, BBC News Co., May 11,
2011.
8-4
Chapter 08 – Stock Markets 6th Edition
U.S.GAAP nor issue annual reports. Level 2 ADRs trade on the exchanges and must
meet exchange requirements and adhere to U.S. reporting standards. Level 2 ADRs are
much more liquid than Level 1 offerings. Level 3 ADRs meet the same reporting
standards as Level 2 and must register with the SEC and file the equivalent of 10K forms.
These firms are allowed to raise public capital in the U.S. ADRs provide low cost
diversification, but may more directly expose investors to currency and sovereign risk.
Overseas stock markets are roughly similar to U.S. markets. In Canada and Asia stock
markets are primarily self-regulated with government oversight, but in Europe the
respective governments are more likely to directly oversee the exchanges. In Germany
and Switzerland most exchange trading occurs through banks. The specialist system is
not generally found in overseas markets, it is largely unique to the U.S. Not all foreign
markets are continuous auctions either (those in Germany and Austria are not).
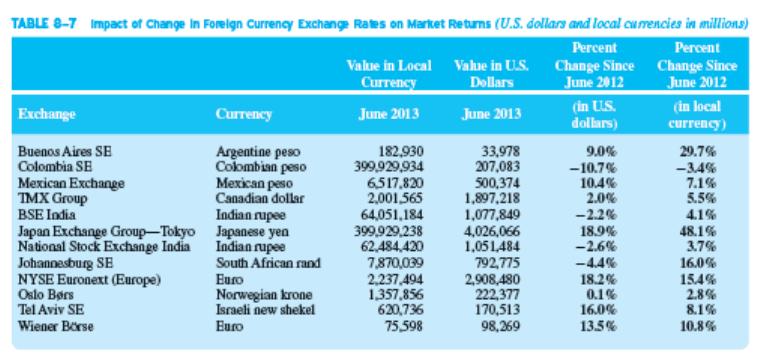
Foreign exchange movements can significantly impact rates of return on foreign
investments as indicated in Text Table 8-7 reproduced below:
Local gains can become losses and vice versa as a result of a currency change.
Teaching Tip: Corporate governance in general and shareholder protections in particular
are generally weaker overseas than in U.S. firms. Europe follows a stakeholder model
where unions and community interests are given equal or higher precedence than
shareholder goals. In Japan entrenched management and promotion of managerial
interests are the norm, although this is changing. You can search the Economist for more
information.
Appendix 8A: The Capital Asset Pricing Model (available on Connect or from your
McGraw-Hill representative)
The Capital Asset Pricing Model (CAPM) is briefly covered in the appendix (all
appendices are available only on the web). The CAPM posits that since investors should
diversify only systematic risk matters. Unsystematic risk is the part of the variation of
an individual asset’s return that is due to firm or industry specific events. These
variations tend to be averaged out when the stock is held in a portfolio so they really
don’t matter to an investor who diversifies. The systematic risk is the part of a stock’s
8-5

Chapter 08 – Stock Markets 6th Edition
risk related to changes in overall economic (systemic) factors such as interest rates,
inflation and GDP growth. Or stated another way, the individual security’s systematic
risk is the effect on the variability of the well diversified portfolio that all investors hold.
The measure of systematic risk is the covariance of an individual stock’s return (Ri) with
the return on a well-diversified portfolio (theoretically the market portfolio of all risky
assets). A broad portfolio such as the S&P500 or some other index is typically used as a
proxy to measure the return on the market portfolio (Rm). Beta (βi) measures the
covariance. The market price of risk is Rm-Rf where Rf is the risk free rate, usually
measured by the 1 year T-bill rate. The risk premium for stock i is then the product of the
quantity of risk βi times the market wide price of risk Rm-Rf. This product is then added
to the riskfree rate (Rf) to give the required rate of return based on the systematic risk
level of the stock:
CAPM: Ri = Rf + (Rm-Rf)* βi
1.1.1.1 Appendix 8B: Event Study Tests (available on Connect or from your
McGraw-Hill representative)
Event studies are used to test for abnormal returns. If one is to test for the presence of
abnormal returns you must have a model of normal returns. One of the simplest models
used is the market model (see below). After estimating the y-intercept (ai) and bi
parameters for stock i, you can calculate the stock’s normal or expected return E[Ri]
based on its normal relationship to the index and the current index return. The i or the
abnormal return is then found as Ri – E[Ri]. If one can consistently earn a positive
then one is earning more than they should for the risk level they are bearing and the
markets are not efficient with respect to the information used to generate the .
Market Model: Rit = ai + biRmt + eit
1.1.1.2 VI. Web Links
http://www.conference-board.org/data/ Website of The Conference Board,
promulgators of U.S. (and other countries)
leading, lagging and coincident economic
indicators.
http://www.federalreserve.gov/ Website of the Board of Governors of the
Federal Reserve
http://www.wsj.com/ Website of the Wall Street Journal
Interactive edition. The web version of the
well known financial newspaper can be
personalized to meet your own needs.
Instructors can also receive via e-mail
current events cases keyed to financial
market news complete with discussion
questions.
http://www.sec.gov/ The SEC’s website
8-6

Chapter 08 – Stock Markets 6th Edition
http://www.nasdaq.com/ The NASD website
http://www.nyse.com/ The excellent website of the New York
Stock Exchange. See the education section.
http://www.dowjones.com/ The Dow Jones website contains links to the
Wall Street Journal and Barrons, headline
news and financial information.
http://www.standardandpoors.com/ A leading provider of independent credit
ratings, research and financial information to
the capital markets.
http://www.ft.com/ Financial Times, won two Espy awards for
best new site and best non U.S. news site.
Coverage of global events and markets.
1.1.1.2.1.1
1.1.1.2.1.2 VII. Student Learning Activities
1. Go to http://www.choosetosave.org/asec/ and work out an estimate of how much you
need to save for retirement each year if you are currently 30 years old and make
$55,000 in income with no other retirement plan.
2. Go to the SEC website and read the part of the Facts on Saving and Investing report
titled “Where Many Americans Fall Short.” What mistakes are many people making
with stock investments? What knowledge are they lacking? See also the section
titled “Reaching Financial Goals.”
3. Learn about the Association for Investment Management and Research at their
website. What is the AIMR? What is the CFA? What benefits does a CFA provide
an investment professional?
4. What types of career opportunities are currently available with the NYSE for
undergraduates in finance?
5. Go to Goldman Sach’s website and investigate career paths in banking. Answer the
following questions:
What is the career path for an analyst?
What types of opportunities are available for students with advanced degrees?
What are the career opportunities for students interested in Technology?
Does Goldman Sachs offer summer internships?
Does Goldman Sachs have a summer associate program?
8-7
Chapter 08 – Stock Markets 6th Edition
8-8