1.1.1.1.1Chapter Six
Bond Markets
1.1.1.2 I. Chapter Outline
1. Definition of Bond Markets: Chapter Overview
2. Bond Market Securities
a. Treasury Notes and Bonds
b. Municipal Bonds
c. Corporate Bonds
d. Bond Ratings and Interest Rate Spreads
e. Bond Market Indexes
3. Bond Market Participants
4. Comparison of Bond Market Securities
5. International Aspects of Bond Markets
a. Eurobonds, Foreign Bonds, and Sovereign Bonds
II. Learning Goals
1. Describe the major bond markets.
2. Identify the characteristics of the various bond market securities.
3. List the major bond market participants.
4. Describe the types of securities traded in international bond markets.
1.1.1.3 III. Chapter in Perspective
This is the second of six chapters that covers different securities markets. This chapter covers
the types and major characteristics of bonds and the markets in which they trade. The student
should gain an understanding of price quoting conventions, typical terms and secondary market
trading activity for Treasury, corporate and municipal bonds. The Treasury STRIP program is
discussed in detail and sample pricing and yield calculations are provided. Students should also
be familiar with the major bond market participants. Brady bonds and sovereign bonds are
defined and the risks of international lending are introduced.
1.1.1.4 IV. Key Concepts and Definitions to Communicate to Students
Capital markets Term vs serial bonds
Bonds Mortgage bonds
Treasury notes and bonds Debentures
STRIP Subordinated debentures
Accrued interest, clean and dirty price Convertible and callable bonds
Municipal bonds Call premium
General obligation bonds Stock warrants
Revenue bonds Sinking fund provision
Firm commitment underwriting Investment grade vs junk bonds
Best efforts offering Eurobonds
Bid and offer price Foreign bonds
Bond indenture Sovereign bonds
Bearer vs registered bonds
1.1.1.5 V. Teaching Notes
1. Definition of Bond Markets: Chapter Overview
Bonds are capital market instruments with original issue maturities greater than one year.
Bonds are typically fixed income securities that represent nonamortized loans made to corporate
or government borrowers to fund their long term capital needs. Principal is paid at maturity, and
interest is typically paid semiannually at one half the ‘coupon’ rate times the face value of the
bond. The major types of bonds include Treasury bonds and notes, corporate bonds and
municipal bonds.
2. Bond Market Securities
In 2010 there were $20.5 trillion in bonds outstanding, excluding mortgages and in 2013 the total
had risen to $26.1. The bond markets grew 27% from 2010 to 2013. The growth was due to low
interest rates and difficulties in obtaining bank credit. This means that larger firms that could tap
bond market financing could obtain funds whereas smaller firms that relied on bank loans had
more difficulty in obtaining funds. Without credit, smaller firms had difficulty investing and
hiring. The 2010 and 2013 breakdown by sector is provided below:
Bond Market Instruments Outstanding 2010 & 2013 (trillion $)
Segment 2010 $ 2010 % 2013 $ 2013% % Growth
Treasury Notes & Bonds $ 6.3 30.68% $ 9.6 36.78% 52%
Municipal Bonds 2.8 13.86% 3.7 14.18% 32%
Corporate Bonds $11.4 55.46% $12.8 49.04% 12%
Total $20.5 100.00% $26.1 100.00% 27%
Teaching Tip:
The size of the total credit markets is greater than the equity markets. At times, finance classes
seem to spend more time discussing equity markets than debt markets, but the debt markets in
aggregate comprise a larger source of funds.
Federal debt held by the public was $11.90 trillion in the third quarter of 2013 (71% GDP) and is
projected to grow to $21.0 trillion by 2024 (78% of projected 2024 GDP, according to the
Congressional Budget Office (see below).
Year Gross Federal Debt Federal Debt Held by Public
2013 $16.7 Trillion $11.9 Trillion (71% GDP)
2024 (Projected debt and % projected GDP) $27.0 Trillion $21.0 Trillion (78% GDP)
Growth 62% 76%
Large levels of debt held by the public create the potential for crowding out and/or excessive
dependence on foreign investment. Interest expense is projected to grow substantially over the
next decade as well. When debt held by public (which is the measure that affects the credit
markets) hits about 90% most economists believe that GDP growth will be retarded, perhaps
holding back GDP growth by up to 1%, … but nobody knows for sure, and it depends on interest
rates and ability to attract foreign source money.
Teaching Tip:
One can illustrate the problem of high debt levels by appealing to corporate theory. Using debt
provides a boost to ROE when the money is invested and earns a sufficiently high return to grow
income. Otherwise the use of debt will eventually crowd out other spending. The question that
taxpayers/voters have to ask is whether the money invested will generate a sufficient return to
warrant borrowing such high levels. Certainly, as in all debt usage, increasing debt levels adds to
risk and potentially erodes the value of the dollar. The U.S. has been able to continue with such
high debt levels because the global reserve currency status of the dollar generates sustained
demand for the currency. At some point, and no one knows when, the world may no longer be
willing to hold as many dollars and at that point the U.S. will have a much more difficult time
financing its deficit.
Teaching Tip:
The credit rating agency, Standard & Poor’s, downgraded the U.S. from a AAA credit rating.
There was very little market impact from the downgrade, perhaps because Fitchs and Moody’s
did not downgrade the debt or more likely because the market did not consider the U.S. to be
significantly riskier. You may wish to ask students to consider whether United States’ Treasuries
are truly risk free in real and nominal terms. Could the U.S. have a sovereign debt crisis similar
to Europe?
a. Treasury Notes and Bonds
T-notes and bonds are default risk free. T-notes have an original issue maturity from 1 to 10
years inclusive, whereas T-bonds have original maturities more than 10 years. Both types pay
interest semi-annually. Price quotes are in 32nds as a percent of par. The minimum par or face
value has been $1,000, but the text is now quoting $100. The Treasury also issues inflation
indexed bonds where the principle is adjusted for inflation.
In 1985 the Treasury began its Separate Trading of Registered Interest and Principle Securities
(STRIP) program. A STRIP is a Treasury security where each individual coupon payment and
the principle payment at maturity can be separated and sold individually. STRIPs are registered
securities; a private dealer requests that the Treasury ‘strip’ the individual payments and keep a
record of them on the Treasury’s computer system. Each payment will be given its own CUSIP
(identification) number. Only certain securities are eligible for stripping. The minimum face
value of a stripped payment (such as a single coupon payment) is $1,000. Thus the par amount
must be large enough to yield a semi-annual payment amount of $1,000 (or multiples of $1,000).
These stripped payments are then zero coupon bonds that trade at a discount. Prices and yields
on quotes follow similar conventions as T-notes and T-bonds.
The sum of the sale price of the components of STRIPs is often greater than the fair present
value of the original Treasury security. This provides the motivation for dealers to petition the
Treasury to create STRIPs. Investors are willing to pay a small premium because the individual
payments can be used in duration matching or cash matching strategies that limit the investor’s
risk. For instance, maintaining a given duration with coupon paying bonds requires periodic
bond trading which generates transaction costs and perhaps tax consequences whereas use of
STRIPs avoids these costs.
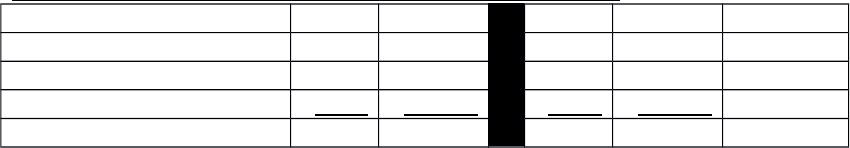
Sample Treasury Bond Quote (Source Text Table 6-1) ($1,000 par or face)
Maturity Coupon Bid Asked Chg Asked Yld
11/15/2042 2.750 84.8359 84.8516 0.4297 3.589
Maturity mo/yr: Month and year, the bond matures November 15, 2042.
Coupon: Coupon rate of 2.75% or $27.50 per year but paid semiannually ($1,000 face)
Bid: The closing price per $100 of par the dealer will pay to buy the bond; the seller would
receive this price from selling to dealer. Prices are traditionally quoted in 32nds but the
updated text quotes are in decimals. In this case, 84.8359 represents 84.8359% of $1,000 =
$848.359.
Asked: The closing price per $100 of par the dealer requires to sell the bond; the buyer
would pay this price to the dealer. In this case, 84.8516% of $1,000 or $848.516.
The Bid Ask spread is calculated as (Ask – Bid) / Ask = ($848.516 – $848.359) / $848.516 =
0.0185%. The spread is small because these are wholesale quotes for $1 million dollar order
sizes or larger and this is a high trading volume market.
Chg: The change from the prior closing ASKED price. In this case the ASKED price
increased 0.4297 from the prior quoted closing ask price.
Asked Yld = Promised compound yield rate if purchased at the ASKED price, in this case the
yield is 3.589%. Note that the yield is the yield to call if the price is above par and the yield
to maturity if below par. The yield calculation uses semiannual compounding.
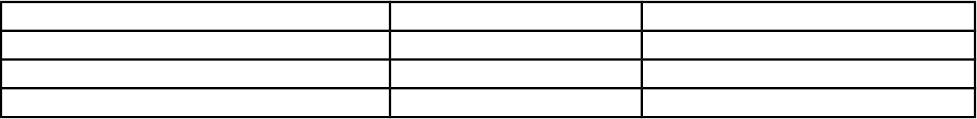
Sample Treasury STRIP Quote (Source Text Table 6-1)
Treasury Bond, Stripped Principal
Maturity Bid Asked Chg Asked Yld
2043 May 15 32.388 32.483 0.267 3.81
Maturity: May 15, 2043
Bid and Asked prices are a percentage of face value or a Bid price of $32.388 and an Ask
price of $32.483 per $100 of par or face value.
Chg: The change from the prior day’s Ask.

Ask Yld: Promised compound yield rate if purchased at the Asked price, in this case the
yield is 3.81%. Note that the yield is yield to call if the price is above par and yield to
maturity if below par. The yield calculation uses semiannual compounding to maintain
consistency with T-bond and T-note quotes.
Accrued interest must be paid by the buyer of a bond to the seller of a bond if the bond is
purchased between interest payment dates. The price of the bond with accrued interest is called
the full price or the dirty price, the price without accounting for accrued interest is the clean
price.
Accrued interest may be calculated as:
periodcouponindaysofnumberActual
paymentcouponlastfromdaysof#Actual
2
INT
InterestAccrued
where INT = annual dollar coupon interest.
For example, suppose you buy a 6% coupon $1,000 par T-bond 59 days after the last coupon
payment. Settlement occurs in two days. You become the owner 61 days after the last coupon
payment (59+2), and there are 121 days remaining until the next coupon payment. The bond’s
clean price quote is 120.59375. What is the full or dirty price (sometimes called the invoice
price)?
05.10$
)61121(
61
2
60$
InterestAccrued
The clean price is 120.59375% of $1,000 or $1,205.9375.
The dirty price is thus $1,205.9375 + $10.05 = $1,215.9875
Treasury Inflation Protection Securities (TIPS)
The Treasury began issuing TIPS in January 1997. TIPS pay a fixed coupon rate (presumably
equal to the real rate of interest required by investors at the time of issue assuming the bond is
issued at par) for the life of the security. The principle amount of the bond is indexed to inflation
however. The principal is adjusted every six months based on changes in the Consumer Price
Index (CPI). Because of the principal adjustment, investors are protected from unexpected
increases in inflation as measured by the CPI. Investor rates of return will be reduced by
unexpected decreases in inflation.
Treasury Inflation Protected Securities (TIPS) Example:
In 2013 there were about $900 billion of TIPS outstanding. An investor buys a $10,000 1 year
TIP security with a 3% coupon at par. Suppose that the CPI increases by 2% in the first six
month the investor holds the bond and the CPI increases by 1.5% in the second six months. The
investor pays or receives the following cash flows:
0 0.5 1
-$10,000 $153 $10,508.295

=($10,000*1.02* 0.03/2) =($10,000*1.02*1.015 0.03/2)
+ ($10,000*1.02*1.015)
The modified internal rate of return,1 assuming that the $153 is reinvested at 1.5% can be found
as ($10,508.295 + ($153*1.015) – $10,000) / $10,000 = 6.6359%.
Annual inflation = (1.02*1.015) – 1 = 3.53%
Real rate of return = (1+ MIRR) / (1+ Inflation annual) – 1 = (1.066359/ 1.0353) – 1 = 3.00%.
In a standard T-bond the equivalent cash flows and rates of return are:
0 0.5 1
-$10,000 $150 $10,150
= ($10,000* 0.03/2) = $10,000 + $150
IRR semi = 1.5% Note: MIRR = 3.0225%
IRR annual = 3.0225%
Annual inflation = (1.02*1.015) – 1 = 3.53%
Real rate of return = (1+ IRR annual) / (1+ Inflation annual) – 1 = (1.030225 / 1.0353) – 1 =
-0.49%.
Teaching Tip:
TIPS are not necessarily a good deal. In 2014 real TIPS yields were negative because of high
demand. Moreover, the CPI may understate inflation of most consumers’ regular purchases, so
TIPS returns may not be sufficient to offset the rising cost of typical purchases such as food and
energy. In addition the principal increase on a TIPS is taxed as ordinary income.
Primary market for Treasuries: Treasury note and bond auctions operate similarly to the T-bill
process discussed in Chapter 5. Regular auction schedules of notes and bonds are provided in
Text Table 6-3. Secondary market activity is large compared to other types of bonds. In July
2013 daily trading activity was about $447 billion on average. Although the Treasury market is
the most liquid bond market in the U.S. “off the run” (existing) securities may have less liquidity
than “on the run” (newly issued) securities.
As discussed in Chapter 5 the Treasury uses a single price auction process with the highest yield
accepted called the ‘Stop Out’ or ‘High Yield’. The coupon rate on the new issue will equal the
stop out yield rounded down to the nearest 1/8th, so it is typical for the new issue to come out
slightly below par. There is a tax advantage to this process as well because the accretion on a
small original issue discount is not subject to ordinary income tax. Because of this most bonds,
not just Treasuries are issued at a small discount from par.
Example:
The stop out yield on a 10 year Treasury is 2.14%. What price would every successful bidder pay
for a $1,000 par bond? The annual coupon will be rounded down to the nearest 1/8th or to 2 1/8th
or 2.125%. The semiannual coupon is (2.125%/2)*$1,000 = $10.625. Thus:
1Using the IRR does not work because the reinvestment assumption of solving for the promised
yield as the IRR is violated. That is, you cannot reinvest the intermediate coupon and earn the
IRR rate.

Investors would pay a quoted price of 99.86561 per $100 of par.
b. Municipal Bonds
Municipal bonds are bonds issued by state or local governments. The typical par value on a
municipal bond is $5,000. Munis comprise just over 14% of total bonds outstanding. Interest
income on munis is not taxed at the federal level and is usually exempt from state and local taxes
if the investor lives in the state in which the muni is issued. Capital gains are taxable. The tax
exemption allows municipal governments to obtain lower cost financing. With the tax
exemption, investors require lower yields on munis than on equivalent risk taxable bonds.
General obligation (G.O.) bonds are munis that are backed by the full taxing power of the
municipality (i.e. the general fund). Revenue bonds are backed only by the revenues of a
specific project. General tax revenues cannot be used to make payments on revenue bonds; thus a
revenue bond is riskier than a G.O. G.O.s are only about 36% of total municipal bonds. Many
municipal bonds are insured by a third party such as Ambac Financial Group. Insurance may
improve the bond’s credit rating and may improve liquidity.
One cannot directly compare muni bond rates with taxable corporate bond rates without
adjusting one or the other. The formula to adjust for taxes is straightforward:
ia = ib * (1 – t) where the a and b stand for after tax and before tax respectively. Hence a 4%
muni bond rate cannot be directly compared to a 6% equivalent risk corporate bond rate. Both
rates must be on the same tax basis. If one is in a 28% tax bracket, the after tax corporate bond
rate ia = 6%*(1- 0.28) = 4.32%. Now one can see that the investor is better off with the corporate
bond rather than the muni.
Muni bond offerings are generally underwritten by investment bankers in a firm commitment
offer. Best efforts are occasionally utilized.2 The investment bank may be chosen on the basis
of a bid process, where the banker that submits the highest bid price will be selected, or on a
negotiated basis. Municipal issuers generally consider multiple investment bankers before
choosing a lead underwriter. G.O. bonds usually must be issued via competitive bid, but the
request for proposals (RFPs) is usually worded so that it is not strictly price that determines the
choice of the banker. Sometimes bonds are privately placed (usually sold to 10 or fewer large
(i.e., those with assets over $100 million), usually institutional, investors).
In this case the bonds need not be registered. Smaller to mid-size municipal and corporate
borrowers typically use private placements. Private placements can now be traded among large
investors, but the market is very thin as is the secondary market for publicly issued munis.
Teaching Tip:
J.P. Morgan allegedly bribed officials in Jefferson County Alabama in exchange for allowing
Morgan to underwrite municipal bonds and enter into interest rate swaps. J.P. Morgan settled the
2In a firm commitment the underwriter buys the issue from the firm paying the bid price and
reselling the issue at the offer price. In a best efforts offering the underwriter assists in the sale
of the securities but does not buy the issue.
$998.6561
1.0107
$1,000
0.0107
1.01071
$10.625Price 20
20

lawsuit by dropping a claim for $647 million in swap termination fees and paying $75 million in
fines to the SEC and Jefferson County.3
Teaching Tip:
Municipal financing fell sharply during the crisis. The press has indicated that municipal bonds
may experience large scale defaults. As the text indicates, defaults did increase from $329
million in 2007 to $8.2 billion in 2008 and $6.9 billion in 2009. The problems are primarily due
to falling tax revenues and high pension and other payment obligations. In my opinion large
scale defaults are unlikely because it would limit municipalities’ ability to obtain additional
funds, and bond payments are a high priority for most municipalities. It is more likely that the
need to repay bonds will crowd out other types of spending on government services.
Nevertheless, states do have to control spending growth on pensions which threaten the long
term viability of state and local finances. More recently, defaults were $6.5 billion in 2011 and
$.8 billion in 2012. The large Detroit bankruptcy led to defaults of $6.68 billion in 2013.
c. Corporate Bonds
Corporate bonds comprise about 49% of outstanding bonds. The minimum denomination is
$1,000 on publicly traded bonds. Corporate bonds are debt instruments issued by corporations to
fund long term capital needs. The funds raised can be used for very risky purposes and default
risk is measured by one or more ratings agencies. The rights of the bondholders are protected by
the bond indenture (contract). The indenture specifies a trustee to ensure enforcement of the
contract and specific terms and provisions of the contract (called covenants). The covenants will
stipulate collateral, if any, the call features and convertibility features (if any), the interest rate,
the interest payment and maturity dates and other restrictions on the bond issuer while the issue
is outstanding. There will usually be a maximum dividend specified, a limit on additional debt
of equal or higher seniority and limits on certain ratios such as times interest earned and the
current ratio.
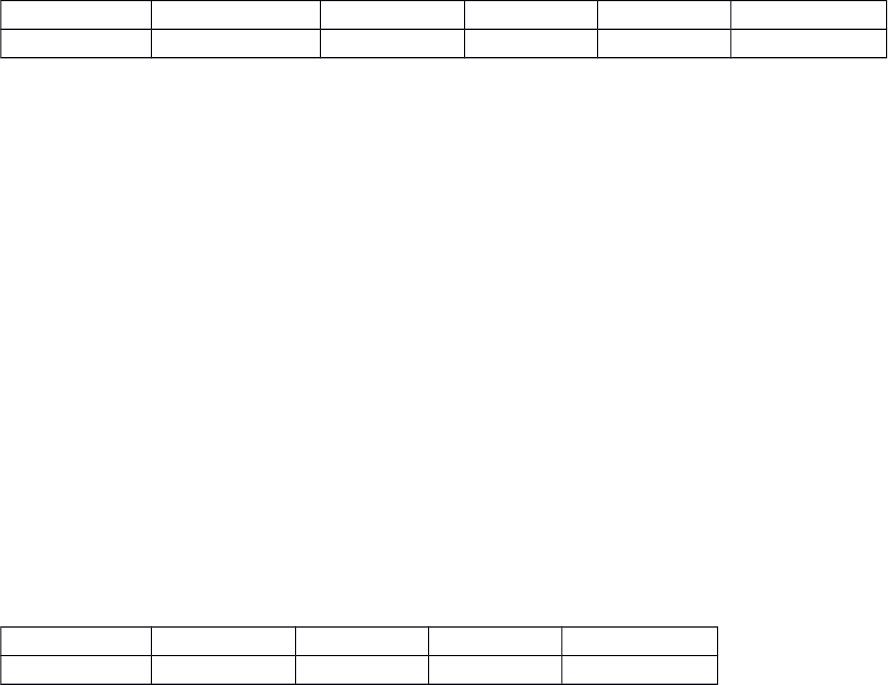
Corporate bond quotes (Source: Text)
Issuer
Name Symbol Coupon Maturity
Moody’s/S&P/
Fitch High Low Last
Chang
e
Yield
%
Philip
Morris
Intl
PM3975
964 2.625 % 03/06/2023 A2/A/A 95.335 93.521 93.772 0.858 3.388
The quote lists the issuing company name and ticker, the annual coupon rate (2.625%), the
maturity date, the bond rating by the three agencies, the high, low and closing price in decimal
form as a % of face value (for example the daily high price was $953.35), followed by the
change from the prior day’s last, and finally the promised yield to maturity using the closing or
last price.
Bond terminology:
3 J.P. Morgan Settles Alabama Bribery Case, Mary Williams Walsh, The New York Times,
November 5, 2009.

Bearer bonds versus registered bonds: Payments are made automatically to the owner of
record of a registered bond. Bearer bond payments are made at the request of the bearer;
usually the investor clips a coupon and mails it to the borrower. In the U.S. borrowers may
no longer issue bearer bonds.
Term vs serial bonds: Term bonds mature all at once at maturity. Serial bonds mature
sequentially. For instance with a ten year overall maturity, some serial bonds would mature
in five years, some in six years, etc, so that a portion of the outstanding debt is paid off each
year.
Mortgage bonds: With a mortgage bond specific collateral has been pledged as security for
the bondholders. In the event of non-payment of interest or principle, the trustee can seize
the collateral on behalf of the bondholders and sell it to recover their money.
Debentures and subordinated (junior) debentures: Debentures have no specific asset
pledged as collateral. They are riskier than mortgage bonds and carry higher yields.
Subordinated debentures are riskier yet as they are not paid off until debenture holders are
paid off.
Convertible bonds: Bonds convertible at the option of the bondholder into either preferred
or common stock as the contract states. The conversion option allows the issuer to issue the
bond at a lower required yield, ceteris paribus. Usually the stock price must increase 15% to
25% before the conversion option becomes profitable to the bondholder. If the stock price
increases the convertible bond’s price will begin to act like the stock price.
Example: A firm issues annual payment 6% convertible bonds at par. Each bond can be
converted into 250 shares of common stock and the firm’s common stock is trading at $3.20.
What percentage increase in share price is needed to justify conversion? If the bondholder
gave up 30 basis points in coupon and yield rate in order to get the conversion feature, and
was not able to profitably convert the bonds for three years, how did the investor do relative
to a stockholder and an investor who bought an equivalent nonconvertible bond?
What percentage increase in price is needed to make conversion profitable? Common stock
price required to make conversion profit neutral: $1,000 bond value / 250 shares = $4.00 per
share
Required increase in stock price = $4.00/$3.20 -1 = 25%
The investor received a 6% annual rate of return. An investor in the stock would have
received an average annual rate of return of 7.72%, excluding dividends.4 An investor in an
equivalent nonconvertible bond would have received an annual rate of return of 6.3% (30
basis points more the convertible). Ask students to think through the value of the convertible
option. Is it worth it and if so then in what situations? Is buying a convertible an aggressive
or a defensive strategy?
Teaching Tip: Virtually all convertible bonds are callable. The issuer often uses the call feature
to force conversion and eliminate the fixed interest payments. Students almost invariably believe
that convertible bonds are good deals because they combine the protection of a bond’s fixed
income with the stock’s upside potential. In an efficient market however, the embedded option
4 Found as 1.250.3333-1
in the bond is priced according to the prospects of the firm’s stock. There is little reason to think
that the investor is getting a particularly good deal. For instance, agency theory tells us that
convertible bonds will normally be a preferred financing instrument when the bondholders are
worried that management will favor stockholders over the bondholders. In the event of a
takeover that benefited shareholders and hurt bondholders the conversion option may be a
valuable feature but the conversion option doesn’t necessarily mean the convertible is a better
deal than straight bonds.
Callable bonds: Bonds that may be redeemed at the option of the issuer at a predetermined
price above par (call premium), or according to a predetermined price schedule (the call
price often drops as maturity approaches). The call feature results in higher required yields.
incb = icb -opcb where incb is the required yield on a noncallable bond and icb is the required yield
on a callable band and opcb is the value of the issuer’s option to call the debt early. Issuers
typically call the bonds after interest rates have fallen, which can leave the investor with an
overall lower realized yield over a given investment horizon. The call feature usually results
in a 5 to 25 basis point increase in required yield.
Teaching Tip: The potential lower realized yield is worth demonstrating to the students. Here is
a simple example:
You have a five year investment horizon. You buy a callable 7% coupon five year bond at par.
Rates drop to 5%, the bond is called at a call price of $1,075. You reinvest your funds in 5%
coupon bonds for the five years. A 7% annual compound rate of return on a $1,000 initial
investment over five years should yield: $1,000 1.075 = $1,402.55. You actually earned $1,075
1.055 = $1,372 or you earned a 6.53% rate of return from your original $1,000 investment.
Sinking fund: A sinking fund requires the bond issuer to ensure that enough money will be
available to retire the debt at maturity. This can be done by having the borrower deposit
funds with the trustee each year so that at maturity enough money is available to pay off the
principle. This is an added safety feature to the bond that allows the bond issuer to offer a
lower required rate of return.
Teaching Tip: Sometimes sinking funds allow the bond issuer to randomly select and redeem a
given percentage of the bonds each year. Issuers prefer this method because it terminates the
interest owed on the retired bonds. This type of sinking fund however may leave the bondholder
whose bond is selected for redemption worse off if interest rates have fallen since the bond was
issued (see the above Teaching Tip on callable bonds). Sinking funds of this nature can thus be a
mixed blessing to bondholders.
Teaching Tip:
Some bonds have a ‘make whole’ call provision that requires the issues to pay the full price of
the bond if a bond is called when its fair present value would be above the call price. This
eliminates the motivation to call the bond when interest rates fall and investors will require a
lower yield if this provision is in force. In this case the motivation to call is usually to lower
financial leverage or to eliminate an issue that has undesirable covenants.
Stock warrants: Warrants are call options attached to the bond that can be detached and
exercised or sold separately, unlike the convertible bond which requires the bondholder to
give up the bond to acquire the stock. Warrants are often used as ‘sweeteners’ to bond deals
to obtain a lower interest rate on the bond.
The primary market for corporate bonds operates similarly to the primary market for municipal
securities. Both corporates and municipal bonds have lower secondary market activity than
Treasuries. There are two secondary markets for corporate bonds, the NYSE Fixed Income
Market and the over the counter (OTC) market. Less than 1% of corporate bonds are exchange
traded (primarily on the bond division of the NYSE). Trading on the NYSE bond market is
mostly automated and occurs through the Automated Bond System (ABS). On the ABS order
execution is fully automated. The OTC market consists of large bank dealers and contains most
of the actual trading done in bonds. Hence exchange bond price quotes are often behind or
inaccurate for large deals.
Teaching Tip:
The Volcker Rule of the Dodd-Frank bill has unintended consequences for bond markets. It is
now more expensive for banks to hold large inventories of corporate bonds and they have
reduced their holdings. This is constricting liquidity in the bond markets as bond trading activity
has declined. This should only be a short term problem however because a market system
should develop alternatives if there is a profit motive to do so. The alternative may not be as
efficient or cost effective as bank finance however.