Chapter 03 – Security Valuation 6th Edition
1. Impact of Coupon Rates on Security Values
a. Coupon Rate and Security Price
Ceteris paribus, the higher the coupon rate the higher the bond’s price. See the Teaching
Tip in 3a for an explanation.
b. Coupon Rate and Security Price Sensitivity to Changes in Interest Rates
A higher coupon results in lower bond price sensitivity to interest rate changes, ceteris
paribus. The bigger the coupon the greater the percentage of your initial investment that
is recovered in the near term (see the last Teaching Tip in 5.b.), or the bigger the coupon
the sooner you recover the investment. Suppose you are comparing two five year bonds,
one with a zero coupon and one with a 15% coupon. If interest rates rise the 15% coupon
bond pays you a much larger sum of money quickly with which you can reinvest and earn
the new higher interest rate. The zero coupon bond gives you no money with which you
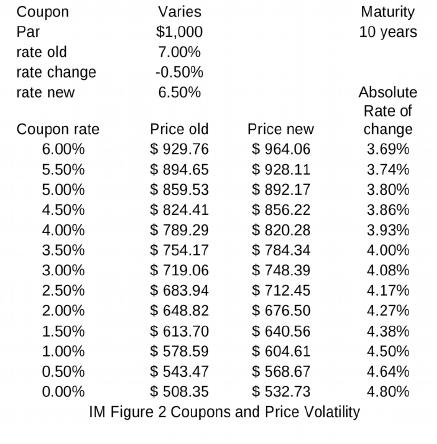
can reinvest and earn the higher rate so the zero drops more in value. IM Figure 2 below
illustrates the effect of coupon on price volatility for a 10 year maturity bond with a yield
rate change from 7% to 6.5% for bonds with different coupons. Notice that lower coupon
bonds exhibit a greater price change for the given rate change. The greatest volatility is
exhibited by the zero coupon bond, but as with maturity, the price change increases at a
decreasing rate for a declining coupon rate. At this point in the development an investor
needs to consider both maturity and coupon to understand their exposure to interest rate
risk. One of the purposes of developing the duration concept in the next section is that
duration reduces the analysis to one dimension by incorporating the effect of coupon into
the maturity effect on price volatility.
2. Duration
a. A Simple Illustration for Duration
Duration is the weighted average time to maturity on a financial security using the
relative present values of the cash flows as weights. This definition will initially mean
very little to students. To understand the concept implied by the definition, think of an N
year annual payment coupon bond as a portfolio of N zero coupon bonds where the first
N-1 of the bonds pay the coupon amount and the last one pays the coupon plus the par
Ch 3- 1
Chapter 03 – Security Valuation 6th Edition
amount. The coupon bond’s duration is the average maturity of the portfolio of zero
coupon bonds. However, we cannot take a simple average because not all the cash flows
in each year are identical. Moreover, Chapter 2 tells us that we cannot compare a cash
flow in year 1 with a cash flow in year N. So we construct a series of weights that tell us
what percentage of our money (in today’s dollars) we recover in each year. To do this
take the present value of each cash flow divided by the purchase price of the bond. For
instance, for a 5 year bond suppose we recover in present value terms 5% of our
investment in year one , 4% in year two, 3% in year three, 2% in year four and 86% in
year five. We receive cash in each of the next five years (or a zero matures in each of the
next five years): 1, 2, 3, 4 and 5. Thus, the bond’s duration is the weighted average
maturity of the zeros or (5%1) + (4%2) + (3%3) + (2%4) + (86%5) = 4.6 years.
Duration may perhaps be slightly better defined as a weighted average of the times in
which cash is received, a slightly different wording than the more common definition
above.
Teaching Tip: The above 5 year maturity coupon bond has the same price sensitivity as
a 4.6 year maturity zero coupon bond (ignoring convexity).
Teaching Tip: Thinking of duration as a weighted average life of a bond assumes the
bond’s cash flows do not change over the life. This concept of duration is problematic for
mortgage bonds or any bond with embedded options. In some of these cases duration
may be longer than the life of the bond or may be negative and the time concept of
duration then makes no sense. In these situations one should think of (modified) duration
as the percentage price change for a 100 basis point change in interest rates.
b. A General Formula for Duration
PV
r)(1
tCF
Dur
N
1t
t
t
For example: INT = $90 per year, annual r = 10%, Maturity = 6 years, m = 2
compounding periods per year, PV = $955.68}
Annual duration = 9.46 ÷ 2 = 4.73 years
Closed form version of the duration equation:
Ch 3- 2
Equation 5
Equation 4
$955.68
(1.05)
12$1045
(1.05)
t$45
periods annual–semi 9.46Dur
11
1t 12t
)PVIFAr)((1N
r)(P
INT
NDur Nr,
o
r
)(11
PVIFA where
N
Nr,
r

Chapter 03 – Security Valuation 6th Edition
This formula is from: Caks, J., W. Lane, R. Greenleaf, and R. Joules. (1985). A Simple
Formula For Duration, The Journal of Financial Research, 8(3).
INT
= Periodic cash flow in dollars
r = periodic interest rate
n = Number of compounding or payment periods
Dur = Duration = # Compounding or payment periods
Teaching Tip:
Variations of the basic duration formulae can be used. The versions shown above may be
used for annual or semiannual payment bonds or for amortizing loans. The duration
answer obtained from these equations will be in the number of compounding or payment
periods. For instance, if you use Equation 4 or 5 to find the duration of a semiannual
payment bond as shown above, you will get an answer in terms of the number of
semi-annual periods, rather than years. If one replaces PV in Equations 4 and 5 with
(m*PV), then the resulting duration answer will be in years.1 Alternatively, Equation 4
could be modified as follows to give an annual duration result for a semiannual payment
bond:
N
2/1t
t
PV
tPVCF
Dur
where PVCFt is the present value of the cash flow in time t, where t = ½, 1, 1½ , … N.
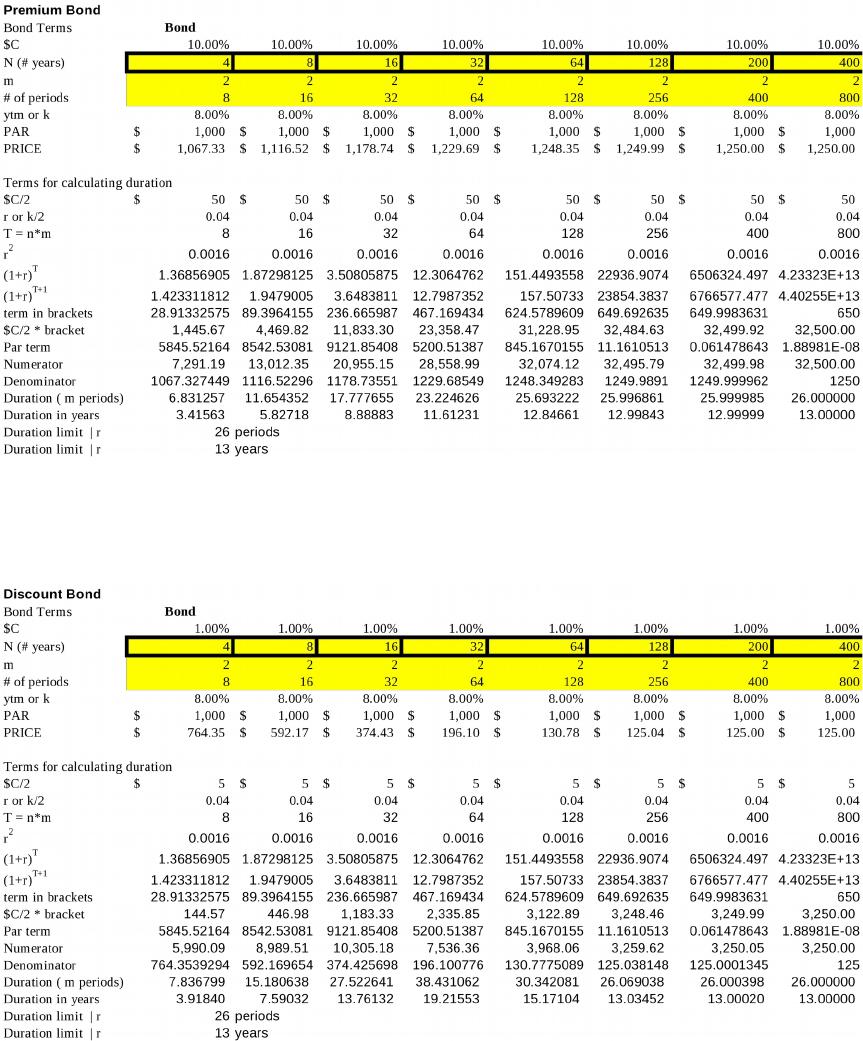
c. Features of Duration
Duration of a security with fixed cash flows and term may be thought of as a time
measure, usually presented in years. A greater coupon payment results in a shorter bond
duration. With a greater coupon the percentage weights on the early years are increased,
thus reducing the average maturity. The duration of a zero coupon bond is its maturity
because it has a 100% weight on the year in which the terminal cash flow occurs and a
0% weight on all other years. Except for certain deep discount bonds, the longer the
maturity of a bond the longer the bond’s duration (see the charts below). Notice that
duration increases at a decreasing rate as maturity increases. Duration has a limit with
respect to maturity for a given interest rate. The maximum duration of a bond can be
found as (1/ r) +1 where r is the periodic rate found as the ytm/2 for a bond and the
solution is the maximum number of payment periods. As you can see in the chart, for a
premium bond, the duration increases monotonically towards this maximum (26 periods
or 13 years. With an 8% APR the periodic rate for a semiannual payment bond is 4% and
1 Recall that m = number of compounding periods per year. In the prior chapter the text used c for m.
Ch 3- 3
Equation 4a
86325.8
2
0.05
(1.05)1
PVIFA
1
Nr,
periods annualsemi 9.468.86325)(1.0512
0.05)(955.68
45
12Dur
Chapter 03 – Security Valuation 6th Edition
the maximum is found as (1/0.04) + 1) as N is increased. Note that in the charts, m = c or
the number of compounding periods.
For a deep discount bond, the duration initially rises with maturity and then declines as
illustrated below:
Teaching Tip: Students should be aware that although duration is a modified measure of
maturity, it is still a measure of maturity and maturity is the predominant effect on
duration.
Ch 3- 4
Chapter 03 – Security Valuation 6th Edition
The higher the promised yield to maturity the shorter the duration. Using a higher
interest rate decreases the percentages weights on more distant cash flows (because of the
compounding effect the present value of more distant cash flows drops (%) more than the
present value of near term cash flows).
d. Economic Meaning of Duration
Taking the partial derivative of the bond price formula with respect to interest rates for a
zero coupon bond yields a simple relationship:
%P = – Maturity r / (1 + r) (r = yield to maturity)
%P = elasticity
Maturity can be used to predict the price change for small interest rate changes when
there are no coupons. This equation does not work for coupon bonds; its use in this case
would overestimate the volatility since coupons dampen a bond’s price volatility.
Duration is however a modified measure of maturity that reflects the reduced maturity
due to the early payment of interest (coupons) prior to maturity. In particular the duration
of a coupon bond has the same price sensitivity as a zero coupon bond that has a maturity
equal to the coupon bond’s duration (ignoring convexity). Thus it follows (without
calculus even) that %P = – Duration r / (1 + r) for a coupon bond. Duration may
be used to predict price changes for small interest rate changes for coupon bonds. For
convenience, practitioners sometimes calculate what is called ‘modified duration’ which
for bonds is Duration / (1 + rsemi) so that the only variable to be added to predict the price
change is r.
Important Note: Modified duration is Duration / (1 + rperiod). The ‘period’ would be
semiannual for most bonds and monthly for most loans. However when modified
duration is used to predict the price change in the formula, the rate change used is an
annual rate: %P = – Modified Duration / (1 + rannual). This can be a confusing point for
students.
Teaching Tip:
Why should students have to learn duration when today one can easily predict the bond
price change via a hand calculator, or better yet, with a spreadsheet? Two reasons:
1) Duration can be used as a strategic tool in trying to earn a higher rate of return, or to
minimize the risk associated with earning the promised yield to maturity. For instance,
for a given investment horizon one can try to lock in the current promised yield to
maturity by choosing a bond with a duration equal to the investment horizon. This is a
standard institutional bond investment strategy called immunization and it is described
in Appendix A. However, one can also try to beat the promised yield. If interest rates
are projected to fall one could choose a bond with a duration greater than the
investment horizon. If the investor is correct and rates fall, the gain in sale price of the
bond will more than outweigh the lost reinvestment income caused by the lower
reinvestment rate and the overall realized rate of return will be greater than the
promised yield. Conversely, one who is projecting rising rates can beat the promised
yield by choosing a bond with a duration shorter than the investment horizon.
2) Given the individual bond durations, the duration of a portfolio is a simple weighted
average of the durations of the bonds in the portfolio. Using the portfolio’s duration
Ch 3- 5

Chapter 03 – Security Valuation 6th Edition
makes it very easy to predict the net value change of the portfolio for a given change
in interest rates.
e. Large Interest Rate Changes and Duration
Duration is an accurate predictor of price changes only for very small interest rate
changes. For day to day fluctuations duration works quite well but when interest rates
move significantly, such as when the Fed makes an announcement of a rate change, the
predicted pricing errors can become significant. The prediction errors arise because bond
prices are not linear with respect to interest rates. At lower yield rates, bond prices are
more sensitive to interest rate changes than at higher initial promised yields. A given
percentage change in interest rates will result in a larger bond price change for a low
yield bond than for a high yield bond. Thus, a graph of bond prices versus interest rates
would be convex to the origin. Duration does not capture this change in sensitivity (or
convexity) of bond prices to interest rates. Duration predicts that the price changes of
bonds are linear with respect to changes in interest rates and thus duration predicts
symmetric price changes of a given interest rate increase or decrease. An examination of
Text Figures 3-7 and 3–8 indicates that this is not a true assertion. As mentioned above,
the bond’s price with respect to interest rates is convex to the origin. The duration is the
first derivative or slope of the line in Text Figure 3-7. Hence, the error in the bond price
prediction is due to the curvature of the line, and the degree of curvature is called the
convexity. Greater convexity leads to greater pricing prediction errors. The errors can
be quite economically significant for larger portfolios and for bigger interest rate changes.
Notably, convexity works in the investor’s favor. Duration over-predicts the price drop
that follows from an interest rate increase and under-predicts the price increase that
results from a yield decline. Investors will desire convexity in their bonds.2 The greater
the interest rate change, the greater the error in predicted prices and rates of return from
ignoring convexity. All fixed income securities that have cash flows prior to maturity
exhibit convexity. For more on convexity see Appendix 3B.
Appendix 3A: Duration and Immunization (Available on Connect or from your
McGraw-Hill representative)
Suppose you have a 5 year investment horizon and you are looking to immunize and lock
in the current promised 8% ytm. You find a likely candidate in an 8% coupon, 8% ytm
corporate bond with a 6 year maturity.
Duration: [80/1.08 + (80*2)/1.082 + (80*3)/1.08 3 + (80*4)/1.08 4 +(80*5)/1.085 +
(1080*6)/1.086] / 1000 = 4.9927, approximately 5 years
At the end of 5 years you must have achieved an ending wealth position of $1000 * 1.085
= $1469.33 if you are to have actually earned an 8% compound rate of return per year
(ytm).
Case 1: Rates stay same:
Future value (FV) coupons = $80 * [(1.085 – 1)/.08] = $ 469.33
2 This assumes that investors are long in bonds.
Ch 3- 6

Chapter 03 – Security Valuation 6th Edition
Price of bond end of 5th year = $1000.00
Total Ending Wealth = $1469.33
Case 2: Rates fall immediately after purchase to 7.5%:
Future value (FV) coupons = $80 * [(1.0755 – 1)/.075] = $ 464.67
Price of bond end of 5th year = $1080/1.075 = $1004.65
Total Ending Wealth = $1469.32
Realistically the investor must sell the bond immediately after the rate change, otherwise
rates may stay low for 4.9 years and then increase at the time of sale at year 5. The sale
will yield a price of $1,023.47, which can be reinvested at 7.5% for five years to give a
future value of $1,469.32
Case 3: Rates rise immediately after purchase to 8.5%:
Future value (FV) coupons = $80 * [(1.0855 – 1)/.085] = $ 474.03
Price of bond end of 5th year = $1080/1.085 = $ 995.39
Total Ending Wealth = $1469.42
Realistically the investor must again sell the bond immediately after the rate change.
This will yield a price of $977.23, which can be reinvested at 8.5% for five years to give
a future value of $1,469.42
If an investor chooses a bond with a duration greater than their investment horizon, their
pretax nominal realized yield will be improved by falling interest rates because the gain
in sale price will more than outweigh the loss in reinvestment income. Likewise, If an
investor chooses a bond with a duration less than their investment horizon, their realized
yield will be improved by rising interest rates because the loss in sale price will be
smaller than the gain in extra reinvestment income. (This example is drawn from
Gardner, Mills and Cooperman, Managing Financial Institutions: An Asset/Liability
Approach 4th ed. Dryden Press, 2000.)
Appendix 3B: More on Convexity (available in Connect or through your McGraw
Hill representative)
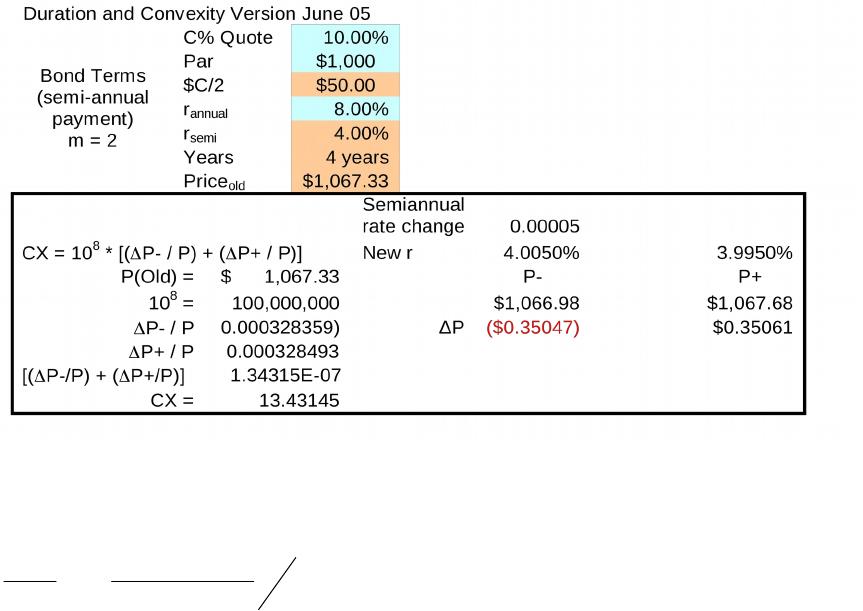
I. Measuring Convexity
There are various ways to measure convexity (CX). Cornett & Saunders measure CX
from the following formula:
CX = Scaling factor * [% loss in bond price from a 1 basis point rise in rates + % gain in
bond price from a 1 basis point drop in rates] written as:
CX = 108 * [(ΔP– / P) + (ΔP+ / P)] (This is called effective convexity)
The scaling factor used is 108; the factor is chosen to scale up the result to represent a 100
basis point change in rates.
The instructor may wish to include the following example calculation of CX for a 4 year
bond that pays interest semiannually (8 periods total) with a 10% annual coupon and an
8% annual promised ytm (r):
(m = number of compounding periods per year rather than c)
Ch 3- 7
Chapter 03 – Security Valuation 6th Edition
Teaching Tip:
If your students have had calculus, convexity can be found by taking the second
derivative of the bond price formula with respect to interest rates. The result is:
T
1t
2
old
)2t(
sem i
t
2
2
)m*ice(Pr
)r1(
CF)1t(t
)r(d
dP
(m = # compounding periods per year)
see for instance, Page 650 in Chapter 21in Investments: A Global Perspective, J.C.
Francis and R. Ibbotson, 2002, Prentice Hall, Upper Saddle River, NJ 07458.
II. Using Convexity
The predicted change in bond price for a given change in interest rates can now be found
from:
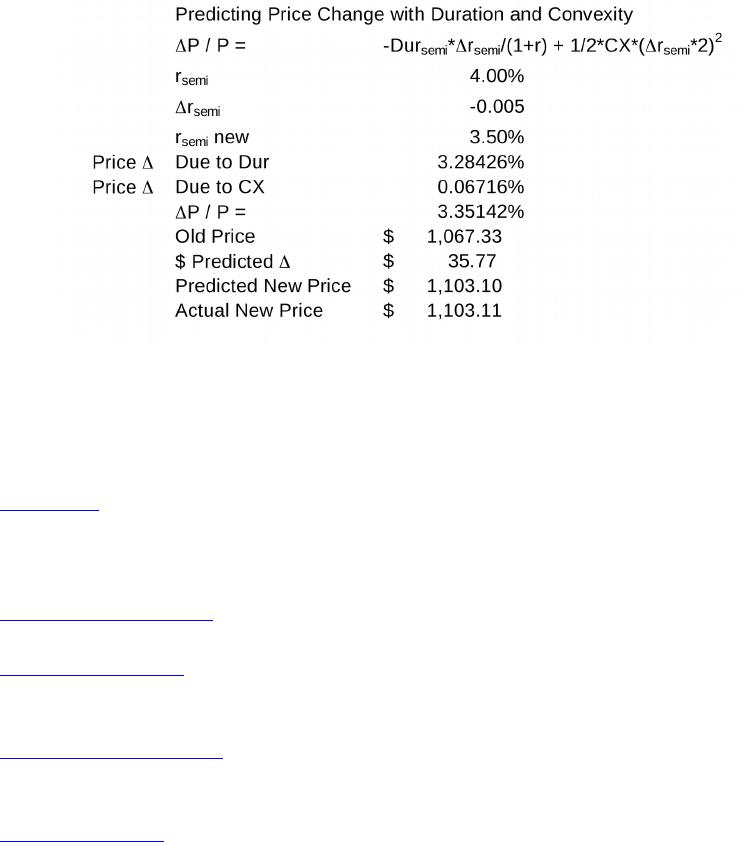
ΔP / P = -Dursemi*Δrsemi/(1+r) + 1/2*CX*(Δrsemi*2)2
where the first term is the price change based on duration and the second term adds the
correction needed due to convexity. An example is provided below:
Ch 3- 8
Chapter 03 – Security Valuation 6th Edition
With the convexity correction, there is only a negligible pricing prediction error.
Convexity increases with maturity and is inversely related to the coupon rate and
promised yield rates.
1.1.1.1 VI. Web Links
www.ft.com Financial Times, won two Espy awards for best new site
and best non U.S. news site. Coverage of global events and
markets.
www.americanbanker.com Website of the American Banker’s Association
www.bondsonline.com A bond oriented website with daily market commentary and
yield spreads
www.investinginbonds.com The Bond Market Association website has a wealth of
information for individual bond investors.
www.wsjonline.com Although not the best site for bond data the Markets Data
Center does have some key bond statistics
1.1.1.1.1.1 VI. Student Learning Activities
1. Using a spreadsheet construct a graph depicting how a bond’s price is affected by
interest rates for the following two annual payment corporate bonds:
Bond A: 5 year maturity, 12% coupon
Bond B: 25 year maturity, 6% coupon
Using whole number interest rates ranging from 4% to 15% calculate the associated
PVs and graph them. How do the two graphs differ? Why?
2. In number 1 above, if interest rates are initially at 8% and they increase to 8.5% what
is the predicted price change for each bond? What is the actual price change for
Ch 3- 9
Chapter 03 – Security Valuation 6th Edition
each? What is the error in the predicted price change for each bond? Why is the
error greater for one bond than the other? Do your answers differ if rates fall from
8% to 6.5%? Why or why not?
3. Go to the following website of the Bond Market Association: www.investinginbonds.com
and read in the section entitled, “Bond Basics,” under the “Learn More” tab the
subsection on fundamental investment strategies. Describe the four strategies found
there.
4. Go to www.alamocapital.com and describe the ‘bond of the day.’ What services are
available at this website?
5. Go to www.bondsonline.com and read the daily bond market commentary. Briefly
describe the major news events of the day.
6. Find the approximate spread between AAA and BBB rated bonds. Discuss why this
spread exists. If a AAA and a BBB rated bond have the same duration and convexity
will they have the same level of interest rate risk? Why or why not?
Ch 3- 10