
Chapter 24 – Managing Risk off the Balance Sheet with Loan Sales and Securitization 6th Edition
1. Loan Securitization (Also see Chapter 7)
In 2013 there were $1,954.7.3 billion in U.S. mortgage related securities issued by
agency and non-agency sources according to SIFMA.
In 2013 agency mortgage backed securities outstanding (MBS) totaled $5,905.6 billion or
83.9% of the total. Agency CMOs were $1,134.0 or about 16.1% of the total.
Non-Agency MBS were $1,681.9 or about 19.28% of the total outstanding.1 The
Non-Agency MBS market includes issuers involved in the bulk of the subprime market.
According to Thomson Financial, international securitization volume dropped by about
92% in the first quarter of 2008 as compared to the same time period in 2007. This was
the smallest volume at the time since 1996.2 In 2010 mortgage related issuance was
$1,746.8 billion. Almost 98% of total issuance was by government agencies in 2010 and
through May of 2011, so the private securitization market had not recovered by spring of
2011. In 2013 about 95% of MBS issuance continued to be agency backed. 3
Although at first securitization was largely limited to mortgage loans, other loan types are
now being securitized and many new institutions had entered the securitization business
before the subprime crisis.
The subprime mortgage crisis
Mortgage delinquencies increased dramatically in the last quarter of 2006 and remained
high throughout 2007. Foreclosure filings increased 93% in July 2007 over July 2006.
The delinquencies caused severe problems in the mortgage backed securities markets.
Losses from the decline in value of subprime mortgages and the securities that have these
loans as collateral are estimated at $400 billion. Financial institutions and government
agencies that invested in MBS saw the value of their holdings plummet. The largest
commercial and investment banks wrote off about $130 billion in loans. Citigroup,
Merrill Lynch and Morgan Stanley wrote off about $40 billion combined. Bank of
America and Wachovia wrote off $3 billion and $1.2 billion respectively while UBS took
looses of $10 billion. Two Bear Stearns hedge funds failed due to mortgage related
losses, eventually bringing the parent firm down with them. In February 2008 MBIA, a
bond and mortgage insurer reported a $2.3 billion loss related to mortgages it insured.
Eventually Lehman Brothers, Merrill Lynch, Wachovia, IndyMac, Citigroup, AIG,
Countrywide, GMAC and others either failed or were bought/bailed out. Global losses
from the crisis and the ensuing recession are in the trillions.
FNMA and FHLMC were quasi government agencies that are heavily involved in the
mortgage markets and securitization. These agencies reported losses of $9 billion in the
second half of 2007 related to the market for subprime MBS. In February 2008
regulators raised the caps on the size of jumbo mortgages FNMA and FHLMC could
1 All data are from the Securities Industry and Financial Markets Association (SIFMA)
website.
2 See http://banker.thomsonib.com Debt Capital Markets
3 SIFMA website data
24–1

Chapter 24 – Managing Risk off the Balance Sheet with Loan Sales and Securitization 6th Edition
purchase. In March 2008, regulators allowed both institutions to reduce their capital from
30% to 20%, both moves were attempts to add to liquidity in the ailing mortgage
markets, particularly for jumbo mortgages. The moves were expected to add up to $200
billion of liquidity in the mortgage markets and enable FNMA and FHLMC to purchase
or guarantee about $2 trillion in mortgages in 2008. Both institutions went bankrupt and
had to be placed in government conservatorship in September 2008. As of February 2011
the two agencies had cost taxpayers $133.7 billion net of funds paid back to the
government.4 However in 2012 and 2013 both entities made solid profits and have repaid
$66 billion of the funds received in 2008. The Treasury now expects a net profit of $50
billion. The return to profitability has made it more difficult to reform these institutions.
a. Pass-Through Security
With a mortgage pass-through security, after origination mortgages may be placed in a
pool held by a trustee and then mortgage pass-through securities may be sold to the
public. The pool organizer passes through all mortgage payments (less a servicing fee)
made by the homeowners, including prepayments, to the holders of the pass-through
securities on a pro-rata basis. Payments are thus monthly and are variable based on how
many homeowners pay off their mortgages early. The pool organizer and/or the
government usually provide insurance for the mortgages in the pool. Before the financial
crisis default risk was not generally a worry for a government backed pass-through
security holder (such as a GNMA pass-through). These securities do carry substantial
prepayment risk.
Teaching Tip: Privately Issued Pass-Throughs or PIPs are pass-throughs created without
government or quasi government involvement. Before the subprime crisis there were a
growing number of private mortgage pass-through issuers. They typically securitize
nonconforming mortgages that do not qualify for government insurance nor have
appropriate loan to value ratios.
The advantages of securitization:
Suppose a DI has just originated 1000 thirty year single family FHA mortgages at a 9%
rate with an average loan amount of $100,000. The DI charges a 1% origination fee to
offset processing costs. If processing costs are 0.5% then net fee income is $500,000.
After securitization the DI may retain about 35 basis points in fee income for processing
the mortgage payments. If the cost of such processing is 10 basis points, the DI nets 25
basis points of the payment amount or (0.0025 $804.62 / month 12 months 1000
mortgages) = $24,138.60 per year. The discounted present value of the annual net fee
income using a 9% interest rate over 30 years for simplicity is $247,991.5 Total
originating and servicing fee income is thus estimated at $747,991 = ($500,000 +
$247,991).
The FI can avoid the following costs and investments by securitizing the mortgages:
4 See FMCC at www.Bedford Report.com.
5 In reality the mortgages will be prepaid long before the maturity and the fee income
will be less than this.
24–2

Chapter 24 – Managing Risk off the Balance Sheet with Loan Sales and Securitization 6th Edition
Capital requirement (See Chapter 14) = $100,000 1000 0.50 0.08 =
$4,000,000.6 If having to raise equity capital increases the weighted average cost of
capital by 50 basis points, then the cost of the additional equity investment can be
estimated as 0.0050 $4 million = $20,000 per year. The total present value of this
annual cost for the 30 years using the 9% rate for simplicity is $205,473.
If the remaining funding is in the form of transactions deposits with a 10% reserve
requirement then the reserve requirement on these accounts that can be avoided is
found as $96,000,000 / (1 – 0.1) = $106.67 million or $10.67 million dollars of
noninterest earning reserves at the Fed must be held to back the deposits.7 The present
value of lost interest income on this amount over 30 years if these funds would have
been invested in liquid assets earning 5% comes to $10,165,476.89.8
Annual deposit insurance premiums (assuming a cost of 27 basis points) of $106.67
million 0.0027 = $288,009. In recent years this considerably overestimates the cost
of actual insurance premiums levied for most institutions. The present value of this
cost at 9% is $2,958,904.
Total costs avoided are $205,473 + $10,165,477 + $2,958,904 = $13,329,854
Adding up the costs avoided and the fee income allows one to see why securitization has
grown in popularity.
Teaching Tip: These numbers are very rough guidelines of the costs involved. I
constructed them from common sense, but they may not be realistic guides to actual
costs. Instructors use them at your peril!
Securitization can reduce repricing and funding gap problems (interest rate risk)
because a long term fixed rate asset is removed from the balance sheet. The process can
also be used to reduce liquidity risk. The reduction in liquidity risk occurs because the
loans are now saleable and if the FI wishes to invest in the real estate markets mortgage
backed securities that are also liquid can replace the loan investments.
1.1.1.1 Prepayment Risk
Most mortgages are set up as fully amortized loans where there will be no remaining
balance at the end of the 30 year or 15 year maturity. However, most mortgages are also
6 I assumed the SF mortgages have a 50% risk weight and I assumed an 8% minimum
capital ratio requirement similar to the text. See Chapter 13 for details on mortgage risk
weighting.
7 For simplicity we assume a zero % rate of return on deposits at the Fed, although this is
no longer strictly true the rate earned is very low.
8The amount invested in required reserves declines each year as the mortgages are
amortized, the capital required declines also. I used a spreadsheet to calculate the lost
interest on the required reserves using the declining reserve requirements each year. I
did not account for prepayments. I ignored the declining capital requirement in the
capital cost calculation because the cost was relatively small to begin with.
24–3

Chapter 24 – Managing Risk off the Balance Sheet with Loan Sales and Securitization 6th Edition
prepaid (paid off in full prior to maturity). GNMA and other pass-throughs have little or
no default risk, but they have substantial prepayment risk (see Chapter 7). Prepayments
increase in falling interest rate environments and leave the pass-through holder with a
shorter maturity instrument than expected. The duration is reduced by prepayments so
the price gains anticipated from falling rates are not as large as predicted, but the lost
reinvestment income from having to reinvest at lower rates does occur. This can
substantially reduce the investor’s realized rate of return over time. The dollars of
interest earned each month can decline fairly rapidly as interest rates drop and
prepayments increase. The reduction in total expected cash flows over the life of the
pass-through dampens the increase in price associated with the interest rate drop, but the
future value of the reinvestment income declines due to the lower reinvestment rate and
the lower amount of interest that will be received.
b. Collateralized Mortgage Obligation (CMO)
The CMO was created in 1983 by FHLMC and what was then the investment bank First
Boston as a means of repackaging prepayment risk. CMOs are created by repackaging
mortgage payment streams, or more typically, by repackaging payments on
pass-throughs. The innovation of the CMO is to offer different classes or ‘tranches’ that
offer different degrees of prepayment protection.9 The simplest form of CMO is a
sequential pay CMO (see below). This is a profitable activity for CMO backers because
the CMO investor has a better idea of the prepayment risk they face; consequently, they
are willing to pay more for a CMO than a pass-through, ceteris paribus.
CMOs are a hybrid between a pass-through and a bond. With a sequential pay CMO,
separate classes are created with different levels of prepayment protection. Suppose a
sequential pay CMO with a total pool value of $150 million has three classes, A, B and C
with principal amounts of $50 million per class. The Class A CMO holder would receive
all the initial principal payments (on the entire pool), including all prepayments on the
entire pool. These payments would reduce the Class A holders principal. Initially, Class
B and C holders would receive no principal payments until all of the principal of Class A
holders have been paid. Likewise, Class C is not affected by any prepayments until Class
B holders have been paid. The multiple classes allow investors to better choose the level
of prepayment risk desired.
Example of payments on a Sequential Pay CMO:
Suppose the mortgages in the pool have a 9% interest rate and further suppose the CMO
makes monthly payments. It could make quarterly or semiannual payments as well. The
mortgage holders make their scheduled monthly payments; if there are defaults the pool
organizer will make the scheduled payment:
Month 1 Amount paid into pool in Month 1: $2 million
Class
Beginning
Balance
Interest Due
& Paid Actual Principal reduction End Balance
A $50,000,000 $375,000 $2 mill – $1,125,000 =$875,000 $49,125,000
B $50,000,000 $375,000 $50,000,000
C $50,000,000 $375,000 $50,000,000
9 CMO tranches can also be set up for credit enhancement.
24–4

Chapter 24 – Managing Risk off the Balance Sheet with Loan Sales and Securitization 6th Edition
Total $1,125,000
Month 2 Amount paid into pool in Month 2: $3 million
Class
Beginning
Balance
Interest Due
& Paid Actual Principal reduction End Balance
A $49,125,000 $368,437 $3 mill – $1,118,437 =$1,881,563 $47,243,437
B $50,000,000 $375,000 $50,000,000
C $50,000,000 $375,000 $50,000,000
Total $1,118,437
Only Class A holders are initially affected by prepayments or any principal payments.
Once Class A principal is totally retired, Class B holders will begin to receive all
principal payments, including prepayments. CMOs sometimes have as many as
seventeen classes. Class A may have an expected maturity of 2 to 3 years, Class B may
have an expected maturity of 5 to 7 years, and Class C may have a typical expected
maturity of 8 to 10 years or more. Buyers of Class A bonds are seeking short duration
mortgage investments and are typically purchased by FIs with shorter time horizons,
including thrifts, banks and P&C insurers. Class B bonds have some prepayment
protection; these appeal to longer term investors such as banks, pension funds and life
insurance companies. Class C securities are generally desirable investments for
institutions seeking long term investments and are primarily held by pension funds and
life insurers. Each class is usually quoted at a markup over the appropriate maturity
Treasury rate. Thus mortgage investments offer a higher promised rate than comparable
maturity Treasuries with typically little or no additional default risk. Actual promised
rates depend upon expected prepayment patterns. Higher prepayments result in shorter
maturities. Pool organizers often can sell CMO claims for more total value than similar
pass-throughs because some investors are usually willing to pay more for the additional
prepayment protection.
The Z class
CMOs usually have a Z class which is different from the other classes. The Z class is a
residual claim on the mortgage pool. Initially the Z class receives no payments, but its
face value increases at a stated coupon rate. Once the principal on all other classes have
been fully paid, Z class investors begin to receive both interest and principal payments. Z
class investments are long duration and are thus risky. Faster prepayments will start
payments to the Z class investor sooner. An investor faces uncertainty when payments
will begin and how many payments will be received. Typical investors are institutions
such as hedge funds that are seeking long duration investments with higher risk and
return.
REMICs
The IRS normally rules that issuers that securitize and issue securities with multiple debt
classes are engaging in a taxable activity. If the IRS taxes the interest payments on the
mortgage backed securities CMOs could not offer competitive returns. To circumvent
this problem Congress created the Real Estate Mortgage Investment Conduit (or
REMIC) trust that was specifically exempt from IRS taxation. Most CMOs are placed in
REMICs and the industry often uses the terms interchangeably.
24–5
Chapter 24 – Managing Risk off the Balance Sheet with Loan Sales and Securitization 6th Edition
Other Types of CMOs:
1. Interest Only and Principal Only securities
Mortgage pools can be used to create mortgage pass-through strips such as interest
only and principal only securities. The interest only (IO) and principal only (PO) strips
are special types of CMOs. The IO provides the holder a pro-rata claim to all interest
payments made on the pool of mortgages. The PO provides the holder a pro-rata claim
on all principal payments made on the pool. An IO can exhibit negative convexity
because as interest rates fall, prepayments rise and the total amount of interest accruing to
these securities falls. Lower rates raise the present value of the cash flows, but the lower
overall cash flows can result in a decline in the value of the IO when rates fall. The
converse also holds. If the prepayment effect dominates the IO will exhibit negative
convexity, if the present value effect dominates it will not, so the net result depends on
changes in prepayment behavior as interest rates move. The text indicates that when
interest rates are above the coupon rate on the mortgages the IO will act more like a
standard security. This is not strictly true as IOs and POs are priced according to an
expected level of prepayments, as one would expect in an efficient market.
Nonstandard price changes can still occur because a change in rates would change the
probability of prepayments. The prepayment effect however is more likely to dominate
when rates are below the coupon rate. IOs that are expected to exhibit negative convexity
can be used by FI’s desiring to hedge against rising interest rates. Since IOs are
investments that provide cash flows, these may be more acceptable to managers than caps
or futures positions.
POs exhibit greater volatility than an equivalent maturity bond. As interest rates fall
and prepayments increase, the present value of the cash flows will rise, increasing the
value of the PO and cash payments to the PO holder are accelerated, further increasing
the value of the PO. The converse is also true. In this case, the present value and
prepayment effects both work in the same direction to increase the PO’s volatility relative
to a standard bond. POs may appeal to investors who want a potentially higher rate of
return than a standard bond offers without facing additional default risk. POs may also
be useful for FIs who wish to increase the interest rate sensitivity of their assets. For
instance, POs may be useful hedging investments for institutions with a negative duration
gap or positive repricing gaps.
Both IOs and POs can be used to hedge balance sheet interest rate exposures. These are
examples of financial engineering.
2. Planned Amortization Class CMO
An alternative to a sequential pay CMO is the planned amortization class (PAC) CMO.
The basic PAC CMO has two classes:
The PAC or Planned Amortization Class:
For a range of Prepayment Speeds, for example, 80% of standard to 250% of
standard, the maturity of the PAC and the principal and interest payments received
will not change. That is, payments will be according the original planned
amortization schedule. PAC investors have a higher degree of certainty of the
cash flows they will receive and the maturity of their investments than investors
in pass-throughs.
24–6

Chapter 24 – Managing Risk off the Balance Sheet with Loan Sales and Securitization 6th Edition
The “Companion Class.” (The text uses the term “Support Class” instead)
The Companion Class receives all prepayments as long as prepayment speed stays
within the given range. If the prepay speed moves outside the standard range,
prepayments are shared between the PAC and Companion Class.
Other types of CMOs exist. The websites of FHLMC and FNMA can provide more
examples.
c. Mortgage-Backed Bond (MBB) (See Chapter 7)
The MBB is different from a pass-through and a CMO in that the MBB does not remove
the mortgages from the balance sheet. MBBs are also standard bonds that have
mortgages as collateral. There is no ‘passing through’ of mortgage payments
(transformed or not) with MBBs. Thus MBBs do not offer the FI the main advantages of
securitization discussed above that resulted from removing the mortgages from the
balance sheet. They also leave the issuing FI with substantial prepayment risk because
the bonds require fixed coupon payments to be paid regardless of the level of
prepayments. The FI will receive the promised principal, but they must reinvest the
principal at lower interest rates while still paying the higher promised bond interest rate.
As a result, most MBBs have to be overcollateralized in order to receive a high quality
credit rating. MBBs are advantageous to investors in that the bondholders have no
prepayment risk (unless the bonds are callable). MBBs may be advantageous to the FI
because the bond issue can be used to fund the mortgages and the bond issue will have a
similar maturity to the mortgages’ expected maturity, thus reducing the repricing and
duration gap problems. The text indicates that this advantage to the FI comes at
increased risk to the FDIC because the pledged assets backing the mortgage bonds may
not be available to insured depositors in the event of FI failure. The MBB may also
actually reduce the FI’s liquidity because now the pledged mortgages cannot be sold;
moreover the FI must pledge more mortgages than bonds issued so overall liquidity can
be reduced. Due to these disadvantages, MBBs are the least used form of securitization.
Teaching Tip: With a pass-through security, the investor bears all of the prepayment risk.
With a non-callable mortgage backed bond the issuer bears all of the prepayment risk.
With a CMO the prepayment risk is shared between the issuer and the investors and the
investors can choose their desired level of prepayment protection by choosing between
the different CMO classes.
Teaching Tip: The Paulson reform plan put forth in spring 2008 suggested that regulators
encourage the use of mortgage backed bonds rather than other forms of securitization
because it makes banks maintain capital to back the mortgages. Securitization has
removed the loans from the balance sheet and may have encouraged banks to create
excessive amounts of mortgage credit to less creditworthy borrowers.
2. Securitization of Other Assets
Other assets are now being securitized (2014 Q1data): 10
10 Data are from The Securities Industry and Financial Markets Association (SIFMA)
website.
24–7

Chapter 24 – Managing Risk off the Balance Sheet with Loan Sales and Securitization 6th Edition
Asset Billions of
dollars
Automobile loans $168.3
Credit card receivables (called CARDs) 129.4
Equipment loans 22.3
Housing Related 96.5
Other (Structured Settlements, SBA, etc.) 713.5
Student loans 225.0
Total $1,355.0
In total, $1,355 billion of non-first mortgage related asset backed securities were
outstanding in 2013.
3. Can All Assets Be Securitized?
There are three reasons that securitization occurred first for mortgage loans. First, they
are highly standardized. Second, government mortgage insurance has limited the
need for buyers of mortgage backed securities to engage in individual credit risk
investigations. Before 2007 homes also generally maintained their collateral value.
Third, mortgages are long term so the costs of securitization can be efficiently spread
through time. Lack of these characteristics would seem to be the major limiting factors in
securitization of other loan types. Standardization can be achieved at the origination
level to some extent and pooling can lead to additional standardization. Third party
participants may be willing to insure against default risk, or securities buyers may be
willing to bear the default risk. In some cases such as for credit card loans, the pooling of
large numbers of borrowers and the ability to charge sufficiently high interest rates to
offset higher loss rates can overcome the default risk problem. As familiarity grows and
the costs to securitize fall, shorter term loans may be able to be securitized if sufficient
economies of scale can be achieved, perhaps by high volume. Nevertheless the terms and
risks of many loans are unique. Ultimately it is the ability to accurately assess and
measure the level of risk of the pool that may limit securitization. The more
heterogeneous the loans of a given type and the more uncertain the collateral values are
absent insurance, the more difficult it will be to successfully securitize a given loan type.
1.1.1.2
1.1.1.3
1.1.1.4 Collateralized Debt Obligations (CDOs) and Collateralized Loan
Obligations (CLOs)11
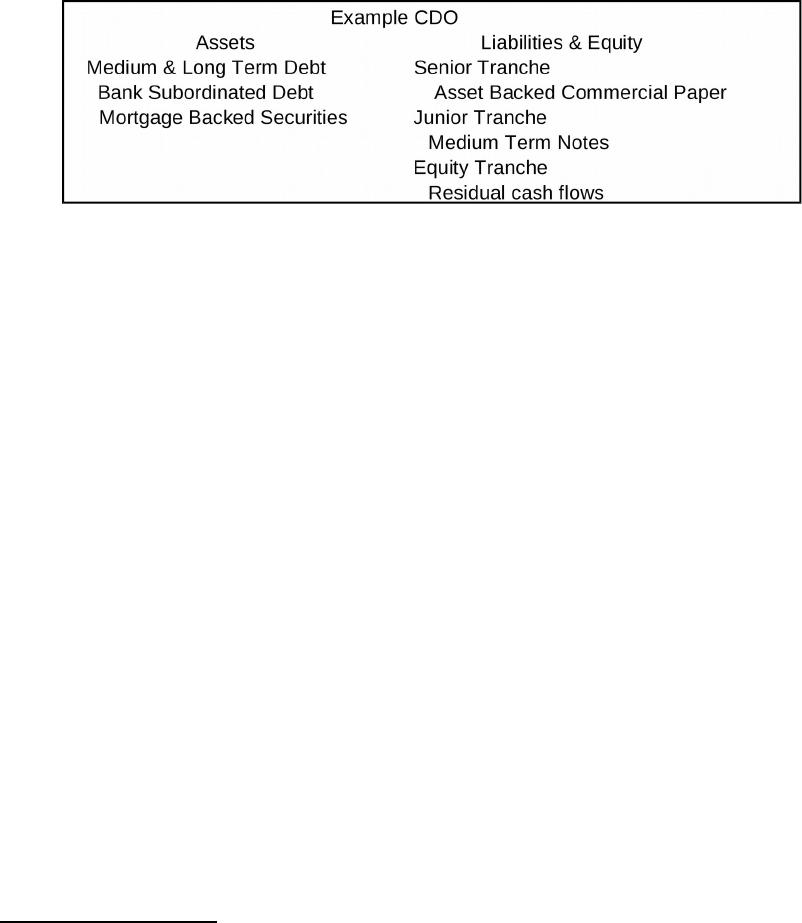
CDOs are a type of securitization that can take many forms.12 In its simplest form the
pool organizer purchases a pool of assets and using the pool as collateral issues different
claims or ‘tranches’ to CDO investors. The tranches have different levels of security.
11Information is drawn from Securities Industry and Financial Markets Association
website and from “CDOs in Plain English: A Summer Intern’s Letter Home,” Nomura
Fixed Income Research, September 13, 2004, Nomura Securities International.
12You may also hear the term SIV. A Structured Investment Vehicle (SIV) is a type of
CDO that is more actively managed and does not have a maturity date.
24–8
Chapter 24 – Managing Risk off the Balance Sheet with Loan Sales and Securitization 6th Edition
The senior tranche has a prior claim on principal and interest earned by the assets and is
usually setup so that it is overcollateralized and will have a AAA rating. A basic CDO
strategy is similar to the bond investment strategy, ‘riding the yield curve.’ The assets are
typically longer term than the liabilities. When the term structure is upward sloping this
will provide part of the profit margin to the CDO organizer who usually is an equity
investor in the CDO. These are called Arbitrage CDOs. CDOs that are used to remove
assets from the balance sheet are called Balance Sheet CDOs. See the simple example
below of a Cash Flow CDO but be aware that many variations exist.13
As the yield curve flattened in the mid-2000s profit margins were squeezed and more
CDOs began to add riskier securities to the asset pool; some added subprime mortgages.
When subprime defaults and past dues began to increase, the security of senior tranche
holders quickly evaporated and CDO organizers had difficulty persuading investors to
refinance in the asset backed commercial paper tranche.
Some CDOs were used to remove assets from the balance sheet as discussed under
securitization benefits above. Some were formed because the organizer hoped to earn the
difference between the interest earned on the assets and the interest paid to tranche
holders. This type is termed an arbitrage CDO. If the underlying asset portfolio is
predominantly loans it is termed a Collateralized Loan Obligation or CLO. If the
collateral is asset backed securities or mortgage backed securities it is called a ‘structured
finance’ CDO. A special type of CDOs called synthetic CDOs sell credit default swaps
(CDS) rather than invest in securities. Finally CDO2 are CDOs that invest in other
synthetic or cash CDOs rather than securities.
CDOs are yet another form of securitization that contributed to the credit crunch when
problems developed in the subprime mortgage markets. These instruments are
complicated and difficult to value, especially the more exotic forms. It is doubtful that all
investors understood the risks they faced. CDOs are structured based on correlation
analysis of security prices in normal markets and even small changes in the underlying
security values can result in declines in credit quality of even senior tranches. In the
credit crunch asset correlations all increased toward +1. Under most CDO contracts,
collateral declines from dropping asset values can force CDO managers to change
13 The term Cash Flow CDO means the CDO has purchased securities as assets. A
Synthetic CDO is one with credit default swap (CDS) payments as the asset. The term
Hybrid CDO is used when the CDO has both standard assets and CDS payments as
assets.
24–9

Chapter 24 – Managing Risk off the Balance Sheet with Loan Sales and Securitization 6th Edition
investment policies to restore collateralization levels. This in turn can force asset sales
and in the markets managers faced in 2007 these sales led to additional declines in asset
values. CDO issuance rose from only $10 billion in 1995 to over $500 billion in 2006.
After the financial crisis issuance in 2010 was a mere $8.7 billion although the market
recovered substantially in 2012 and 2013 when $64.3 and $90.2 billion were issued. In
2013, there were $711,170.9 million of CDOs outstanding globally.
Using CDOs allows banks to create more mortgages which are then placed into a CDO
structure. As we found out in 2007 and 2008, the banks still had responsibility for these
mortgages even though they were not required to hold capital to back them since they had
been shifted off the balance sheet. Should these complex investment vehicles be banned?
Innovations such as these that allow risk sharing probably provide net benefits to society,
but regulators must move more quickly to understand the risks involved from financial
engineering before a crisis occurs.
1.1.1.5
1.1.1.6 VI. Web Links
http://www.federalreserve.gov/ Website of the Board of Governors of the Federal
Reserve
http://www.loanpricing.com/ The Loan Pricing Corporation’s website
http://www.sifma.org/ The Securities Industry and Financial Markets
Association website. The SIFMA was created from
the merger of the Securities Industry Association
and The Bond Market Association.
http://www.ginniemae.gov/ GNMA’s website, at this site the browser can learn
about GNMA pass-throughs and REMICs.
http://www.fanniemae.com/ The Federal National Mortgage Association website
http://www.freddiemac.com/ The Federal Home Loan Mortgage Corporation
website
http://www.fdic.gov/ The Federal Deposit Insurance Corporation website
has net charge off rates for banks and thrifts.
http://www.occ.treas.gov/ Office of Comptroller of the Currency
http://www.bis.org/ Bank of International Settlements website: The BIS
collects data about derivatives usage and
promulgates risk based capital requirements
including requirements for derivatives usage.
http://www.isda.org/ International Swaps and Derivatives Association is
24-10

Chapter 24 – Managing Risk off the Balance Sheet with Loan Sales and Securitization 6th Edition
a global trade association for the derivatives
industry.
http://www.americanbanker.com/ ABA website
http://www.wsj.com/ Website of the Wall Street Journal Interactive
edition. The web version of the well known
financial newspaper can be personalized to meet
your own needs. Instructors can also receive via
e-mail current events cases keyed to financial
market news complete with discussion questions.
1.1.1.6.1.1 VII. Student Learning Activities
1. Go to FHLMC’s website and read about the process of selling mortgages to
FHLMC. How are accounts classified? After the account is classified what is required
to sell mortgages to FHLMC?
2. Go to Fannie Mae’s website under their general product information learn
about TACs PACs and sequential pay CMOs or REMICS as they are usually called.
What are the major differences? In particular, how do the risks of the types differ?
3. At Fannie Mae’s website find out what the terms floaters and inverse floaters
mean. Also what are the major risks of REMICS? Identify and explain each.
4. At the FDIC’s website find the most recent amount of loans sold with recourse
by type of loan. Which type is largest? As a percentage of loans (per type) how many
loans are sold with recourse?
5. Go to the Loan Pricing Corporation’s website. What is the LSTA/LPC
Mark-to-Market Pricing Service? How can this service help FIs that wish to sell their
loans?
6. At the SIFMA website find the excel file for Global CDO Issuance. Looking
at the CDO Type section, describe what happened to CDO issuance each year from
2005 to the present? Explain the pattern you find.
24-11