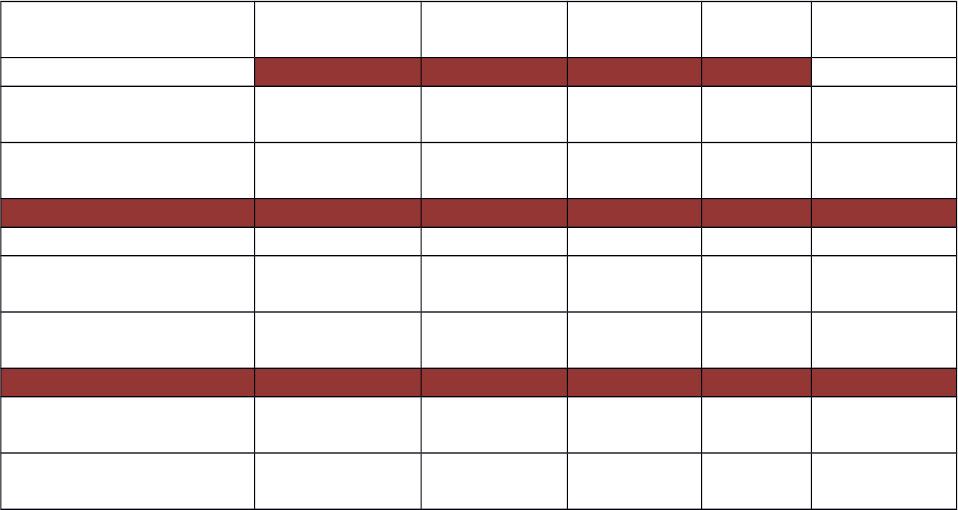
. Comparison of Hedging Methods
Table of Exposures and Methods of Hedging
Interest Rate Exposure Risk
Futures/
Forwards
Call/Put
Options
Caps &
Floors Swaps
Macrohedges Side to Pay:
+ Repricing gap or
– Duration Gap Falling rates Long Call Floor Variable
– Repricing gap or
+ Duration Gap Rising rates Short Put Cap Fixed
Microhedges
Long security or future
commitment to sell Falling prices Short Put na na
Short security or future
commitment to buy Rising prices Long Call na Na
Total Return
Swaps
Pure Credit
Swaps
Credit exposure from
loans or investments
Deteriorating
credit quality Buy Buy
a. Writing versus Buying Options
Writing options is riskier than buying options because hedges with written option positions
generally offer limited gains and unlimited losses, whereas hedges involving purchased options
offer limited losses and unlimited gains.
b. Futures versus Options Hedging
Futures hedges typically place an absolute ceiling on both gains and losses, whereas options
hedges can limit downside loss while allowing the hedger to enjoy large gains if prices move
favorably. As you might expect, hedging with options will normally involve more outright or
out of pocket costs than hedging with futures because the option buyer is purchasing a right
which can be used if it is profitable, rather than committing to a future purchase or sale.
Teaching Tip: The tradeoffs are largely due to differences in out of pocket costs and opportunity
costs plus the effects of marking to market on futures. With options there are greater up front out
of pocket costs. Options are less frequently used for hedging because many managers feel they
are too costly. Futures have less up front out of pocket costs, but may require bridge financing to
cover marking to market and because futures are a commitment they have larger opportunity
costs. Managers overcome these by partially hedging and actively trading. I don’t have hard
data but I believe that futures trading costs for institutions are also less than for trading options.
Both can have similar high leverage ratios. Leverage reduces the cost of hedging because the
hedger has lower costs to hedge with a higher leverage ratio.
c. Swaps versus Forwards, Futures, and Options
Swaps and forwards are OTC custom contracts with fully flexible terms. Futures and listed

options are highly standardized and have only limited maturities available. One of the big
advantages of swaps is their potentially long maturity. Some last 20 years or more, thus swaps
allow longer term hedging than is available with any other contract. OTC options are available
that are more flexible and may have longer maturities than listed options and futures.1 Futures
are marked to market daily and may require a hedger to put up more cash before realizing
offsetting gains in the cash market. This can distort near term earnings and may cause concern to
upper level FI managers (particularly to those that do not fully understand the hedging program).
Futures and listed options have little or no default risk. Forwards and swaps may involve
significant counterparty risk unless a third party guarantees performance. Finally, futures and
options contracts are more liquid than forwards and swaps.
1.1.1.1 Appendix 23A: Hedging With Futures Contracts (available in Connect or
from your McGraw-Hill representative)
The reader should be comfortable with the material presented in Chapter 3, Chapter 10, and both
Chapters 22 and 23 before attempting the appendices and supplement.
a. Microhedging with Futures
The number of futures contracts (NF)
From Chapter 3: (D = Duration)
F/F = -DF (RF/(1+RF)) or
F = -DF F (RF/(1+RF)) F = Total futures value F = dollar change in F
P = -DP P (R/(1+R)) P = Market value of the instrument to be hedged
If P is fully hedged then F = P, the dollar change in F offsets any dollar change in P, or
substituting from above:
-DF F (RF / (1+RF)) = -DP P (R/(1+R))
Assuming that RF / (1+RF) R / (1+R)
-DF F = -DP P
F = NF PFWhere PF = the price per contract
Substituting this in:
-DF NF PF = -DP P or
NF = (-DP / -DF) (P / PF)
Teaching Tip: The concept of NF is easy to understand as mentioned above in Section 2b. The
number of contracts needed to hedge a position is calculated as a function of two factors: 1) the
size of the cash position relative to the futures contract size (P / PF) and 2) the price volatility of
the spot relative to the price volatility of the futures contract (-DP / -DF). The larger the cash
position relative to the quantity specified for delivery in the futures contract, the greater the
number of contracts required to hedge. The greater the price volatility of the spot relative to the
1 Exchanges are concerned about trading volume because that is how they profit from a contract
and long term contracts almost always have significantly lower trading volume, limiting their
desirability for exchanges.

price volatility of the underlying futures commodity with respect to interest rates, the larger the
number of contracts needed to hedge.
Example 5:
A bank has a long position in $500,000 face value 11.03% yield Treasury Bonds that have a
duration of 11 years. The bank is concerned about rising interest rates between now and August.
The bonds have a price quote of 91 1/32 or $455,156. T-Bond futures contracts call for the
delivery of $100,000 face value of Treasury Bonds. The September contract (the nearest to
August) has a price quote of 89 (or $89,000) and the underlying T-bonds to be delivered have a 7
year duration and a 9.397% yield.2 How many futures contracts are needed to fully hedge the
position?3
NF = (-11 / -7) ($455,156 / $89,000) = 8.036 or 8 contracts should be sold. Always round the
number of contracts down, because hedging efficiency is improved if one slightly underhedges
rather than overhedges.
If prices move according to the duration predictions (convexity notwithstanding) then the hedge
should prevent large gains or losses from occurring for normal interest rate movements. For
instance if rates rise 50 basis points:
F = PF NF = – 7 (0.0050 / 1.09397) $89,000 = $2,847.43 gain per contract 8 contracts
= $22,779.42.
The price of the futures contract drops, but a drop in price makes money for a short position in
futures.
The predicted change in the spot value is
P = – 11 (0.0050 / 1.1103) $455,156 = -$22,546.68
The predicted net gain or loss is the difference or $232.74.
b. Macrohedging With Futures
A macrohedge is normally designed to immunize the equity value with respect to interest rate
changes. I.E. we desire E = 0. From Chapter 22,
E = – [DA – kDL] A (R / (1+R))
F = – DF NF PF (RF / (1+RF)) Setting E = F and if the interest rates and rate changes
are the same:
– [DA – kDL] A = -DF NF PF Solving for NF yields:
2T-bond futures contracts are priced according to the cheapest to deliver bond. The deliverable
bond must have at least a 15 year time to first possible call or maturity, and is priced as if it were
an 8% coupon bond. I used these terms to arrive at the yield price combination on the futures
contract.
3In this case RF does not equal R but R = RF. Omitting the (1+R) and (1+RF) terms usually
does not materially affect the hedge. If the change in rates is not likely to be similar between the
cash and futures instrument (as in a cross hedge), then one should include the different rate
changes. For instance, RF may be characterized as an expected percentage of R based on
regression analysis of historical changes of the two rates.

FF
LA
F
PD
AkDD
N
Example 6:
Suppose a $500 million bank has an average asset duration of 3 years and an average liability
duration of 1 year (See Chapter 23 of the IM for this example). The bank also has a total debt
ratio of 90%. If R is 12% and the bank is expecting a 50 basis point increase in interest rates,
how many T-bond futures contracts are required to fully hedge the equity value if the Treasury
bond futures terms are the same as in Example 5?
Expected E from the rate change is – [3 – (0.901)] $500 million (0.0050 / 1.12) =
–$4,687,500.
39.685,1
000,89$7
Million500$)190.0(3
N
F
Or the FI should sell 1,685 contracts.
If interest rates increase 50 basis points and prices move according to duration predictions then
the gain on the futures position will be:
F = PF NF = – 7 (0.0050 / 1.09397) $89,000 = $2,847.43 gain per contract 1,685
contracts = $4,797,920
As before the price of the futures contract drops, but a drop in price makes money for a short
position in futures. The net gain (loss) is $4,797,920 – $4,687,500 = $110,420.
1.1.1.2
1.1.1.3 Appendix 23B: Hedging with Options (available in Connect or from your
McGraw-Hill representative)
This supplement examines hedges with purchased options, not written options for the reasons
discussed in the chapter.
Let O = the total dollar change in the value of an option position and then O = (NO o)
where NO = the number of option contracts and o equals the dollar value change per contract.
For a Treasury bond contract let B = market value of the underlying T-bonds ($100,000 face
value).
B
B
R
R
B
B
o
o
Appendix Equation 2
o / B = the option’s delta (see Chapter 10). It is in the range 0 to +1 for a call option and 0 to
–1 for a put option. It is literally N(d1) from the Black-Scholes model and measures the change
in option value per dollar change in the underlying bond price. Write the delta as . Rather than
differentiate between the hedging equations for puts and calls, it is simpler to remember that the
delta is positive for a call and negative for a put.
B / RB = the change in the underlying bond price per 1 basis point change in interest rates.
This is equal to [-DurB / (1+RB)] B. (Note that DurB / (1+RB) is sometimes called the ‘modified
duration’ or MD for short so B / RB = -MD B.)
In words, the first component measures the change in option value per dollar change in the
underlying bond’s price, the second term measures the underlying bond’s price response to an
interest rate change, and the third term measures the size of the interest rate change.
Rewriting Equation 2
B
B
BB
B
B
R
R
xBDurRB
R
Dur
o
11
Appendix Equation 6
Recall that N0 = total number of option contracts purchased and then the total dollar change in
option value O = NO x o.
To hedge O must equal Spot.
Spot
R
R
DurSpot
Spot
Spot
Spot
1
Equation A
Setting Spot = O, letting br =
)Spot
Spot
B
R(
R
)R(
R
1
1
B
and solving for NO:4
brBDur
SpotDur
N
B
Spot
O
Appendix Equation 13
Example 7: (Continuation of Example 5)
A bank has a long spot position in $500,000 face value 11.03% yield Treasury Bonds that have a
duration of 11 years. The bank’s managers are concerned about rising interest rates between now
and August. The bonds have a price quote of 91 1/32 or $455,156. September put options on
T-bond futures are available with an exercise price of $90 per $100 of face value. The
September options (the nearest to August) have a premium of $1.625 per $100 of face value and
the put option delta is –0.52. The contracts are for $100,000 face value T-bonds. The underlying
T-bonds to be delivered have a 7 year duration and a 9.397% yield for an $89,000 price. How
many put option contracts are needed to fully hedge the position?
4 For a macro hedge the numerator to Equation 13 will be (DurA – k DurL) x A. See Appendix
Equation 8.

NO =
contracts 15.22
1.01493$89,00070.52
$455,15611
or 15 put contracts should be purchased. The
total cost of the contracts is 15 $1.625 $100,000 / $100 = $24,375 or 5.35% of the market
value of the bonds.
If prices move according to the duration and delta predictions, then the hedge should prevent
large gains or losses from occurring for normal interest rate movements. For instance if rates
increase 50 basis points:
O = o No = 0.52 – 7 (0.0050 / 1.09397) $89,000 = $1,480.66 gain per contract 15
contracts = $22,210.
As before Spot = – 11 (0.0050 / 1.1103) $455,156 = -$22,547.
The net difference in this case, is -$337 excluding the put premiums. The net loss including the
premiums is -$24,375 + -$337 = -$24,712. Recall that option outcomes are not symmetric, if the
bond price increases the puts will expire worthless but the gain in bond prices may outweigh the
put premiums. You may wish to have the students calculate the breakeven point as an exercise.
The breakeven would occur when prices have risen $24,375 if the puts had been exactly at the
money.
Basis risk: On a direct hedge basis risk can probably be safely ignored. The correction for basis
risk is the term br and it may be omitted for a direct hedge.
Appendix 23C: Hedging with Caps, Floors, and Collars (available on Connect or from your
McGraw-Hill representative)
An FI has the following balance sheet categorized over a 2 year planning period:
Assets
Amount
(Mill $)
Liabilities
& Equity
Amount
(Mill $)
RSAs @ 5% $ 50 RSLs @ 4% $100
FRAs @ 6% $350 FRLs @ 5% $300
NEA $ 60 Equity $ 60
Total $460 Total $460
Current Profitability Amount Spread Profitability
RSAs financed by RSLs $ 50 1% $0.5
FRAs financed by FRLS $300 1% $ 3
FRAs financed by RSLs $ 50 2% $ 1
$400 Total $4.5
Since the category NEA financed by equity has a zero spread
and does not contribute to profitability it can be omitted.
Profitability after rate
increase Amount Spread Profitability

RSAs financed by RSLs $ 50 1% $0.5
FRAs financed by FRLS $300 1% $ 3
FRAs financed by RSLs $ 50 1% $0.5
$400 Total $4.0
The FI has a 1% spread on rate sensitive and fixed rate assets, but the FI has a negative repricing
gap of $50 million and is thus at risk from rising interest rates.5 This FI could purchase a 2 year
cap with a cap rate of 4.5% with a notional principal that matches the bank’s gap of $50 million
with payments made annually. The cap may cost the FI $5,000. Let interest rates increase such
that that all RS rates increase 100 basis points. The FI would then receive the difference between
5.5% and the cap rate of 4.5%. In other words the FI would receive 1% * $50 million =
$500,000.
Profitability after rate
increase with Cap Amount Spread Profitability
RSAs financed by RSLs $ 50 1% $0.5
FRAs financed by FRLS $300 1% $ 3
FRAs financed by RSLs $ 50 1% $0.5
$400 Total $4.0
Cap $50 1% $0.5
Total w/ Cap* $4.5
* Ignoring the cost of the cap
The cap protects the FI’s profits from an increase in interest rates for two years with payments
made each year. Note that the hedge is not perfect, particularly if the rate sensitive accounts
reprice more frequently than once a year. A floor would work similarly for an institution at risk
from falling interest rates. The FI may wish to sell a floor to defer some of the costs of
purchasing the cap.
Collars:
The above FI may wish to hedge with a cap, but feels that the cost of the cap is too high. The FI
could then also sell a floor with a lower interest rate of say 4%. To simplify, assume that the cap
and floor are for one year and have only a payment at maturity. In this case the FI’s profit
diagram, including the on balance sheet changes, would be as follows:
5 Recall that in this case the FI has $50 million in FRAs financed by RSLs.
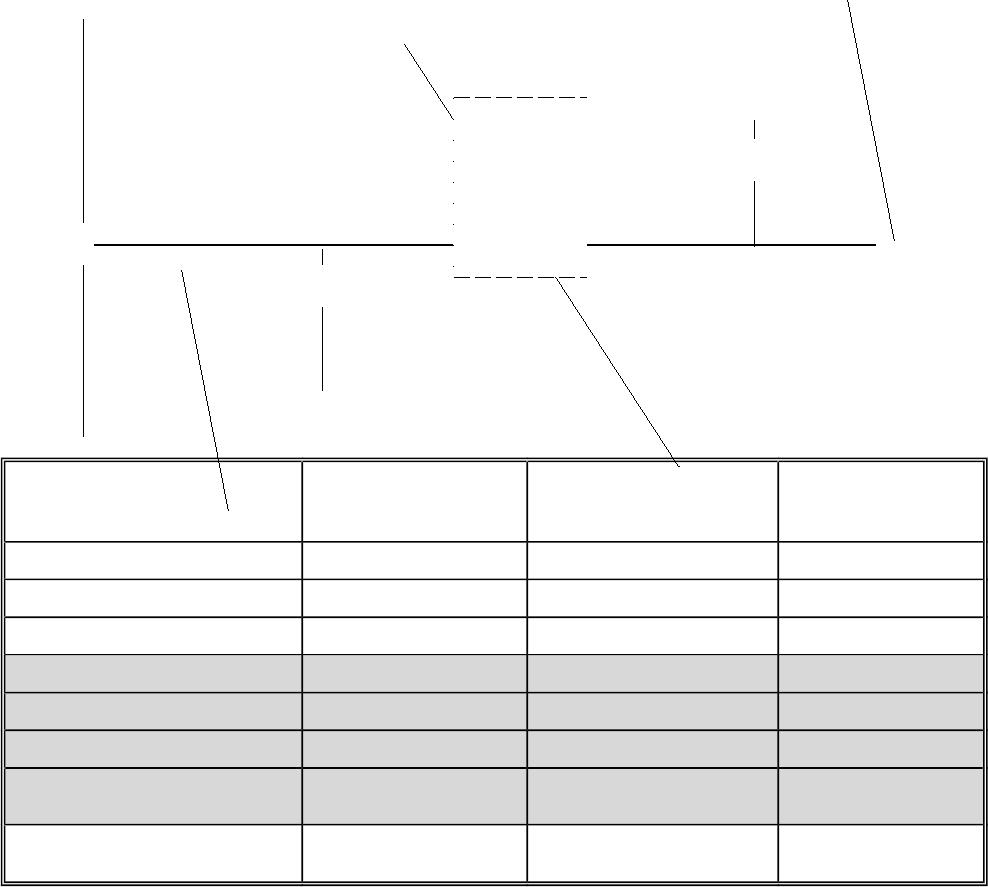
Profit
1.1.2 Profit Table at Time
T when the options
expire in one year IT < EFloor EFloor < IT < ECap 1.1.3 IT > ECap
NP*(FRA – RSLT) NP*(FRA – RSLT) NP*(FRA – RSLT) NP*(FRA – RSLT)
-NP*(FRA – RSL0) -NP*(FRA – RSL0) -NP*(FRA – RSL0) -NP*(FRA – RSL0)
-C0-C0-C0-C0
+F0+F0+F0+F0
+CT 0 0 NP*(RSLT – Cap)
-FT -NP*(Floor -RSLT) 0 0
= Profit
-C0+F0 +
NP*(RSL0 – Floor)
-C0+F0 +
NP*(RSL0 – RSLT)
-C0+F0 +
NP*(RSL0 – Cap)
Breakeven
F0 – C0
=NP*(RSL0-RSLT)
NP = Notional principal, assumed the same for the gap and the options, Ct and Ft represent the value of
the cap and floor at time t respectively. T = 1 year, 0 = today. E = exercise rate
1.1.3.1 Supplement: Hedging with Swaps
c. Macrohedging with Swaps
To protect the value of equity the swap should be designed to yield a gain equal to E (the
change in equity value) if interest rates change. The swap is a negotiated contract so that the
duration of the fixed and variable sides of the contract can be constructed as needed. Likewise
the notional principal is negotiable. The swap designer is limited only by the ability to attract a
counterparty willing to enter into the deal. It is also only necessary to manage the net duration of
the swap. The swap duration to a fixed rate payer is equal to the duration of the variable
payments minus the duration of the fixed payments. The converse is true for the variable rate
payer. Nevertheless it is convenient to solve for the optimal notional principal for a given
duration of the fixed and variable sides of the swap. Note that the duration of the variable
EFloor
St
E
$0
ECap
F0 – C0 =
NP*(RSL0–
RSLT)

payments (or floating payments) is simply the time until the payments are reset.
The optimal notional principal of the swap NS can be found as:
NS = [(DA – kDL)A] / [Dfixed – Dfloating] where Dfixed is equal to the duration of the fixed payments
and Dfloating is equal to the duration of the floating or variable payments.
Example 8: Continuation of Example 6
Suppose a $500 million bank has an average asset duration of 3 years and an average liability
duration of 1 year. The bank also has a total debt ratio of 90%. R is 12% and the bank is
expecting a 50 basis point increase in interest rates.6 The FI can enter into a swap where the
duration of the fixed rate payments is 6 years and the duration of the variable rate payments is 1
year. What is the optimal notional principal of the swap that immunizes the equity value? Does
the FI make or receive the fixed rate payments?
NS = [(3 – (0.91))$500 million] / [6 – 1] = $210 million. The FI has a positive leverage
weighted duration gap so it has longer duration assets than liabilities. To reduce the duration gap
the FI would pay fixed (effectively extending the liability duration) and receive variable
(effectively shortening the asset duration).
d. Fixed Floating Currency Swaps
Example 9:
A Japanese FI has made variable rate dollar denominated loans to Taiwanese borrowers.
The loans are funded by fixed rate yen deposits. The Japanese FI is at risk from dropping
Eurodollar interest rates and from a depreciating dollar.
A U.S. bank has made fixed rate yen loans to multinationals operating in the Far East, but
these loans are funded by variable rate dollar deposits. The U.S. bank is at risk from
rising U.S. interest rates and from a depreciating yen (appreciating dollar).
The two institutions can design a swap that limits the risk of both parties. Separate the
risks and handle them individually when faced with more complex swap arrangements.7
The Japanese FI faces interest rate risk from falling interest rates. They have too many variable
rate assets so the Japanese FI will pay a variable rate of interest in exchange for receiving a fixed
rate of interest.
The U.S. FI faces interest rate risk from rising interest rates. They have too many fixed rate
assets so the U.S. FI will pay a fixed rate of interest in exchange for receiving a variable rate of
interest.
The Japanese FI faces currency risk from a depreciating dollar as this will reduce the yen value
of repayments made by the Taiwanese borrowers. The Japanese FI will thus pay dollars in
6 R may be thought of as either the average rate or return on assets and liabilities or as the return
on equity.
7This assumes the risks are not hedged elsewhere. There is also an implicit assumption that the
swap deal is the cheapest source of hedging the risk. On balance sheet hedges (called money
market hedges) could also be used. The Japanese FI could borrow dollars at a variable rate and
directly hedge the risk. The size and popularity of the swap market indicates that swaps are often
the cheapest method of reducing the risk.
exchange for receiving yen. The yen received will be used to pay off its fixed rate yen
depositors.
The U.S. FI faces currency risk from an appreciating dollar (depreciating yen) as this will reduce
the dollar value of the yen repayments made by the multinational borrowers. The U.S. FI will
thus pay yen in exchange for receiving dollars.
Putting it together is now simple in concept:
The Japanese FI will pay dollars at a variable rate of interest in exchange for receiving
yen at a fixed rate of interest.
The U.S. FI will pay yen at a fixed rate of interest in exchange for receiving dollars at a
variable rate of interest.
1.1.3.2 VI. Web Links
http://www.federalreserve.gov/ Website of the Board of Governors of the Federal Reserve
http://www.fdic.gov/ The Federal Deposit Insurance Corporation website has net
charge off rates for banks and thrifts.
http://www.occ.treas.gov/ Office of Comptroller of the Currency
http://www.cmegroup.com/ Chicago Mercantile Exchange Group (website of both
CME and CBOT since the merger)
http://www.bis.org/ Bank of International Settlements website. The BIS
collects data about derivatives usage and promulgates risk
based capital requirements including requirements for
derivatives usage.
http://www.isda.org/ International Swaps and Derivatives Association is a global
trade association for the derivatives industry.
http://www.economist.com/ The Economist, an excellent current event magazine
covering international business, politics, finance and
economics. Excellent source of context about countries
and regions of the world.
http://www.fasb.org/ FASB webpage
http://www.americanbanker.com/ ABA website
http://www.wsj.com/ Website of the Wall Street Journal Interactive edition. The
web version of the well known financial newspaper can be
personalized to meet your own needs. Instructors can also
receive via e-mail current events cases keyed to financial
market news complete with discussion questions.
1.1.3.2.1.1 VII. Student Learning Activities
1. Research the failure of the so called hedge fund, Long Term Capital Management.
An excellent video on LTCM titled “Trillion Dollar Bet” is available from WGBH Boston
Video (the video may also be seen from time to time on PBS Television). Was LTCM a hedge
fund? Why or why not? What was the problem with their hedging strategy? Does hedging
reduce risk to the extent that textbook examples imply? Why or why not?
2. Go to the CME group website and read the introduction to financial futures. What are
the specific contract terms for the T-bond contract? What is meant by the ‘cheapest to deliver’
bond? How does one determine which bond is cheapest to deliver? What are the ‘adjusted
futures price’ and the ‘adjusted cash price?’
3. Go to the FDIC website and calculate each of the following ratios (you will have to
examine several tables):
For interest rate contracts
Notional value of interest rate swaps / Gross Loans for all banks and the largest and
smallest bank categories
Futures and forward contracts / Gross Loans for all banks and the largest and smallest
bank categories
Purchased options / Gross Loans for all banks and the largest and smallest bank
categories
Written options / Gross Loans for all banks and the largest and smallest bank categories
Explain what the numbers mean and the differences among the different size banks.
4. How does the Dodd-Frank 2010 Act affect over the counter derivatives? Research the
bill and summarize the main changes that affect deriv