1. Liquidity Risk And Insurance Companies
a. Life Insurance Companies
Life insurers face liquidity risk due to unexpected policy cancellations and working capital
needs. If an insurer cancels (surrenders) a policy with a cash value, the insurer must pay the
surrender value of the policy to the insured. Some policies also allow the insured to borrow
against the value of the policy. Both situations can cause funds needs. Insurers typically rely on
new premiums to help meet liquidity needs. They also hold liquid assets and can sell portions of
their long term investment portfolio if necessary although the latter sales may occur at
disadvantaged prices. A run occurred on First Capital Insurer in 1991 due to junk bond losses
when new premiums were not forthcoming and surrenders increased dramatically.
b. Property-Casualty Insurance Companies
P&C insurers have more liquidity risk than life insurers because the payouts on their liabilities
are more unpredictable and the maturity of their claims is shorter than life insurance claims.
Consequently, P&C insurers hold more liquid assets than life insurers, and they tend to reprice
their claims more frequently to help limit risk. Large unexpected claims and unexpected policy
terminations are major sources of liquidity risk for P&C firms. Catastrophic events such as the
2001 terrorist attacks, the slides in California and Hurricanes Katrina and Sandy indicate how
unpredictable and large liquidity needs can be at this type insurer.
AIG became embroiled in the financial crisis because the company sold extensive amounts of
credit default swaps (CDSs). CDS sellers must pay in the event of default of the underlying
credit. Problems in mortgages led to payouts and collateral requirements far beyond AIG’s
ability to pay and forced the firm into a bailout. AIG received government assistance worth $127
billion. The breakdown consisted of $45 billion from TARP, $77 billion to buy collateralized
debt and mortgage backed securities and a $44 billion bridge loan.
c. Guarantee Programs for Life and Property-Casualty Insurance Companies
Although insurers cannot offer policyholders federal insurance, many states either sponsor or
require the insurance firms in their state to operate insurance guarantee funds. Most states do
not have permanent funds, and the policy claims are not a liability of the state. Rather when a
failure of an insurer occurs, the remaining insurance firms are assessed a premium to help pay off
the failed insurer’s claims to policyholders. The payments are often capped per year and there
can be long delays before the policyholders of the failed insurer receive all their promised value
if they ever do.
2. Liquidity Risk And Investment Funds
Open end mutual funds face liquidity risk because they must redeem shares from shareholders
upon demand. Runs on mutual funds can occur but for different reasons than bank runs. Mutual
fund shares are pro-rata claims, not full pay or no pay, so mutual fund investors lack the
incentive to try to be first in line to receive their cash. It is the pay in full or no pay characteristic
of deposits that encourages banks runs. If investors fear that the value of the mutual fund shares
will drop, large numbers of investors may attempt to redeem their shares all at once, using up the
fund’s cash reserve and forcing the fund to liquidate some of its holdings.1 This provides a
similar effect as a run and could be termed as such. Heavy mutual fund redemptions may further
depress the prices of the fund’s asset holdings, leading to additional redemptions and a repeat of
the cycle. This is essentially what happened in the stock market crash of October 1987 and
happened in money market mutual funds after the Primary Reserve Fund experienced large
losses on its Lehman holdings. The following week investors liquidated $170 billion of money
fund investments, prompting the Fed to backstop all money fund assets.
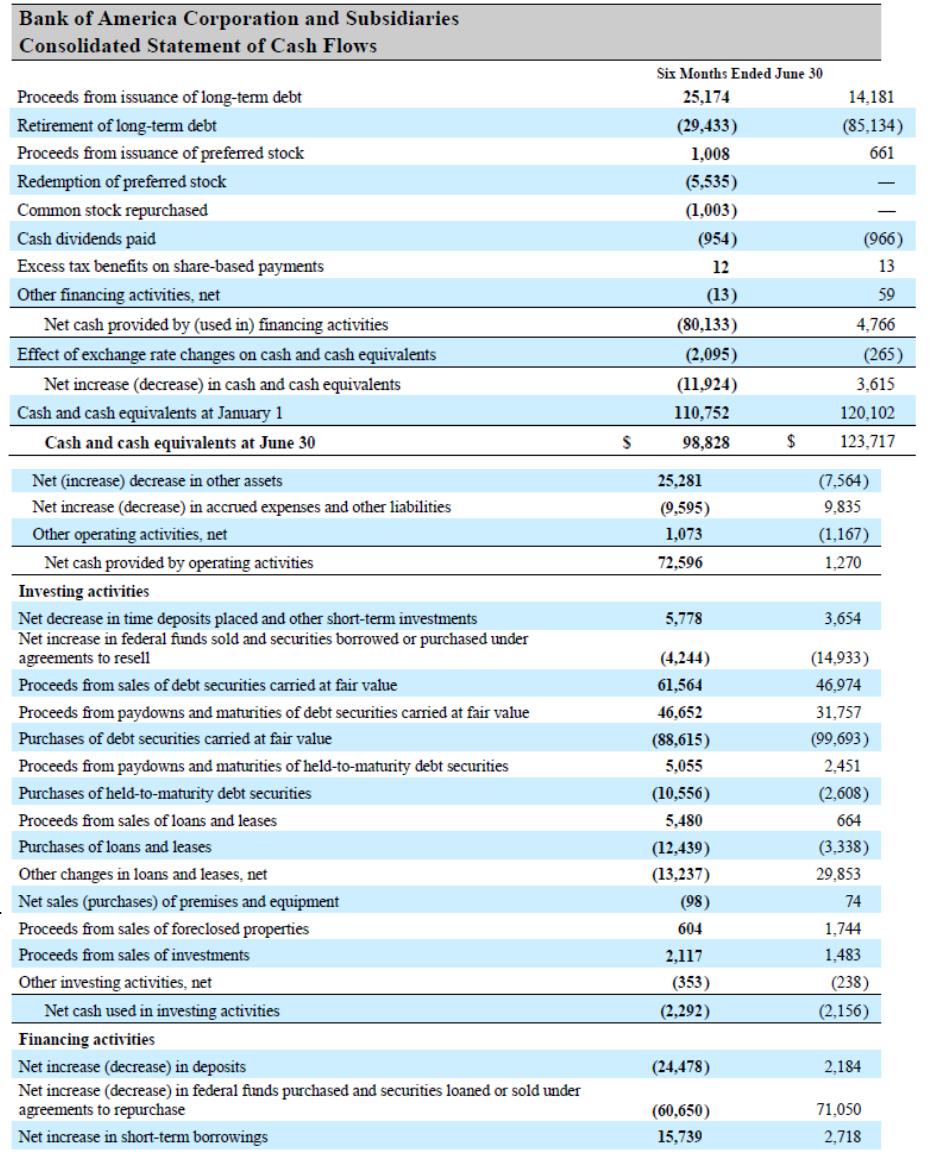
Appendix 21A: Sources and Uses of Funds Statement: Bank of America (available in Connect or
from your McGraw-Hill representative)
The appendix presents a consolidated statement of cash flows for Bank of America reproduced
below:
1Closed end mutual funds do not face this risk. For them liquidity is needed only to be able to
purchase investments quickly without having to liquidate some other part of the investment
portfolio.

Appendix 21B: New Liquidity Risk Measures Implemented by the Bank for International
Settlements (BIS) (available on Connect or from your McGraw-Hill representative)
The financial crisis revealed that many institutions did not have sufficient liquidity management
programs in place. As a result the BIS developed two new liquidity measures that will be phased
in. The first the Liquidity Coverage Ratio will be implemented in 2015:
High quality assets are defined to be assets that remain liquid even in times of economic stress
and must be accepted as collateral at the Fed’s Discount Window. The assets must also be
unencumbered. The liquid assets are divided into two types, Level 1 and Level 2. Level 1
includes cash, central bank reserves and sovereign debt. There is no limit on the amount of
Level 1 assets that can be included. Level 2 liquid assets are subdivided into Level 2A and Level
2B. Level 2A includes mortgage backed securities backed by the government and AA- or high
rated corporate bonds. Level 2B assets include conventional residential MBS, lower rated
corporate bonds and blue chip equities. The amount of Level 2B assets is capped at 15% of the
stock of high quality liquid assets. The amount of overall Level 2 assets that count is capped at
40% of the total high quality assets. Moreover a 15% haircut is applied to all Level 2 assets.
The total quantity of high quality liquid assets is the sum of Level 1 assets and the allowable
amount of Level 2 assets.
Total net cash outflows are equal to outflows minus the minimum of the following (expected
inflows or 75% of outflows). Outflows are based on the deposit base and composition, debt
maturations and loan commitments. Inflows must be of sound quality and are capped at 75% of
outflows so that the bank does not excessively depend on expected inflows. Details are provided
in Appendix Table 21-14.
The second measure is the Net Stable Funding Ratio (NSFR). The NSFR measures the
institution’s stable funding sources to the liquidity of its assets and funding commitments that
may arise from off balance sheet activities. The measure attempts to require a minimum level of
stable funding to offset on and off balance sheet liquidity requirements over a one year time
horizon. It limits overreliance on short term sources to fund long term assets. The NSFR is
100%
dayscalendar 30next over outflowscash net Total
assets liquidquality high ofStock
Ratio CoverageLiquidity

measured as:
The numerator consists of bank capital, preferred stock with a maturity > 1 year, other liabilities
with a maturity greater than one year and the portion of retail and wholesale deposits that could
be counted on to remain with the bank during periods of economic stress. The amounts of each
type that can be counted are provided in Text Table 21-15. The required stable funding is
assigned by the regulators and is summarized in Text Table 21-16. The required stable funding
measures are somewhat similar in concept to the risk based asset weightings used in calculating
risk weighted assets.
Regulators also examine other factors such as contractual maturity mismatches and
concentrations of funding sources that may not be available in a crisis. In addition the LCR can
be monitored for different currencies and high frequency trade data may be monitored by
regulators.
1.1.1.1 VI. Web Links
http://www.federalreserve.gov/ Website of the Board of Governors of the Federal Reserve
http://www.investors.com/ Investor’s Daily is a website that provides investors with
current information, it is a companion site to the Investor’s
Business Daily publication.
http://www.fdic.gov/ The Federal Deposit Insurance Corporation website has net
charge off rates for banks and thrifts.
http://www.naic.org/ The website of the National Association of Insurance
Commissioners
http://www.sec.gov/ The SEC’s website.
http://www.wsj.com/ Website of the Wall Street Journal Interactive edition.
1.1.1.1.1.1 VII. Student Learning Activities
1. Obtain any bank’s 10K report and estimate the current financing gap and financing
requirement. How large is the requirement as a percentage of assets? What does your
estimate tell you? Explain.
2. Obtain two banks’ financial statements and calculate the following ratios:
Borrowed funds to total assets, Core deposits to total assets, Loans to deposits and
Commitments to lend to total assets. Using these ratios compare the two banks’ liquidity
positions. Which is more likely to need to rely on borrowed funds? In which bank would you
100%
funding stable ofamount Required
funding stable ofamount Available
NSFR
rather be a depositor? A shareholder? Explain.
3. Investigate a case where an insurance firm failed. What was the cause of failure?
Did liquidity risk cause the failure, or did liquidity problems emerge as the institution’s other
problems mounted? Explain.
4. Obtain the financial data for a life insurer and a P&C insurer. Calculate the
percentage of liquid assets held by each. Explain the differences in your findings.
Explain why a mutual fund may need to maintain substantial liquid asset holdings but a similar
closed end fund needs only fewer liquid assets holdings