a. Mid-Market Commercial and Industrial Lending
Mid-market loans consist of loans to corporations with annual sales of $5 million to $100
million. Loan maturity ranges from a few weeks to eight years or more and loan amounts range
from very small amounts such as $100,000 to $1 billion or more to major corporations. In
mid-market lending on up, the evaluation process will normally be more detailed and require the
lender to both objectively and subjectively evaluate the loan application. Steps in the process
may include:
Meeting the applicant’s customers and suppliers, particularly if there is one or only a few
major buyers or suppliers of the product or service.
Procuring a credit history such as a Dun and Bradstreet report, etc.
Application of the Five C’s of Credit:
Character (see above)
Capacity (cash flow to service the loan)
Collateral: There may be a specified maximum loan to value ratio in the loan policy.
Conditions: Assessing the impact of changing economic conditions on the borrower’s
ability to repay the loan.
Capital: Assessing the adequacy of the borrower’s capital to prevent insolvency.
The Five C’s may be assessed by asking the following questions about the given categories:
Production of marketable output (capacity and conditions):
Are there stable supplies and costs of inputs? For example, for lumber mills
dependent on logging of federal lands, stability of supply has been lacking in recent
years. If applicable what are union wage demands and the probability of costly
strikes. What is the firm’s competitive advantage? Is it a differentiated product with
high markup? These firms’ sales can be sensitive to the economy and technological
and taste changes. Firms producing near commodities rely on different advantages.
These may include supply procurement and distribution advantages or customer
service, and/or economies of scale to maintain profitability.
Management (character and conditions):
Is management trustworthy? Have they been excessively ‘cooking the books?’ Has
management cooperated with the loan officer’s investigation? What is the employee
morale and turnover rate? How credible is the business plan? (Does the firm plan at
all!) Is the firm likely to require additional financing over the loan period? Are they
aware of this? Has the firm planned for financing of additional working capital if
needed? To what extent does the business rely on one or only a few key people who
could not be easily replaced?
Marketing (conditions):
Is the firm in a growing industry or is stealing market share from competitors the only
way to generate sales growth? Has the firm allocated sufficient resources to
marketing the firm’s product? Excessive resources? Is the firm at risk from losing
distribution channels to competitors? Is the firm dependent on sales to one or only a
few countries?
Capital (capital and collateral):
Does the firm have sufficient equity? Do the firm’s managers have significant equity
holdings to ensure they are concerned with firm performance? What is the firm’s
debt capacity? How specific are the assets to the given borrower? Are they useful

only to firms in the same industry?
The statement of cash flows is a primary tool in assessing the capacity of a borrower. The cash
flow statement breaks down sources and uses of cash into cash flow from operations, from
investment activity and from financing sources. The lender will wish to assess that cash flow
from operations is sufficient to service the potential loan. A wise lender will ask for a schedule
of actual cash disbursements and receipts. The statement of cash flows does not provide this
information. Cash flow from operations are cash inflows and outflows that result from
producing and selling the firm’s product or service including net income, depreciation and
operations related working capital accounts such as changes in inventories, payables and
receivables. Cash flow from investing is cash from purchase and sale of fixed assets as well as
cash from financial investing activities. Cash flows from financing are cash flows that are
related to changes in the financial accounts such as short and long term debt and equity.
The following balance sheet and income statement for a hypothetical loan applicant can be used
to illustrate a simple statement of cash flows and ratio calculations.
Change Assets 2013 2014 Liabilities & Equity 2013 2014 Change
($60) Cash $170 $110 Accounts payable $135 $120 ($15)
$200 Accounts rec. 500 700 Notes payable 1,200 1,400 $200
($240) Inventory 1,240 1,000 Total current liabilities 1,335 1520
Total current 1,910 1810 Long-term debt 2,005 2,620 615
$1,500 Fixed assets 2,000 3,500 Common stock 100 200 100
Retained earnings 470 970 500
Total assets $3,910 $5,310 Total liab. & equity $3,910 $5,310
Income Statement 2014
Sales $8,800.00
Costs ($5,600.00)
Depreciation ($900.00)
EBIT $2,300.00
Interest
Expense
($350.00)
EBT $1,950.00
Taxes ($760.50)
Net Income $1,189.50
Dividends $689.50
Change RE $500.00
Summary Cash Flow Statement 2014
A: Cash Flow From Operations $ 2,464.50

B. Cash Flow From Investing ($ 2,400.00)
C. Cash Flow From Financing ($ 124.50)
D. Change in Cash ($ 60.00)
Notice that although the firm has positive earnings, cash decreased. Ordinarily the loan applicant
should have positive operating cash flows. Cash from investing may be positive or negative,
depending on the rate of return the firm is earning these investments may generate good growth.
In the case above the lender would wish to verify that the borrower will have sufficient return on
investment the fixed asset increases to ensure that the firm will have adequate cash balances to
repay the loan. A trend of declining operating cash flows financed by cash flow from financing
would be a red flag as this is probably not sustainable in the long run. This would imply the firm
is borrowing more (possibly from you) to sustain dropping profitability.
Various ratios may be analyzed: The numbers are calculated from the data above.
Liquidity ratios
Current ratio = Current Assets / Current Liabilities = 1.19
Quick ratio (acid test) = (Cash + Cash equivalents + Receivables) / Current Liabilities
= 0.53
These ratios measure the firm’s ability to pay its debts in the short run. If the firm sells big ticket
items, or has a large number of days sales in inventory, the quick ratio may be the better measure.
Asset management ratios
Days sales in receivables = (Receivables 365) / Credit Sales = 29
Days in inventory = (Inventory 365) / Cost of Goods Sold = 65
Sales to fixed assets = Sales / Fixed Assets = 4.40
Asset turnover = Sales / Total Assets = 1.66
Asset management ratios assess management’s ability to manage a given area of assets such as
inventory or receivables. High ratios may suggest problems in credit management or inventory
management or simply low sales. The turnover ratios measure the number of dollars of revenue
generated per dollar invested in the given asset category. Recall that the asset turnover ratio is a
major input into ROE.
Debt (long term solvency) ratios
Debt to asset or total debt ratio = Total Liabilities / Total Assets = 78%
Times Interest Earned: EBIT / Interest Expense = 6.57
Cash flow to debt ratio = (EBIT + Depreciation ) / Debt1 = 77.3%
EBIT is earnings before interest and taxes, EAT is earnings after taxes
These ratios measure the firm’s ability to pay off its debts in the long run. These need to be
assessed in light of the earnings variability of the firm and industry norms. The text includes
variations of the fixed charge coverage ratio. Fixed charges may include interest, lease and
sinking fund payments. The minimum acceptable fixed charge ratio will be higher with greater
cash flow variability. At a minimum the cash flow to debt ratio should also be greater than the
interest rate on the debt.
1Only by coincidence will the numerator of this ratio actually equal cash flow because it ignores
changes in balance sheet accruals.
Profitability ratios
Gross margin = Gross profit / Sales = 36%
Operating profit margin = Operating profit / Sales = 26%
Net profit margin = EAT / Sales = 13.5%
Return on assets = EAT / Average total assets = 22%
Return on equity = EAT / Total equity = 101.7%
Dividend payout = Dividends / EAT = 57.9%
These ratios measure the firm’s ability to generate profitability (gross, operating or net) per
dollar of revenue or per dollar of assets or equity. The first three ratios measure management’s
ability to control given expense categories. The ROA and ROE ratios are guides to the firm’s
rate of return on invested dollars. In this case the profitability is very high, but so is the amount
of reinvestment and even with the high profitability the firm had to borrow more money to pay a
dividend.
Note that market ratios are often unavailable for this size firm.
Other commonly used tools include common size and indexed statements in order to focus on
comparisons with competitors or over time.
Teaching Tip: Software will provide the ratios to the loan officer automatically. I have had
discussions with a loan officer who indicated that the typical undergraduate or even MBA had a
difficult time interpreting the ratios so it is worthwhile to ensure that students can not only
calculate the numbers, but that they also know what they mean.
Midmarket loans on up usually require approval from a senior loan officer and his or her superior
or a loan review committee. These requirements will be in the loan policy.
Follow-up: The loan evaluation process does not end with loan approval. In particular, before
the actual draw down the lender will ensure that all ‘conditions precedent’ that may prevent the
seizure of any pledged collateral have been cleared. The lender must also monitor the conditions
of the borrower and the collateral and review the credit needs of the borrower. These reviews
normally occur at least annually. Some loans will also be spot checked randomly.
Limits to Ratio Analysis
Ratio analysis has many limitations. First, a ratio by itself tells very little, some benchmark of
comparison is needed. For many smaller loan applicant firms, benchmark data may not be
available. On the other hand, large firm loan applicants are often involved in multiple lines of
business, and this can make ratio comparisons difficult as well because there is no one industry
to use as a benchmark. Differences in accounting treatments can lead to substantial differences
in ratios, even if the lender’s management is not purposefully intending to mislead creditors as
was the case at Enron, WorldCom, Adelphia and others. Benchmark data may be found at Value
Line Investment Surveys, Robert Morris Associates, Hoovers Online and MSM Money Web.
The FFIEC web site can also be used to generate peer data for comparison purposes.
b. Large Commercial and Industrial Lending

We normally picture the banker as the tight fisted Scrooge type to whom we have to prove we
don’t really need the money before he or she is willing to lend to us! In reality the market for
lending to large corporations is quite competitive and the bargaining power of the bank lender is
very limited.2 Large corporations have other funding alternatives, including the U.S. and foreign
money and capital markets and other banks, both domestic and foreign. Even though banks
cannot often charge large fees to these borrowers, nor earn large spreads over costs on their
loans, the loan amounts are large enough to make lending profitable. In addition, lending
activities may bring other business to the bank that generates substantial fee income.3
Teaching Tip:
The growing overlap between commercial and investment banking creates a potential conflict of
interest in credit evaluation. A bank may pressure its own credit officials to grant more
questionable loans in order to generate (or keep) the investment banking business of that loan
applicant. I do not believe that the ramifications of the FSMA have been fully appreciated by
regulators and I believe that we can expect more problems (and scandals) in the future.
Credit analysis of large commercial borrowers entails the same process as described above in the
analysis of mid-market borrowers, but there are some additional complicating factors:
If the bank lends to a holding company whose assets are its investments in operating
subsidiaries, the bank’s claim is subordinated to the debtors of the operating subsidiaries.
The corporate borrower is likely to be a large, diversified firm that operates in many
locations, probably even in different countries and in various industries. This greatly
complicates the task of assessing the creditworthiness of the borrower.
Banks also have some advantages in lending to large corporate borrowers:
Ratings agencies such as Moody’s and Standard and Poor’s provide information about the
credit risk of the borrower.
Market analysts such as Value Line, Hoovers and a plethora of Wall Street analysts provide
current (albeit biased) forecasts of future earnings and growth prospects.
Sophisticated credit scoring models have been developed for these firms:
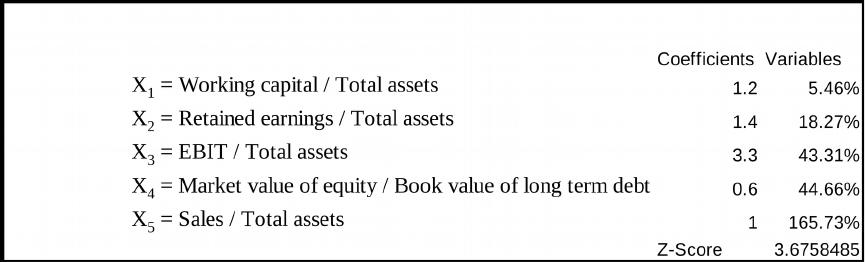
Altman’s Z-Score
54321
X0.1X6.0X3.3X4.1X2.1Z
X1 = Working capital / Total assets
X2 = Retained earnings / Total assets
X3 = EBIT / Total assets
X4 = Market value of equity / Book value of long term debt
X5 = Sales / Total assets
The higher the Z-score, the lower the probability of borrower default. A borrower with a
Z-score less than 1.81 is considered to have high default risk, a Z score of 2.99 or more
2If you are a fan of old TV shows, picture Milburn Drydesdale instead of Scrooge.
3Banks may act as a broker and dealer of swaps and foreign exchange, may provide trust
services, finance their foreign trade activities, assist in raising capital overseas, underwrite public
security offerings and provide advice about restructurings and investments, etc.
indicates low default risk and a Z–score between 1.81 and 2.99 indicates that the loan
applicant’s default risk is indeterminate (i.e. the applicant cannot be classified as either
high or low risk).
Altman Z example using the balance sheet and income statement data:
The Z-score indicates the firm is not at risk of bankruptcy, assuming that the
methodology is appropriate for this size firm.
Appropriate uses of a credit score model:
Credit scores are an analytical tool that can determine some of the differences between
borrowers that previously defaulted versus borrowers who did not. They can provide the
lender with valuable information about whether a loan applicant closely resembles the
profile of borrowers who have defaulted on prior loans. This is especially useful in
assessing the financial aspects of credit analysis, but it is weaker in assessing character
and management strength.
Credit scores can also assist in risk pricing and the establishment of loss reserves on
accepted loans, and in any case can help provide the lender with quantifiable
documentation about why an application was accepted or rejected. Use of a credit
scoring model alone to make a large credit lending decision would be inappropriate
because this would ignore too many other relevant factors.
General limitations of credit scoring models include:
A credit score model depicts caricatures of reality. In practice, there are many types of
‘default’ ranging from late payments to outright repudiation of debts.
The weightings on the variables and the variables themselves are only statistical
artifacts and are not theoretically based. Consequently there is little reason to believe
that the appropriate weights are stable through time.
All models are simplifications of reality. They ignore relevant factors such as the
relationship the lender has with the borrower, the reputation of the borrower and a
host of important macro factors. A good example of this problem occurs if a bank is
asked to engage in a highly leveraged transaction or HLT loan. Credit scores and
ratio analysis are likely to suggest rejecting the loan. If the potential corporate
borrower is an otherwise profitable major bank customer the bank may feel it must
participate in the loan. The loan may be syndicated to share the risk. Bank refusals to
participate in HLTs led to the development of the junk bond market. Banks must
weigh the loan credit risk against the risk of permanently losing customers as the
borrowers become familiar with raising debt funds through a growing number of

alternative methods.
Finally there is no agency that collects data on the characteristics of both ‘good’ and
‘bad’ borrowers, although some FIs are now keeping and sharing this information,
hence the development of better credit scoring models is hindered by a lack of data.
Lying on applications continues to be a problem. This requires verification of the
information provided.
Moody’s Analytics (KMV) credit scoring model:
The Moody’s model is based on option pricing. The common stock of a corporate
borrower can be viewed as a call option on firm value with an exercise price equal to the
book value of the firm’s debt. The ‘option’ feature is represented by the limited liability
of common stock. If the value of assets is less than the value of the debt the equity
holders default. This is equivalent to not exercising the option. If the value of the assets
at debt maturity is greater than the value of the debt, the stockholders (owners) exercise
the option on firm value by paying off the debt. Using the value of the stock, it is
possible to determine the underlying implied asset volatility and the market value of the
firm’s assets. With this data and the amount of debt, it is then possible to estimate the
probability that the call option winds up in the money (no default) or out of the money
(default). The probability of default is called the ‘expected default frequency’ or EDF.
Moody’s provides EDFs for 60,000 public companies (and many more private ones)
worldwide. Simulations have shown that the Moody’s model outperforms both the
Altman Z model and ratings changes by Standard & Poor’s.4 The Moody’s model will
normally predict changes in default probability ahead of ratings because the EDFs are
constructed using stock market data which is updated frequently whereas ratings
evaluations occur only at periodic intervals such as quarterly or annually. See for
instance Text Figure 20-2 for changes in bankruptcy probability for a sample firm.
In April 2009 the Credit Rating Agency Reform Act was passed. The act gives the SEC
regulatory authority over ratings agencies.
Teaching Tip:
Ratings agencies have an inherent conflict of interest that may prevent them from downgrading a
company as rapidly as firm or market conditions would imply; namely, the ratings agencies
receive substantial fees from the companies they rate. Empirical evidence has generally
concluded that market prices of securities reflect the changing bankruptcy probability
substantially sooner than ratings changes. For instance, Enron was downgraded, but continued to
be rated investment grade by Moody’s, S&P and Fitch as late as several weeks before it declared
bankruptcy. At the time, the stock’s price was trading at only $3 per share.5 It is increasingly
obvious that the business model used by ratings agencies needs to be fixed. In hindsight, the
ratings agencies appear to have been unduly influenced by security issuers and investment
bankers and/or have underestimated the riskiness of various firms and complex debt issues. The
4 For more information, see http://www.moodyskmv.com/.
5 See “Thoughts on Enron: What Happened, Why and How it Can Be Avoided Again,”
Testimony of Frank Partnoy, Financial Engineering News, June/July 2002.
government limits the number of ratings agencies which limits competition. The securities
issuers pay for the security rating, which creates an inherent conflict of interest. Negotiations
between issuers and raters on the final ratings are also common. Evidence indicates that security
prices move ahead of ratings changes, so analysts are uncovering the information before the
raters. Obtaining and maintaining a rating appears to be some kind of ‘check off’’ procedure
required, not an up to date analysis of the actual default risk of the security. Historically,
investors paid for the ratings rather than the issuers. Perhaps we should return to that type
business model.