1.1.1.1.1Chapter Two
Determinants of Interest Rates
1.1.1.2 I. Chapter Outline
1. Interest Rate Fundamentals: Chapter Overview
2. Loanable Funds Theory
a. Supply of Loanable Funds
b. Demand for Loanable Funds
c. Equilibrium Interest Rate
d. Factors that Cause the Supply and Demand Curves for Loanable Funds to Shift
3. Movement of Interest Rates over Time
4. Determinants of Interest Rates For Individual Securities
a. Inflation
b. Real Risk Free Interest Rates
c. Default or Credit Risk
d. Liquidity Risk
e. Special Provisions or Covenants
f. Term to Maturity
5. Term Structure of Interest Rates
a. Unbiased Expectations Theory
b. Liquidity Premium Theory
c. Market Segmentation Theory
6. Forecasting Interest Rates
7. Time Value of Money and Interest Rates
a. Time Value of Money
b. Lump Sum Valuation
c. Annuity Valuation
1.1.1.3 II. Learning Goals
1. Know who the main suppliers of loanable funds are.
2. Know who the main demanders of loanable funds are.
3. Understand how equilibrium interest rates are determined.
4. Examine factors that cause the supply and demand curves for loanable funds to
shift.
5. Examine how interest rates change over time.
6. Know what specific factors determine interest rates.
7. Examine the different theories explaining the term structure of interest rates.
8. Understand how forward rates of interest can be derived from the term structure of
interest rates.
9. Understand how interest rates are used to determine present and future values.
1.1.1.4 III. Chapter in Perspective
This is the first of several chapters that familiarize students with the determinants of valuation of
bonds and related securities. In this chapter the authors first focus on the economic determinants
of interest rates using the flow of funds theory of interest rates. Subsequently, unique
characteristics of securities that give rise to different interest rates are discussed. This chapter
has four major sections. The first major topic covers interest rate formation in a ‘loanable funds’
framework. The loanable funds theory is the most basic explanation of real risk free interest rate
formation in the economy and is easily understood by students. The loanable funds theory
describes general economic forces in the economy that determine the opportunity cost of funds
which may be thought of as the real, riskless rate. The next section explains why individual
investments have different interest rates because of their unique characteristics. The effect of
maturity on interest rates is explained in greater detail in the term structure discussion. Three of
the main theories of the term structure are presented. The chapter then provides a brief example
of using term structure mathematics to forecast interest rates. The final section provides a review
of basic time value calculations. The sixth edition of the text drops the discussion of calculating
the effective annual rate that had been in prior editions.
1.1.1.5 IV. Key Concepts and Definitions to Communicate to Students
Real riskless rates vs nominal riskless rates Inflation
Compound and simple interest Default risk premiums
Annuity Liquidity risk premiums
Unbiased expectations Term structure
Liquidity premiums Maturity premiums
Market segmentation Future value and present value
Forward rates Safe haven
1.1.1.6 V. Teaching Notes
1. Interest Rate Fundamentals: Chapter Overview
1.1.2 The interest rates that you actually see quoted are nominal interest rates; as a
result, nominal rates are sometimes called ‘quoted rates.’ The purpose of the
chapter is to examine the components of the nominal interest rate. They are a) the
real riskless rate of interest that is compensation for the pure time value of money,
b) an expected inflation premium that is time dependent and c) a risk premium for
liquidity, default and interest rate risk.

2. Loanable Funds Theory
The interaction of supply and demand of funds sets the basic opportunity cost rate (real riskless
interest rate) in the economy. The Federal Reserve estimates supply and demand of funds from
households, business, government and foreign sources through its flow of funds accounts. Flows
of funds tables are available at the Federal Reserve website at www.federalreserve.gov. The
Federal Reserve (Fed) has pushed short term interest rates to near record lows in order to
stimulate the economy and has pursued a policy of quantitative easing (purchasing government
and mortgage debt by creating money) in an additional attempt to encourage spending and
investment. In mid-2013 the Fed announced it would begin gradually tapering its bond
purchases although the Fed has continued to promise to keep short term interest rates low well
into 2015.
a. Supply of Loanable Funds
Source Federal Reserve
Flow of Funds Matrix
Year 2012 data
Net Supply in Billions
of Dollars
Households & NPOs $982
Business Nonfinancial 219
State & Local Govt. -253
Federal Government -1,126
Financial Sector 56
Foreign 446
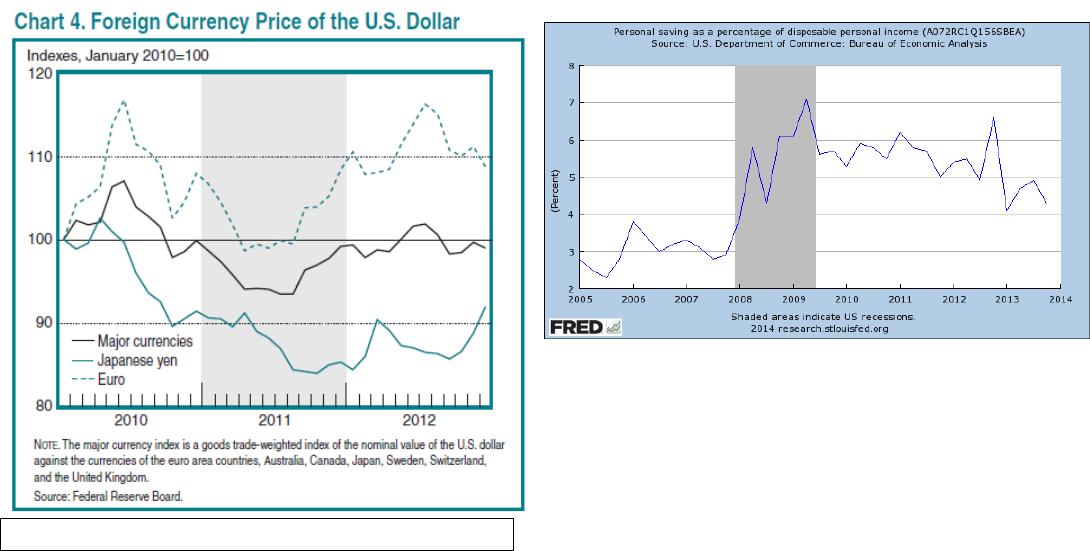
The predominant suppliers of loanable funds are households. Household savings rates have
increased since the financial crisis. The second largest net supplier of funds is the foreign sector.
The U.S. remains highly reliant on foreign sources of funds to meet our funds’ demands. This
reliance becomes increasingly problematic with the continued long term fall in the value of the
dollar.
Household savings increase with higher interest rates and the supply curve is upward sloping
with respect to interest rates. However, the main determinants of household savings are 1)
income and wealth, the greater the wealth or income, the greater the amount saved, 2) attitudes
about saving versus borrowing, 3) credit availability, the greater the amount of easily obtainable
consumer credit the lower the need to save, 4) job security and belief about safety of the Social
Security system and 5) tax policy. In the U.S. tax policy favors borrowing but taxes virtually all
savings (except retirement savings). As a result, the supply curve is steeper than one might
expect. The instructor may wish to explain that at higher interest rates, savers do not have to
save as much to hit specified future values, so savings are not that sensitive to interest rates.
Where consumers put their savings is sensitive to interest rates, they move out of liquid accounts
as interest rates rise (as the price of foregoing higher rates of return to maintain liquidity rises).
Source: www.bea.gov/scb/pdf/2013/10%20October/1013_internaonal_services.pdf
Source: FRED data, Federal Reserve Bank of St. Louis
Households apparently try to smooth consumption patterns over different levels of income. As
income falls they save less to maintain consumption, as income rises households save more.
Other factors include the perceived riskiness of investments, near
term spending needs, Federal Reserve policy and general economic conditions. Favorable
economic conditions also increase savings by increasing income and wealth. Note that on net the
foreign sector is the second largest supplier of funds. Foreign funds suppliers examine the same
factors as U.S. suppliers except that they must also factor in expected changes in currency
values, global interest rates, different tax rates and sovereign risk. There is typically some built
in demand for U.S. investments however because the U.S. is considered a safe haven, i.e., a
country with relatively low political and economic risk and a stable currency.
The dollar is used to price many commodities, including oil and gold; the dollar is the primary
foreign currency reserve asset for many central banks and many exports are dollar denominated
even if the ultimate destination is not the U.S. Some feel that the dollar will lose its reserve
status eventually if China continues to grow and dominate Asia and if Europe increases its
commitment to growth policies while continuing to deconstruct some of their increasingly
expensive social welfare programs. The time frame required for a major shift away from the
dollar may be ten to twenty years or even much longer however, because China will remain far
too risky for quite a while and Europe must demonstrate a commitment to growth and solve its
Source: St. Louis Federal Reserve FRED data
sovereign debt problems. China has made several moves lately to free up yuan trading. China
now allows exporters to sell some of their foreign currency earnings, allows limited individual
trading in its currency and allows yuan financing in international markets. China still maintains
capital controls however.
Foreign central banks hold a large amount of foreign currency reserves, the bulk of which are in
dollars (about 60% of foreign currency reserves are in dollars).
Country Foreign Currency Reserves (all $ in billions)
China $3,317
Saudi Arabia 643
Russia 538
Taiwan 398
S. Korea 327
Source: Economist 2013
These high levels of reserves are indicative of foreign central bank activity to limit the growth in
the value of their currencies against the dollar. This may be done to stimulate their export
sectors. The dollars are often reinvested in the U.S., typically in Treasuries. This provides an
additional source of financing to the U.S. and helps remove a market discipline from U.S.
borrowers. Since the money is more or less automatically rechanneled into the U.S., U.S.
interest rates don’t rise as much as they would have otherwise when U.S. entities spend more
than their income and need to borrow the difference from overseas. This promotes overspending
by U.S. entities and can result in asset price bubbles similar to what happened in stocks in the
later 1990s and housing in the 2000s.
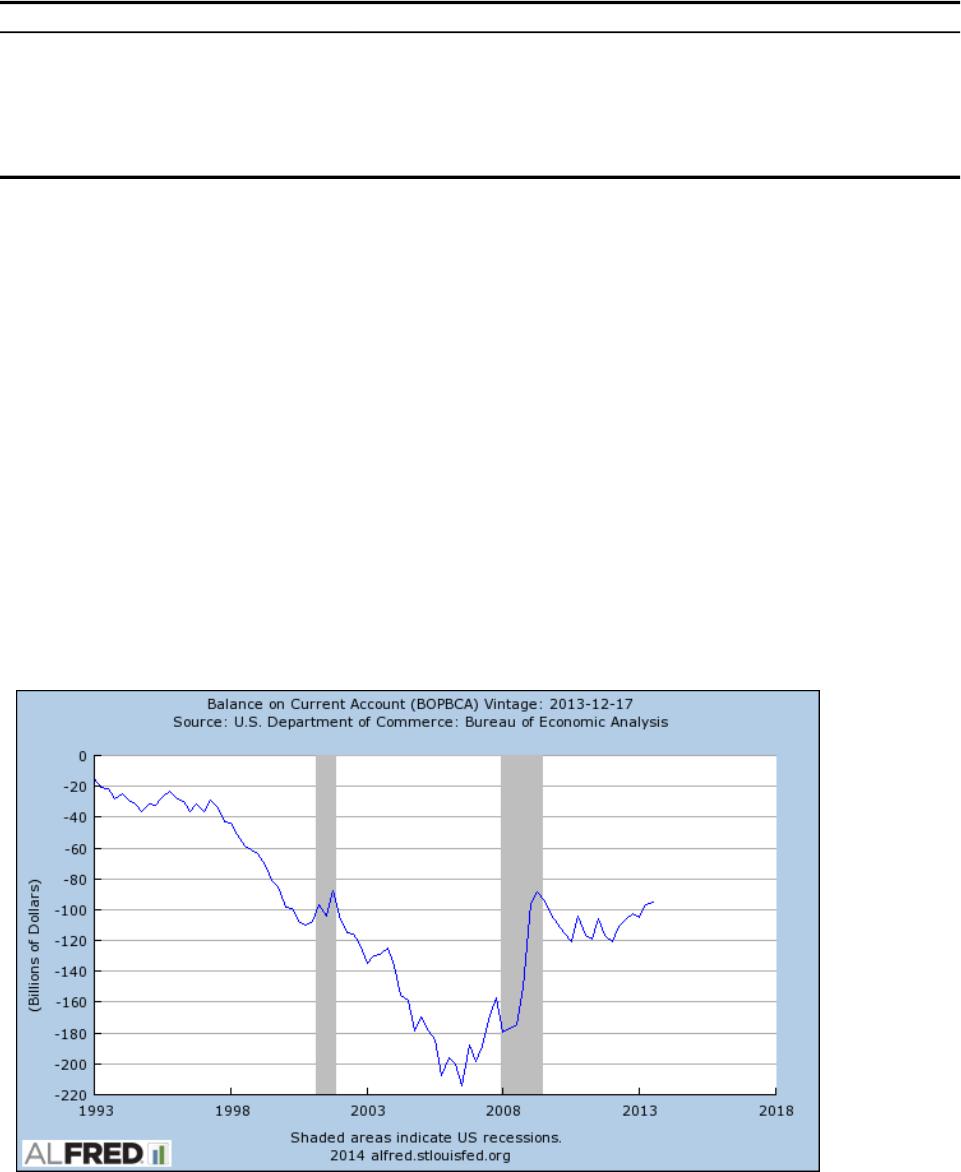
The negative balance on the U.S. current account (see below) represents excess importing over
exporting, or similarly, excess spending over income. The balance has to be financed with
capital account transactions or offset by changes in official reserves to prevent the dollar from
declining. For the most part the balance is maintained by borrowing from overseas (and net
selling of U.S. assets to foreigners). The U.S. net indebtedness to the rest of the world was about
$4.46 trillion in 2013 (about 27% of GDP).
Whether or not this is a serious problem depends on how much money is reinvested in the U.S.
and how we use the money reinvested. It certainly points out the U.S. dependence on foreign
funds.
b. Demand for Loanable Funds
The quantity of loanable funds demanded is greater at lower interest rates. Businesses prefer to
finance internally when interest rates are high. The demand for loanable funds by households for
big ticket items is quite sensitive to interest rates as these items comprise a large percentage of
their budget (homes, autos, boats, etc). The Federal government’s demand for funds is relatively
insensitive to interest rates, but not wholly so because much of the interest owed on the Federal
debt is financed by borrowing. As interest rates rise, the Federal government has to borrow more
to pay off the interest on the existing debt. The Federal budget is likely to remain in deficit for
the next 10 years at least.
State and local government financing is also quite sensitive to interest rates. New municipal
offerings drop when interest rates rise. Not surprisingly, government entities that cannot print
money (or raise taxes) are more sensitive to financing costs! Many states are now in financial
difficulty because many are required to balance their budgets under state laws, and the recession
has decreased the amount of tax revenues and increased state spending on assistance programs.
Moreover, the weaker economy has highlighted the overly generous pension benefits promised to
state workers that now look unaffordable as federal stimulus money ends.
c. Equilibrium Interest Rate
It is the job of the 12 Federal Reserve banks to estimate aggregate supply and demand of funds
from the various sectors at different interest rates and then build the aggregate supply and
demand curves. In free capital markets the interest rate observed will tend toward equilibrium at
the rate that intersects the supply and demand curves for each traded instrument.
d. Factors that Cause the Supply and Demand Curves for Loanable Funds to Shift
1.1.2.1.1.1.1 Increase in Affect on Supply Affect on Demand
Wealth & income Increase N/A
As wealth and income increase, funds suppliers are more willing to supply funds to
markets. Result: lower interest rates
Risk Decrease Decrease
As the risk of an investment decreases, funds suppliers are less willing to purchase the
claim. All else equal, demanders of funds would be less willing to borrow as well.
Result: higher interest rates
Near term spending needs Decrease N/A
As current spending needs increase, funds suppliers are less willing to invest. Result:
higher interest rates
Monetary expansion Increase N/A
As the central bank increases the supply of money in the economy, this directly increases
the supply of funds available for lending. Result: lower interest rates
Economic growth Increase Increase
With stronger economic growth, wealth and incomes rise, increasing the supply of funds
available. As U.S. economic strength improves relative to the rest of the world, foreign
supply of funds is also increased. Business demand for funds increases as more projects
are profitable. Result: indeterminate effect on interest rates, but at more rapid growth
rates interest rates tend to rise.
Utility derived from assets Decrease Increase
As utility from owning assets increases, funds suppliers are less willing to invest and
postpone consumption whereas funds demanders are more willing to borrow. Result:
higher interest rates
Restrictive covenants Increase Decrease
As loan or bond covenants become more restrictive, borrowers reduce their demand for
funds. Result: lower interest rates
Tax Increase Decrease Increase
Taxes on interest and capital gains reduce the returns to savers and the incentive to save.
The tax deductibility of interest paid on debt increases borrowing demand. Result:
Higher interest rates
Currency Appreciation Increase N/A
Foreign suppliers of funds would earn a higher rate of return if the currency appreciates
and a lower rate of return measured in their own currency if the dollar depreciates.
Foreign central banks often buy U.S. Treasury securities as part of their attempts to
prevent their currency from appreciating against the dollar.
Result: Lower interest rates
Expected inflation Decrease Increase
An increase in expected inflation implies that suppliers will be repaid with dollars that
will have less purchasing power than originally anticipated. Suppliers lose purchasing
power and borrowers gain more than originally anticipated. This implies that supply will
be reduced and demand increased. Result: Higher interest rates
The marginal propensity to consume (MPC) and the marginal propensity to save (MPS) affect
household choices of how much of their income they wish to spend and save respectively. The
MPC had increased (and the MPS decreased) inter-generationally in the U.S. before the financial
crisis. This change probably came about because of reduced stigma associated with debt and
increased availability of credit. Since the crisis the amount of consumer credit to riskier
individuals has declined, along with income growth, and one would thus expect savings rates to
be higher than during the boom years.
3. Movement of Interest Rates Over Time
Interest rates fluctuate in a nearly continuous manner due to the actions of traders. In a free
market (capitalist) society, governments do not set prices. Interest rates are the price of
borrowing money associated with a specific instrument or claim. Actions to buy, sell and issue
securities affect interest rates. In turn, demand and supply of funds fluctuate daily as current and
expected macro and instrument specific conditions evolve.