
1. Balance Sheet Regulations
a. Regulations on Commercial Bank Liquidity
Under Federal Reserve Regulation D banks are currently required to meet minimum liquid asset
requirements to back transactions deposits. Since 1980 all DIs must back their net transactions
deposits with reserves held at the Federal Reserve.1
Appendix 13D: Deposit Insurance Coverage for Commercial Banks in Various Countries
(available on Connect or from your McGraw-Hill representative)
Text Appendix 13D contains a detailed example of calculating reserve requirements.
Transaction accounts are demand deposits, NOW accounts and share drafts (offered by
credit unions).
The computation period is the length of time over which the level of required reserves is
calculated. In the U.S. the reserve computation period begins on a Tuesday and ends on a
Monday 14 days later. Thus the U.S. uses a two week computation period. The minimum
daily average reserve level that a bank must maintain is computed as a percentage of the
daily average net transaction accounts held by the bank over the two week computation
period. Friday’s balances are carried over for Saturday and Sunday so Friday’s balance
counts for three days. Smart bankers can attempt to lower deposits on Friday by say, sending
them to overseas affiliates, and reversing them on Monday. This reduces the average daily
balance by the amount sent times 2/14 and is called the ‘weekend game.’
The first $12.4 million of net transaction accounts carry a 0% reserve requirement, amounts
from $12.4 million to $79.5 million carry a 3% reserve requirement and all amounts over
$79.5 million require a 10% reserve requirement. Suppose that a bank has average daily
gross transaction deposits of $1,650 million, including $150 million in its own deposits
elsewhere and in currency in the process of collection (CIPC) so that net transaction accounts
are $1,500 million. The minimum average reserves the bank must hold is:
Net Transaction Accounts % Reserve Req. Daily Avg. Required
The first $12.4 million @ 0% $ 0.00
$79.5 – $12.4 = $67.1 million @ 3% $ 2.01
Amount > $79.5 million = $1420.5 million @ 10% $142.05
Minimum required daily average balance $144.06 mill.
The reserve maintenance period is the 14 day period over which the bank must maintain a
daily average balance of reserves (reserves at the Fed and cash) equal to the calculated
amount or more. The reserve maintenance period begins 30 days after the beginning of the
reserve computation period. For this reason this system is called a lagged reserve
accounting system. The U.S. switched from a contemporaneous reserve accounting
system in 1998. Thus the bank manager knows exactly the value of the minimum reserve
target throughout the entire maintenance period. This allows managers to allow the reserves
held to fall below the required minimum on any given day. They can easily calculate the
required levels on the days remaining so that the average daily balance will still meet the
1 Very small institutions are exempt.
required daily average balance.
b. Regulations on Capital Adequacy (Leverage)
The FDICIA requires banks and thrifts to meet identical risk based capital requirements. FDICIA
requires regulators to mandate prompt corrective actions (PCA) if a bank falls below the well
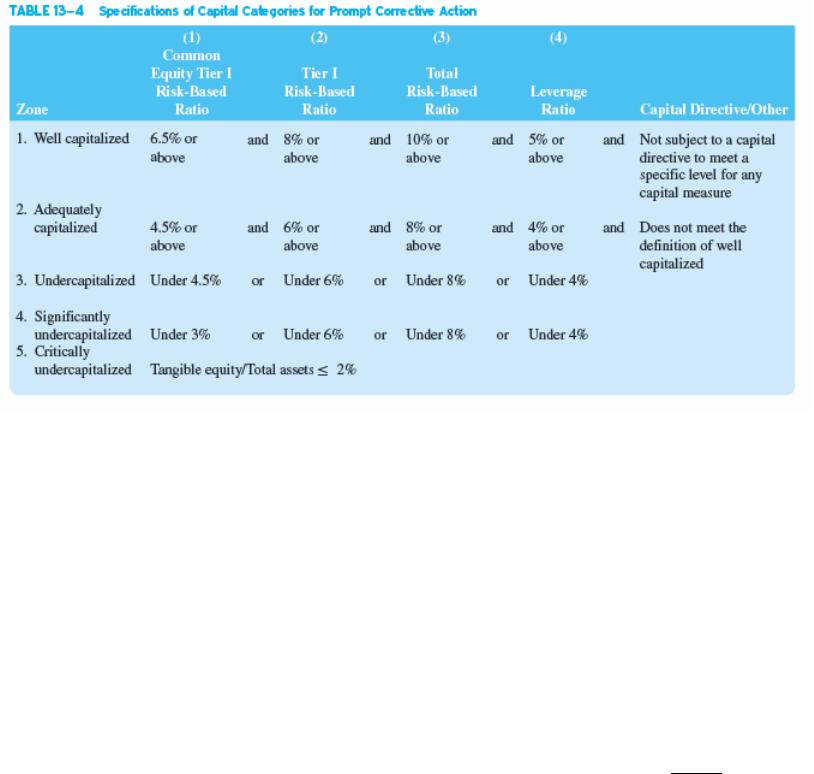
capitalized criteria. The list of categories is provided in Text Table 13-4 and the recommended
actions are provided in Text Table 13-5. Primary or ‘core’ capital consists of common equity,
called Common Equity Tier 1, or CET1, additional Tier 1 capital and Tier II capital. Detailed
definitions are provided in text Table 13-16. CET1 is basically common stock and retained
earnings less goodwill. Additional Tier I capital consists primarily of perpetual items although
they may be callable after 5 years if replaced with “better” capital and noncumulative perpetual
preferred stock. Tier II capital includes subordinated debt and other general bank creditors,
preferred stock, allowance for loan and lease losses (max 1.25% of risk weighted assets) and
some other exceptions that may be allowed by the regulators.
In February 2009 the Obama administration announced stress tests of the 19 largest U.S. banks
to see if bank capital was sufficient to handle a ‘worst case’ economic scenario of unemployment
remaining over 10% and home prices falling another 25%. The tests revealed that 10 of the 19
institutions needed to raise capital worth a total of $74.6 billion, which they promptly did. The
stress test results are presented in text Table 13-6.
Teaching Tip: The 1989 Basle Accord did three things:
1. Defined what banks could count as capital.
2. Increased the amount of capital a bank is required to hold by requiring stricter
minimum capital/asset ratios.
3. Made the required capital levels reflect the risk of the institution.
Many banks had to raise more equity capital. How could they do this?
Sell new shares
Reduce dividends
Reduce amount of risky assets
Increase profit margin on loans – e.g. credit cards and check fees. This is one reason why
credit card loan rates were so slow to fall in the 1990s as interest rates declined.
An interesting question to pose is to ask how much the Basle Accord affected the U.S. and global
economy in the 1990s. U.S. banks, under pressure to improve capital and under fire for loan
quality, were perhaps less likely to lend. This may have worsened the recession of 1990. Japan’s
banking woes were brought to light by the stricter capital standards required under the Basle
agreement. It is at least worth mentioning that care must be taken when changing regulations for
a country’s largest intermediary in order to prevent unintended consequences.
Teaching Tip:
With no risk adjustment, all banks had the same capital requirement, but not all
banks had the same risk. Because higher risk banks did not have to hold more capital, there was
no penalty for additional risk. Normally, capital markets would discipline banks to limit the
amount of financial leverage used by requiring higher borrowing rates. Two different conditions
in the banking industry created a market failure however: deposit insurance and the ‘Too Big
To Fail’ practices of the regulators.
Teaching Tip: There is a conflict between regulators and managers over capital levels.
Bank managers prefer low levels of capital to increase ROE, and bank regulators prefer higher
levels of capital to reduce insolvency risk. Historically, bank capital/asset ratios had been in the
5-8% range, at times dropping below 5%. In the early 1980s capital requirements were actually
reduced from 4% to 3% at thrifts! These high debt levels leave little room for error. The
regulators knew that the U.S. needed higher capital requirements and needed capital requirement
which accounted for different risk of banks. Nevertheless, the U.S. was reluctant to require them
unless other countries imposed similar requirements, otherwise U.S. banks would have faced a
higher cost of funds than foreign banks. Hence, the international capital agreement, the Basle
Accord was created. Signers include the U.S., Canada, France, Germany, Italy, Belgium, Japan,
Luxembourg, Netherlands, Sweden, Switzerland, and the United Kingdom.
Simply examining a capital to asset ratio is an insufficient measure of the adequacy of capital to
protect against losses for three reasons:
1. The capital to asset ratio (leverage ratio) is based on book values and the market value of
equity may be substantially negative,2 even though the institution has a positive leverage ratio.
This in fact happened at many S&Ls in the 1980s.
2. A simple leverage ratio fails to consider the different risk levels of different assets.
3. The leverage ratio fails to capture the risk of off-balance-sheet activities.
As a result of these failings, the Basel Accord developed risk based capital requirements.
Basel II updated the credit risk assessments and formally instituted three ‘pillars’ of capital
regulation. The crisis revealed problems with Basel II and Basel 2.5 was passed in 2009
(effective as of 2013). The purpose of 2.5 was to update capital required to back trading
operations. In September 2010, the Bank of International Settlements (BIS), an international
agency that promotes standard global banking rules, revised the capital requirements, resulting in
Basel III. The minimum leverage ratio was increased from 2% to 4.5% and a capital
conservation buffer of 2.5% which has to be met with common equity was introduced. This
buffer may be drawn down during tough economic times. This requirement is to be phased in
between 2016 and 2019. Thus the total common equity requirement will eventually be 7%. Tier
1 capital requirements were also increased from 4% to 6%. These requirements are phased in by
January 2015. Finally a countercyclical buffer requirement of 0 to 2.5% may be instituted on a
country by country basis as needed. See the table below. The more detailed phase in schedule is
provided in Text Table 13-3.
Text Table 13-4 Calibration of the Capital Framework (all numbers in percent)
Common Equity
(after deductions) Tier I Capital Total Capital
Minimum 4.5 6.0 8.0
Capital
Conservation buffer
2.5
Minimum plus
conservation buffer
7.0 8.5 10.5
2This implies that upon liquidation the deposit insurance agency will be unable to fully recover
payouts to depositors from sale of the assets.

Countercyclical
capital buffer
0.0-2.5
Basel III also requires a Common Equity Tier I surcharge on certain banks determined to be
globally systemically important banks (G-SIBs). A bank is labeled a G-SIB if its failure or
distress has the potential to disrupt the global financial system or economic activity. These banks
are considered too big to fail and would have to be bailed out if necessary. This surcharge is
between 1 and 3.5% over the 7.0% minimum CET1 ratio. There are 29 designated G-SIBs as of
this writing (27 were designated by the BIS and 2 by the bank’s local regulators). The list is in
text Table 13-7. The list is updated every three years and it is anticipated that eventually the list
will include non-banks.
Appendix 13E: Calculating Risk-Based Capital Ratios
Text Appendix 13E contains the details of calculating risk based capital ratios. We are now up to
Basel III, the third version of the international capital accord promulgated by the BIS.
Basle Accord I defined two types of capital: Tier 1 or ‘core’ capital and Tier 2 or ‘supplemental
capital.’
Tier 1 (Core) capital:”No Contractual Obligated Payments”
» Common Equity, including Retained Earnings (Must be 4% of Risk Weighted
Assets (RWA) (RWA is defined below)
Subject to regulatory approval:
» Qualifying cumulative and noncumulative perpetual preferred stock (and surplus)
{No more than 25% of the sum of the other Tier 1 elements}
The defining characteristic of Tier 1 capital is that the bank cannot be sued for nonpayment on
any of these accounts, and no principle payments are due on them.
Tier 2 or Supplemental Capital (major components)
Allowance for loan and lease losses Up to 1.25% of RWA
Perpetual preferred stock not counted in Tier 1.
Subordinated debt and finite lived preferred stock maturing no sooner than 5 years.
{Maximum amount that can be counted is 50% of Tier 1}
Limits: The amount of Tier 2 capital in excess of Tier 1 capital does not count as allowable
capital.
Total Capital (TC) or Allowable Capital = Tier 1 + Tier 2 (See the limit above)
RWA = Risk Weighted Assets or Risk Adjusted Assets
The recent minimum capital requirements per category are as follows in text Table 13-4:
Risk weighted assets under Basel III
The risk weighting scheme works as follows:
Assets are classified into risk categories and assigned a regulatory determined “weight.”
Low risk items receive a low weight.
The total amount of Risk Weighted Assets (RWA) is then the sum of (Amount Weight) for
each asset category.
Special conversion factors are applied to off-balance-sheet items such as letters of credit and
swaps.
Summary of the Risk Weights for On Balance Sheet Items (See also Text Table 13-17)
On balance sheet items:
Risk Weight Asset
Category 1
0% Cash
Securities backed by U.S. and OECD govt.and some U.S. govt. agencies
Reserves at Fed (central banks)
GNMA mortgage backed securities
Loans to sovereigns with an S&P rating of AA- or better
Category 2
20% CIPC
Mortgage backed non-govt. agency sponsored securities such as FNMA
and FHLMC backed securities
Most securities issued by govt. agencies
GO municipals
U.S. and OECD interbank deposits and guaranteed claims
Repos collateralized by U.S.G.S.
Loans to sovereigns with an S&P rating of A+ to A-
Loans to banks and corporates with an S&P rating of AA- or better
Category 3
35% Single or multi-family mortgages (fully secured, first liens)
Category 4 Revenue bonds, multifamily mortgages
50% Certain loans to sovereigns+
Certain loans to foreign banks+
Certain singly family mortgages*
Category 5
75% Certain single family mortgages
Category 6
100% Commercial and consumer loans
Certain loans to sovereigns, banks and securities firms
All other assets, including intangibles
Category 7
150% Loans and other exposures 90 days or more past due
Volatile commercial real estate loans
Certain single family mortgages
Category 8
200% Certain single family mortgages
Category 9
1250% Securitization exposures
+ The appendix contains the details on the ratings categories for these items.
* The different weights for single family mortgages vary with the loan to value ratio and whether
the mortgage represents a first lien. Details are available in the appendix.
Conversion factors for off-balance-sheet contingent or guaranty contracts (Text Table 13-19)
Sale and repurchase agreements and assets sold with recourse (& not on the balance sheet)
(100%)
Direct credit substitute (financial) standby letters of credit (100%)
Performance related standby letters of credit (50%)
Unused portion of loan commitments with original maturity of ≤ 1 year (20%)
Unused portion of loan commitments with original maturity of > 1 year (50%)
Commercial letters of credit (20%)
Bankers acceptances conveyed (20%)
Other loan commitments (10%)
The risk weights for these categories depend on the riskiness of the creditor under Basel III.
Teaching Tip: Each country can set different risk weights and different account types may be
classified differently within and between countries. For example, although long term Treasury
Bonds carry no default risk and are classified in the 0% risk weight category, regulators may
assign them a 20% risk weight because of their price volatility.
Finding the risk adjusted value of off-balance-sheet contingent guaranty contracts is a two step
process:
1. Multiply the amount outstanding times the appropriate conversion factor listed above. This
gives the credit equivalent amount as if the commitment were on the balance sheet.
2. Multiply the result in step 1 by the appropriate risk weight found in the on balance sheet risk
weight table. For instance, if a bank issues a standby letter of credit guarantee on a commercial
paper issue, the letter of credit commitment is first multiplied by 100% and then multiplied by
100% again. So that the risk weighted asset amount is equal to the original amount of the credit.
If the bank however issued a standby letter of credit to a municipal borrower to back G.O. bonds
the amount would be multiplied by 100% and then by 20% since G.O. bonds appear in the 20%
risk weight (on balance sheet) category.
Finding the risk adjusted asset value of off-balance-sheet OTC derivative instruments or market
contracts is more complex. The risk weighting for these contracts is due to counterparty credit
risk. Therefore exchange traded contracts, which do not bear counterparty risk are not included.
The notional value of all nonexchange traded swaps, forwards, OTC options and other such
exposures are first converted into on balance sheet credit equivalents as before, but this
conversion is a two step process that requires estimating the contract’s current and potential
exposure.
The credit equivalent amount is then separated into two components: current exposure and
potential exposure.
Current exposure is the cost to replace the contract today if the counterparty defaults
immediately.
Current exposure on a forward contract may be calculated by assuming that the
counterparty defaults today and the forward contract has to be replaced using the new
forward rate for the time remaining on the contract. If the bank had bought pounds
forward at $1.50 per pound, but now the forward rate is $1.60 per pound the replacement
cost is the discounted value of $0.10 per pound bought forward. Replacement cost can be
positive or negative, but if it is negative the bank must count it as zero under existing
regulations.
Current exposure on a swap can be calculated as the net present value of the existing
swap less the net present value of a replacement swap.
Potential exposure measures the expected cost to replace the contract in the future if the
counterparty defaults later on. Exchange rate contracts are more volatile than interest rate
contracts so their values can change more, and regulators require higher conversion factors
for them than for interest rate exposures. The value of longer term contracts is also more
volatile than short term contracts, and long term derivatives also carry higher conversion
factors.
Credit conversion factors for interest rate and foreign exchange contracts used in calculating
potential exposure (text Table 13-20)
Remaining Maturity Interest rate contracts Exchange rate contracts
Less than 1 year 0.0% 1.0%
1-5 years 0.5% 5.0%
> 5 years 1.5% 7.5%
The notional value times the appropriate factor from the above table yields the potential
exposure.
The sum of the potential exposure and the current exposure gives the total on balance sheet
equivalent credit amount. This sum is then multiplied by the appropriate risk weight which was
generally 50% under Basel I, but is 100% under Basel II and III. (See the following example,
its really not that difficult if you do not have to calculate the current exposure.)
Example calculation:
XYZ Bank (Millions)
Cash & Reserves $ 5 Deposits $113
Investments in Treasuries $ 10 10 year Sub. Debt $ 16
Commercial loans BB+ $ 12 Perpetual Noncum. PS $ 1
Single family mortgages $ 45 Common stock $ 2
Consumer loans $ 35 Retained Earnings $ 5
Commercial loans CCC+ $ 25 Total $137
Allowance for loan losses ($ 10 )
Physical assets $ 15
Total Assets $137
Note:
Off-Balance-Sheet: Banker’s Acceptances $20 million to entities with an A+ rating.
Three year fixed for floating interest rate swap with notional value of $75 million and a
replacement cost of $3 million.
Three year forward contract to sell euros for $10 million. The contract has a replacement
cost of $1 million.
XYZ Bank (Millions $)
Risk
Weight Capital
Cash & Reserves $ 5 0% Deposits $113 –
Investments in Treasuries $ 10 0% 10 year Sub. Debt $ 16 Tier 2
Commercial Loans $ 12 100% Perpetual Noncum. PS $ 1 Add. Tier 1
Single family mortgages* $ 45 50% Common stock $ 2 Tier 1
Consumer loans $ 35 100% Retained Earnings $ 5 Tier 1
Commercial RE (volatile) $ 25 150% Total $137
Allowance for loan losses ( $ 10) N/A
Physical assets $ 15 100%
Total Assets $137
* assumed 50% weight
The on balance sheet risk weighted asset total is calculated as the sum of the amount of each

asset times the risk weight. Total on balance sheet risk weighted assets are thus $122 million.
The reserve for loan losses is ignored in this calculation.
The risk weighted equivalent asset amounts for the off-balance-sheet items are calculated as
follows:
Off-Balance-Sheet: Banker’s Acceptance $20 million to entities with an A+ rating.
Banker’s acceptances carry a 20% conversion factor so the credit equivalent amount is
$20 million 0.20 = $4 million. The counterparty is rated A+ so the risk weight is 50% and the
risk weighted equivalent asset amount is $2 million.
Three year fixed for floating interest rate swap with notional value of $75 million and a
replacement cost of $3 million.
Potential exposure:
The potential exposure is calculated as $75 million times the conversion factor of 0.5% that
applies to interest rate contracts with a maturity of 1 to 5 years:
$75 million 0.005 = $375,000
Current exposure:
The current exposure is the replacement cost of $3 million.
The total credit equivalent amount = current exposure + potential exposure = $3,375,000
Under Basel III, the risk weight is 100% so the equivalent on balance sheet risk weighted amount
is equal to $3,375,000 1.00 = $3,375,000.
Three year forward contract to sell euros for $10 million. The contract has a replacement
cost of $1 million.
Potential exposure:
The potential exposure is calculated as $10 million times the conversion factor of 5% which
applies to exchange rate contracts with a maturity of 1 to 5 years:
$10 million 0.05 = $500,000
Current exposure:
The current exposure is the replacement cost of $1 million.
The total credit equivalent amount = current exposure + potential exposure = $1,500,000
Under Basel II, the risk weight is 100% so the equivalent on balance sheet risk weighted amount
is equal to $1,500,000 1.00 = $1,500,000.
Total Risk Weighted Assets (RWA)
On Balance Sheet RWA $122,000,000
Banker’s Acceptances $ 2,000,000
Swap $ 3,375,000
Forward $ 1,500,000
Total RWA $128,875,000
CET1 Capital = $7,000,000
Additional Tier I = $1,000,000
Total Tier I = $8,000,000
Tier 2 Capital = $5,610,937 million = $4 million + $1,610,937
Tier 2 Capital is calculated as follows: Only $4 million in 10 year subordinated debt can
be counted as Tier 2 capital because this category is limited to no more than 50% of Tier
1 Capital. Only part of the $10 million loan loss reserve can be counted; recall that a
maximum amount of loan loss reserves that can be counted as capital is 1.25% of risk
weighted assets, or $1,610,937 = $128,875,000 * 0.0125 in this case.
Total Capital or Allowable capital = Tier 1 + Tier 2 = $13,610,937
Common equity Tier I risk-based capital ratio = CET1/RWA = $7,000,000/$128,875,000 =
5.43%
Total Capital/ RWA $13,610,937 / $128,875,000 = 10.56%
Tier 1 Capital / RWA $8,000,000 / $128,875,000 = 6.21%
Leverage ratio = Total Capital / (Total Assets + Off Balance Sheet Exposure) = $13,610,937 /
$137,000,000 +$3,375,000+$1,500,000) = 9.59%
This bank is adequately capitalized rather than well capitalized because the CET1 risk based
ratio is less than 6.5%. See text Table 13-4.
End of Appendix 13E
In 2014 the leverage ratio for all FDIC insured institutions was 9.54% and continued to
trend upward. The Tier I risk based capital ratio was 13.34%, the total risk-based capital ratio
was 15.07%. In the first quarter of 2014 total current exposure to Tier I capital from derivatives
was 23.5%, potential exposure to Tier I capital was 56.7% for a total exposure ratio of 80.3%.
These exposures have been declining over time.
(Source FDIC Quarterly Banking Profile 1st Qtr, 2014)
c. Off-Balance-Sheet Regulations
In the 1980s banks began increasing off-balance-sheet (OBS) activity to offset declining profit
margins on traditional bank operations and to escape scrutiny, capital and other requirements
imposed on balance sheet activities. Since 1983 banks have had to report OBS activity on
Schedule L of their call reports.