
Chapter 11 – Commercial Banks: Industry Overview 6th Edition
1. Size, Structure, and Composition of the Industry
As of March 2014 there were 5,809 insured commercial banks. This number continues to
decline.
Teaching Tip: The decline is somewhat misleading because the number of bank offices
including branches grew from 60,000 in 1984 to 83,593 in 2012. Industry consolidation
has been occurring rapidly, largely via unassisted mergers, but total bank assets and the
total number of banking facilities have grown at significant rates. Banking remains a
growth industry but it is likely that technology will reduce the need for a physical bank
presence over time and we may have seen a peak in the number of offices and branches.
The number of both declined slightly in 2013 (Source, FDIC).
In 2006 Wal-Mart and Target applied for Industrial Loan Corporation (ILC) charters to
provide certain banking services. ILCs are chartered in Utah and are not directly
regulated by any banking regulator. ILCs may make commercial loans, and typically
lend to higher risk corporate borrowers. Wal-Mart’s stated rationale was to lower the cost
of processing electronic payments and Target hoped to issue business credit cards. There
were many vocal opponents of these applications and the FDIC established a moratorium
on all ILC applications while Congress considers banning them. Allowing ILCs of this
type further blurs the separation between commercial enterprises and banking and could
potentially increase the risk of the banking system significantly. Wal-Mart withdrew its
application in 2007.
a. Bank Size and Concentration
The largest banks increasingly dominate the industry (see text or below) and the largest
banks control the vast majority of industry assets. This is now true in all aspects of the
financial services industries. Banks are often classified as:
Money center banks which include the largest banks, typically located in New York
city. Size alone however does not make a money center bank. These banks generally
rely on nondeposit sources of funds and are heavily engaged in wholesale banking
(with or without a retail banking presence) and involved in international markets.
Wholesale banking refers to providing loans services to corporations and other
institutions as well as acquiring nondeposit sources of funds. Retail banking is
providing consumer oriented banking services such as loans and deposits. U.S. based
money center banks include Bank of New York Mellon, Citigroup, J.P. Morgan
Chase, HSBC Bank North America and Deutsche Bank (via acquisition of Banker’s
Trust).
Superregional or regional banks that operate primarily in one or more regions of
the country
Vommunity banks that operate in local markets
Summary of Text Figure 11-6
Size & Type
2013
% of total #
banks
% of total
banks assets
Community banks 91.1% 8.8%
$1-10 billion 7.4% 8.6%
≥ $10 billion 1.5% 82.6%
11-1

Chapter 11 – Commercial Banks: Industry Overview 6th Edition
100.0% 100.0%
Notice the heavy concentration of assets among the largest banks. Nevertheless,
thousands of small banks remain throughout the country, although more and more of
these small institutions are being absorbed by mergers. Absorptions are running higher
than new charters so the trend toward increasing concentration will continue.
b. Bank Size and Activities
Large banks generally are less liquid, are more heavily concentrated in loans and use
more purchased sources of funds. They have greater access to brokered deposits and
non-deposit liabilities and they tend to hold less equity.
Large banks lend to more sophisticated corporate customers which means that their profit
margins are often lower than for smaller banks that operate in more isolated, less
competitive circumstances. A key ratio for bank management includes the net interest
margin which is equal to the interest rate spread divided by earning assets. The interest
rate spread is the interest earned on assets minus the interest paid on liabilities.
Large banks typically pay higher salaries than smaller banks and have greater
investments in facilities and in the provision of services. On the other hand large banks
generate substantially more fee income than small banks.
Teaching Tip: At times small banks have been more profitable than large banks, but this
has not always been the case. The higher profitability at smaller banks is often due to a
lack of local competition. As large banks gain the ability to enter local markets it is
questionable whether the smaller banks’ profitability can be maintained.
2. Industry Performance
Banks enjoyed excellent profitability during most of the 1990s, weaker performance in
the early 2000s, but record high performance in 2003 and on into 2004.1 In 2004 banks
had an average ROA of 1.31% and a ROE of 14.01%, both figures were good. Bank
ROA’s vary from 0.5% to 2% typically. Bank profitability had been high because of
higher noninterest income and lower loan loss provisions. Consumer loan demand and
demand for mortgage credit remained high in this time period as well. Banks also
benefited from a long period of low interest rates and good economic growth with low
inflation which encouraged borrowing. Credit card rates in particular did not fall as
quickly as bank costs, improving bank margins. Better information technology helped
reduce costs and the growth of credit derivatives and mortgage securitization helped
banks to continue high lending volume while shifting risks to other entities. The yield on
earning assets in 2004 was 5.18% and the cost of funding earning assets was 1.56%,
giving a net interest margin of 3.62%which is quite good.2
1U.S. banks had less exposure to the late 1990s Russian and Asian crises than banks of
other countries, presumably having learned their lesson from the LDC debt fiascoes of
the 1970s and 1980s, or more likely because of aggressive lending by Japanese banks.
2 Source FDIC Quarterly Banking Profile, Third Quarter 2004.
11-2
Chapter 11 – Commercial Banks: Industry Overview 6th Edition
As interest rates rose in 2005 and 2006 bank profitability remained strong although
increasing loan loss provisions and weaker trading revenue and servicing income kept
2006 profitability from reaching record highs. However the flattening yield curve,
competitive pricing and increases in fund costs contributed to falling profit rates at banks.
In late 2006 and in 2007 problems in mortgages also began to hurt banks. Foreclosure
filings jumped 93% in July 2007 from July 2006. In the fourth quarter of 2007 loan loss
provisions reached $31.3 billion, their highest level at the time since 1991. This was a
300% increase from the fourth quarter in the prior year although seven large institutions
accounted for over half the increase in loss provisions. Trading losses were $10.6 billion;
the first ever quarterly net trading loss. Ten large institutions accounted for the entire
decline in trading earnings. Net interest income rose 11.8% from the prior year’s same
quarter. In all, net income for the fourth quarter of 2007 was the lowest reported since
the same quarter in 1991. Earnings problems were widespread with 51% of all
institutions reporting lower net income, but the depth of the decline was driven by a few
large institutions. ROA for the quarter was only 0.18%, down from 1.20% in the 4th
quarter of the prior year. This was the lowest ROA since 1990 and ROE was only a
dismal 1.74%.3
In 2008 ROA was a dismal 0.13%, it fell again in 2009 to 0.09% before rising to 0.60%
in 2010. Similarly ROE was 1.33% in 2008, 0.85% in 2009 and 5.44% in 2010. The
problem was not in interest spreads as the net interest margin remained high throughout
the period (3.87% in 2010). Problems remained in credit losses. Less than half reporting
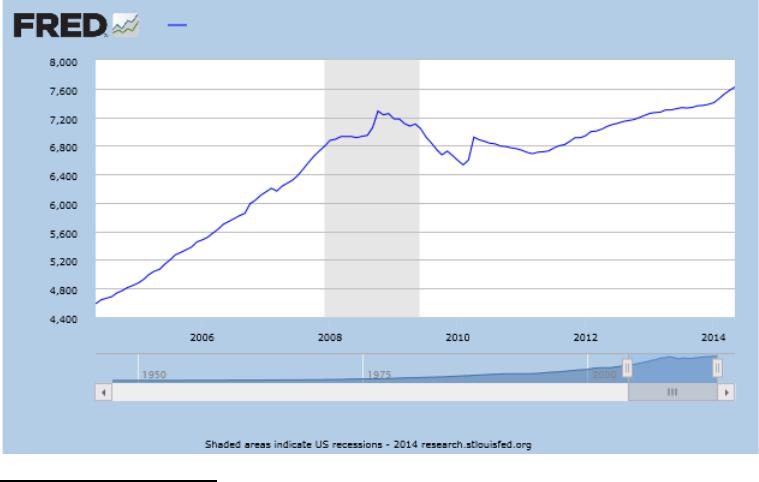
institutions saw earnings increases in 2007. Banks began reducing lending in late 2008
(see graph below). This has hurt the ability of small firms to grow and generate jobs.
Larger firms have been able to access bond financing and have not had the same funding
problems as smaller firms.
3 Data and analysis not in the text are from the FDIC Quarterly Banking Profile, Fourth
Quarter 2007.
11-3

Chapter 11 – Commercial Banks: Industry Overview 6th Edition
(Source: Federal Reserve Bank of St. Louis FRED data)
The provision for loan losses is a charge to earnings based on management’s expectation
of how many loans will go bad in the current quarter. Net charge offs (NCOs) are actual
write offs. Net charges offs reached five year highs in 2007, at $16.2 2 billion as
compared to $8.5 billion in the fourth quarter of 2006. This yielded an annualized net
charge off rate of 0.83%.4 NCOs continued to climb in 2008 and 2009 before beginning
to drop in 2010.
NCO rates Year 2013 all FDIC insured
commercial banks (% of loans)
Overall 0.70%
Real Estate 0.50%
C&I 0.30%
Consumer 2.16%
Credit Card 3.43%
Source FDIC Net Charge-Offs to Loans Statistics on DIs Report
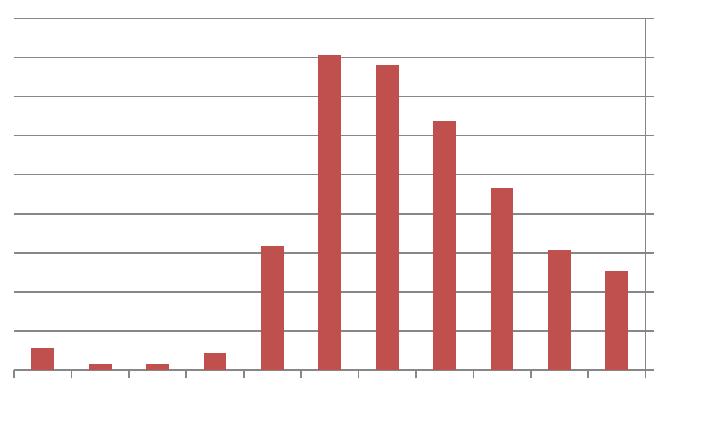
NCO rates are all improving. The overall state of the banking industry is also improving.
The number and assets of problem institutions are falling as indicated in the graphs below
after peaking in the 2009-2010 period:
4 Ibid
11-4

Chapter 11 – Commercial Banks: Industry Overview 6th Edition
2014 YTD
2013
2012
2011
2010
2009
2008
2007
2006
2005
2004
0
100
200
300
400
500
600
700
800
900
1000
Data Source: FDIC, Historical Statistics, Statistics at a Glance
11-5
Chapter 11 – Commercial Banks: Industry Overview 6th Edition
2014 YTD
2013
2012
2011
2010
2009
2008
2007
2006
2005
2004
0
50
100
150
200
250
300
350
400
450
Data Source: FDIC, Historical Statistics, Statistics at a Glance
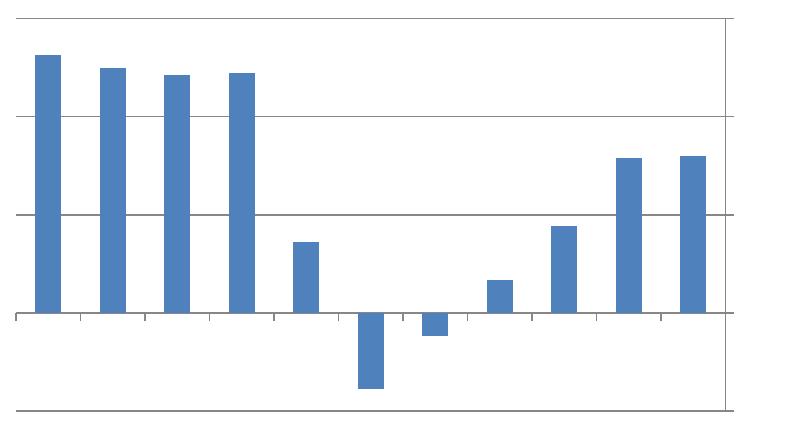
As a result of the reduced amount of failures the FDIC’s deposit insurance fund coverage
ratio has improved since its nadir in 2010 as depicted below:
11-6
Chapter 11 – Commercial Banks: Industry Overview 6th Edition
2014 YTD2013201220112010200920082007200620052004
-0.50
0.00
0.50
1.00
1.50
Data Source: FDIC, Historical Statistics, Statistics at a Glance
The long run of low interest rates has allowed banks to book good profits unrelated to
credit losses. For the year 2013 interest income fell by 3.10% but interest expense fell by
18.49% so that net interest income fell only slightly over the year by 0.83%. The
provision for loan loss fell by a large margin from $52.34 billion to $28.33 billion or
about a 46% drop. Trading account gains and fees rose by 24.6% over the year although
securities gains fell by 54%. Overall net income attributable to the bank rose by about
10% from $130.1 billion to $143.1 billion. Fifty-five percent of institutions had earnings
increases, and only about 7% were unprofitable for the year versus over 10% in 2012.
The yield on earning assets was 3.65% and the net interest margin was 3.25%. Return on
assets was 1.06% for the year and return on equity was 9.57%, both were improvements
from 2012 figures of 1.00% and 8.91% respectively. Net loans and leases to deposits
11-7
Chapter 11 – Commercial Banks: Industry Overview 6th Edition
remained steady in 2013 at 68.5% of deposits and the equity to asset ratio was largely
unchanged in 2013 at 11.11% from its value in 2012 at 11.10%.
3. Regulators
a. Federal Deposit Insurance Corporation
The FDIC, created in 1933, manages the deposit insurance funds for the thrift and
banking industries. The FDIC examines banks and disposes of failed bank and savings
association assets.
b. Office of the Comptroller of the Currency
The OCC has been around since the Civil War. The OCC grants national charters,
although banks may be state chartered instead. The OCC examines national banks and
approves or disapproves their merger applications.
Teaching Tip: Prior to 1863 the U.S. had only state chartered banks. In an attempt to help
finance the Civil War, the National Banking Acts of 1863 and 1864 created nationally
chartered banks that the federal government could more tightly regulate. The laws
required nationally chartered banks to hold U.S. government bonds to collateralize their
bank notes. This allowed the government to finance the rest of the war. The acts did not
outlaw state banking and as a result we have a dual banking system today.
About twenty-three percent of federally insured banks are nationally chartered banks; the
remainder is state chartered. Nationally chartered banks must be members of the Fed and
must be FDIC insured. State chartered banks have a choice on both. State chartered
banks may have fewer regulations imposed upon them and state chartered banks cannot
use the word ‘national’ in their name.
c. Federal Reserve System
About 31% of federally insured banks are members of the Federal Reserve and 69% are
not (Text Figure 11-8). Fed membership allows banks direct access to the FedWire
system. The Fed regulates bank holding company activities.
d. State Authorities
State chartered banks are regulated by state banking authorities. Federally insured state
chartered banks pass into receivership of the FDIC if they fail.
4. Global Issues
Total international asset positions of banks that report data to the Bank of International
Settlements (BIS) were $32.9 trillion at year end 2013. Of the top 20 global banks in the
world ranked by asset size, only 2 are U.S. banks (Citigroup and Bank of America).
Teaching Tip: This result is an artifact of U.S. bank regulations that have promoted small
community banks. If one looked at lists of the most profitable and sophisticated banks,
one would find more U.S. banks on that list.
The advantages of globalizing operations include:
11-8
Chapter 11 – Commercial Banks: Industry Overview 6th Edition
Additional risk diversification by including operations in other economies
Economies of scale and scope
U.S. banks have been global industry leaders in generating innovative new
products such as OTC derivatives not developed by overseas banks
Expanded funds sources
Maintenance of customer relationships as many corporate customers have gone
global and have needed banking services for their overseas operations
Avoidance of domestic regulations – The U.S. tends to be the most tightly
regulated market and engaging in overseas operations allows U.S. banks to
operate with less scrutiny
Disadvantages of globalization of banking services include:
Greater information production and monitoring costs involved in evaluating overseas
loans and investments. The U.S. generally has higher disclosure requirements than
most other countries.
Overseas operations may face expropriation or repatriation problems.
The fixed costs to enter foreign markets may be quite high and may not be easily
recovered once an investment is made.
Global Banking Performance
Overall European bank performance remained strong throughout the mid 2000s; however
the same structural forces affecting U.S. banks such as the flattening yield curve and
competitive pressures on NIMs eventually slowed profit growth. Mortgage demand
remained high through much of the period and boosted growth in Spain and France and
generally good growth in the euro area helped.
However foreign banks were not immune to the financial crisis of 2007 and 2008. In
Europe bank net income declined precipitously in 2008. Large banks in the UK, Ireland,
the Netherlands, Switzerland, Iceland and Spain recorded annual losses during the crisis.
In October 2008 the German government guaranteed all consumer bank deposits and
arranged a bailout of Hypo Real Estate, the country’s second largest commercial property
lender. The Netherlands, Belgium and Luxembourg put together a $16.37 billion bailout
of Fortis NV. Many European and Asian countries quickly passes stimulus packages to
offset the problems in the U.S. and their own economies.
The Greek economic crisis severely impacted many European banks and illustrates how
interconnected economies are today and demonstrates the risk of contagion. Problems in
Greece eventually led to banking crises in Spain, Portugal and Italy. Even the French
bank Credit Agricole announced record losses of over $4 billion (equivalent) on write
downs of Greek loans. Globally, the total banking exposure to the four imperiled
countries was over $2.5 trillion. At one point many questioned whether the common
currency could be maintained in light of the region’s problems. After meeting and
stalling for a long period Europe’s finance ministers and the IMF came up with a bailout
of $147 billion and a promise of funding up to $1 trillion to ensure stability. The price
tag was fiscal ‘austerity’ in Greece which as very unpopular and led to strikes and
protests and a change in government. Eventually however the reforms did bring about
11-9

Chapter 11 – Commercial Banks: Industry Overview 6th Edition
improvements in Greek credit and S&P raised the debt rating from ‘selective default’ to
B-.
Aggregate problems in banking are related to macroeconomic problems. As bank credit
growth fell or actually declined firms had to curtail spending plans which then led to
slower economic growth. Bank balance sheets fell throughout the latter part of the crisis
and have yet to fully recover. Growth in Europe remains anemic, and the threat of
deflation has encouraged more aggressive actions by the European Central Bank. The
ECB has reduced its target interest rate and now charges a negative deposit rate on
reserves to encourage bank lending.
Teaching Tip:
Europe is trying to defy economic laws, which is difficult to do in the long run. The euro
is not an ‘optimal currency area’ because of the lack of fiscal and bank integration.
Unless Europe can more fully integrate, expect a continuing need for fiscal transfers to
weaker economies and/or continued crises.
1.1.1.1
1.1.1.2 VI. Web Links
http://www.federalreserve.gov/ Website of the Board of Governors of the Federal
Reserve
http://www.mybank.com/ This comprehensive listing will help you locate
banks on the World Wide Web.
http://www.occ.treas.gov/ Office of the Comptroller of the Currency
http://www.americanbanker.com The publication of the banker’s trade association
http://www.wsj.com/ Website of the Wall Street Journal Interactive
edition. The web version of the well known
financial newspaper can be personalized to meet
your own needs. Instructors can also receive via
e-mail current events cases keyed to financial
market news complete with discussion questions.
http://www.fdic.gov/ The Federal Deposit Insurance Corporation’s
website: new regulations and current and historical
banking statistics are available on this site.
1.1.1.2.1.1 VII. Student Learning Activities
1. Go to Value Line Investment Surveys, Standard and Poors or some other investment
service and obtain a current industry analysis for the bank industry. Is performance
projected to improve over the data given in the text or is performance slipping?
11-10
Chapter 11 – Commercial Banks: Industry Overview 6th Edition
Identify the major causes of any differences.
2. How has the Dodd-Frank bill impacted profitability at U.S. banks? Are the impacts
the same for different size banks? Explain. Both the Wall Street Journal and the
Economist are good starting points for your research.
11-11