Unlock document.
This document is partially blurred.
Unlock all pages and 1 million more documents.
Get Access

Chapter-by-chapter aids: Chapter 7
CHAPTER 7: IMPROVING DECISIONS WITH MARKETING
INFORMATION
CHAPTER 7 – COMMENTS ON QUESTIONS AND PROBLEMS
7- 1. This question relates to the text discussion in the section, “Effective Marketing Requires Good
Information.” Basically, a marketing information system is an organized way of continually
gathering and analyzing data to provide marketing managers with information they need to
make decisions. It is important for marketing managers to be involved in planning the system
planning or how the gathered information is to be used.. Note: many of the early efforts to
develop marketing information systems were not successful because marketing managers
were not involved in planning the systems. Now that managers know more about the
changing) their system. Because the consultants often have experience with marketing
practices in a number of firms and industries, they often bridge the communications gap
between a firm’s marketing people and the IT specialists.
to get and use information as he is making decisions. It allows the manager to "interact" with
the information. Students will provide a variety of possible examples here. The emphasis
should be on applications where it is useful to "see" some data – and then probe deeper. For
Some firms develop decision support tools that are based on general-purpose business
software packages like Microsoft Excel or Microsoft Access. An Excel spreadsheet with well-
designed “macros” to automate a set of analyses can be very powerful. Often, however,
money to upgrade information systems and decision support tools that budgets for traditional
marketing research are being reduced. Both types of information play a role, so managers
must find the right balance in how they spend money for information to improve marketing
MIS with the results that might be developed, for example, by doing a marketing survey. In that
case, the emphasis is on the extent to which the MIS focuses on recurring information needs,
whereas "special" marketing research projects often focus on "one-shot" marketing information
they can be used in combination with other information the firm may have gathered or
analyzed. As computer capabilities continue to expand and as data processing becomes
easier and more convenient, we will see growing usage of MIS.
of efforts to search for competitive information. Even so, depending on the size and
significance of a competing firm, there may be enormous amounts of information that need to

Part IV
IV-7-2 Perreault, Cannon, & McCarthy
be digested and analyzed before the competitor’s marketing strategy makes sense. A small
software firm that thinks it is going to keep up with all of the information about Microsoft, for
example, is likely to have a rude surprise. Further, much of the competitive information that is
available will be old, not very useful, or just plain wrong. There is little basis on which to check
those made by someone who does not have any clue what competitors are doing. As the old
saying goes, “in the land of the blind, the one-eyed man is king.”
testing ideas before accepting them. This is important to marketing managers because it helps
them to see when more detailed information will really be useful – and when more information
section, “Five Step Approach to Marketing Research” for additional detail.
Otherwise, there may be duplication of effort and inefficient use of resources. For example,
asking important customers about problems that could easily be answered within the company
7- 7. Secondary data is information that has already been collected or published. Primary data is
information that is specifically collected to solve a current problem. For example, data
published by the Census Bureau is secondary data for the marketing manager. A survey of
7- 8. There may be a great deal of secondary data that is useful, but often it is not as specific as the
marketing manager would like, especially when it comes to customer reactions to the firm’s
marketing mix decisions, present and future. This is especially the case when a product idea is
7- 9. The Statistical Abstract (or the Census Bureau website) would be a good place to start,
another source (mentioned in the Appendix) is Sales and Marketing Management's "Annual
Survey of Buying Power.” The Abstract would provide basic references to various types of
7-10. As in Question 7-9, the Abstract would probably be the best first source. This would provide
references to reports published by the U.S. Department of the Interior (www.doi.gov).
have found to the class – be careful this doesn't go on too long! (Note: If your students seem to
need more experience in working with secondary data, you might want to assign the Learning
7-12. The main advantage of the focus group interview approach is that it would stimulate the
respondents to interact. What one person says might prompt another person to elaborate on
the idea and/or share his own view. Focus groups tend to be less structured than most
Copyright © 2015 McGraw-Hill Education. All rights reserved. No reproduction or distribution without the prior written consent of McGraw-Hill Education.

Chapter-by-chapter aids: Chapter 7
Part IV
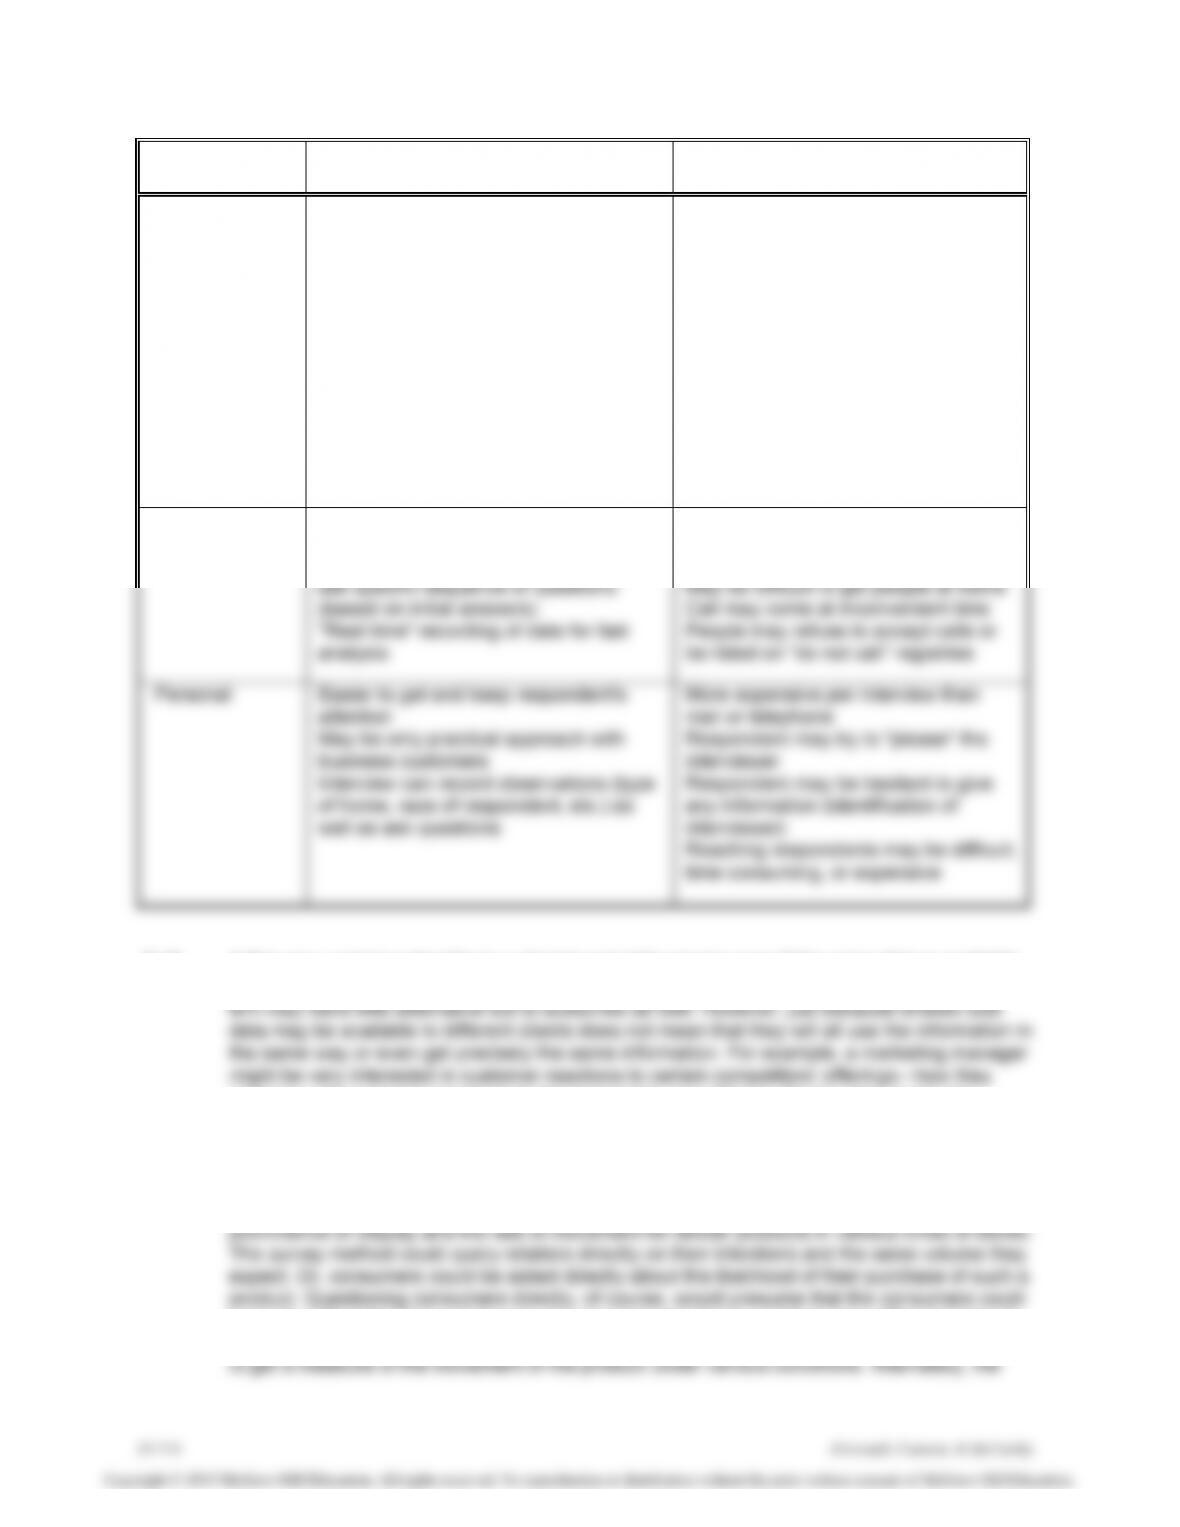
Type Survey
Advantages
Limitations
Mail and E-mail
Facilitates extensive questioning
Completed at respondent's convenience
May be able to ask personal questions
(can be returned anonymously)
Economical per contact
Easy and convenient
Questions may not be answered
completely
Directions/questions must be simple to
understand and follow
Questionnaires may not be returned
(non-response problems)
Delays in getting replies
Difficult to get open-ended replies
Literacy limitations
Email users may be different from
other consumers on relevant issues
Consumer/company concerns about
email spam (and possible virus
threats)
Phone
Fast and less expensive than personal
Allows probes
Can use computer-aided interviewing to
ask specific sequence of questions
(based on initial answers)
"Real time" recording of data for fast
analysis
Response not anonymous
Respondent not absolutely certain who
is calling
May be difficult to get people at home
Call may come at inconvenient time
People may refuse to accept calls or
be listed on “do not call” registries
Personal
Easier to get and keep respondent's
attention
May be only practical approach with
business customers
Interview can record observations (type
of home, race of respondent, etc.) as
well as ask questions
More expensive per interview than
mail or telephone
Respondent may try to "please" the
interviewer
Respondent may be hesitant to give
any information (identification of
interviewer)
Reaching respondents may be difficult,
time consuming, or expensive
7-16. A firm may want to subscribe to a shared cost data service even if the same data is available
to competitors. In fact, if competitors will definitely get some type of useful information, then the
firm may have little alternative but to subscribe as well. However, just because shared cost
data may be available to different clients does not mean that they will all use the information in
manager might pay little attention to data about a competitor who doesn't appear to be a
significant threat.
7-17. The free variable here is Promotion. How much can be expected from retailers and how much
ought to be sought? To find out, researchers could be sent to various stores to observe the
prominence of display and the rate of movement for similar products in various kinds of stores.
The survey method could query retailers directly on their intentions and the sales volume they
displays in different types of stores – perhaps matching them against similar "control" stores –
to get a measure of the movement of the product under various conditions. Alternately, the

Chapter-by-chapter aids: Chapter 7
Instructor’s Manual to Accompany Essentials of Marketing IV-7-5
product might be distributed in a test area and a careful observation made of the kind of
display and extent of distribution obtained when varying amounts of sales effort are applied.
relevance to the current situation. Research, then, updates his knowledge of the market and
enables him to use his experience most effectively.
7-19. This is a broad question; it prompts some very useful thinking and discussion about how one
gets started searching for information about a new market opportunity, including one that
involves a foreign country. This question also serves as a set up for the material that is
discussed in detail in the next chapter. Students will be more receptive to thinking about
Since the manager is interested in doing some initial screening of alternative markets, she will
certainly need to consider what consumer/market characteristics are most relevant. For
example, if the products are targeted at consumers with a certain level of discretionary income,
more insight about the types of data that are available for segmenting international markets.
7-20. See sections “Defining the Problem—Step 1” and “Solving the Problem—Step 5.”
DISCUSSION OF COMPUTER-AIDED PROBLEM 7: MARKETING RESEARCH
In this problem, a company has done a survey to help determine the size of a market for a new industrial
product it is developing. The manager wants to see how profitable the market might be – based on
responses from a sample. The problem focuses attention on issues of interpreting marketing research
data, especially the importance of understanding that estimates based on a sample may not be precise.
Students evaluate the sensitivity of their conclusions to small – but important – variations in estimates
from the sample respondents.
This problem gives students a (simplified) example of how a firm might use the results of a survey to
evaluate a potential market opportunity for a new product. This is quite helpful because students often
don't see how responses from sample surveys get converted to profitability information. At the same time,
the questions a and b alert students to the problems of treating survey responses – and calculations
based on them – as if they were "exact.” In this problem, the firm's expected sales volume and profitability
vary substantially with relatively small variations in estimates from the sample. This solidifies the ideas
related to confidence intervals, validity of response to questions, the representativeness of the sample,
and other important marketing research topics. In addition, the ideas introduced in this problem serve as
a prelude to some of the behavioral concepts (especially buying intentions) discussed in the next chapter.
This problem could also be used effectively to illustrate evaluation of new product opportunities – a topic
discussed in detail in Chapter 9 of the text. Similarly, it can be used with Appendix B, which covers issues
related to forecasting the likely size of a market.

Part IV
IV-7-6 Perreault, Cannon, & McCarthy
The initial spreadsheet for the problem appears below:
P L U S - Spreadheet
Sample
Estimate for
Total Market
Number of Firms
500
5000
*
Sample Firms as Percent of Market
10.00
Ratio of Total Market to Sample
10.00
ESTIMATES BASED ON SURVEY RESPONSES
Number of Old Machines
220
*
2200
Percent Who Want to Replace Old Machines
40.00
*
40.00
PROJECTIONS BASED ON DATA ABOVE
Expected Quantity of Replacements
88
880
Price per Replacement Machine
10000.00
*
Cost to Produce One Machine
6000.00
*
Total Expected Revenue
8800000.00
Total Production Cost
5280000.00
Contribution to Profit & Other Expenses
3520000.00
Answers to Computer-Aided Problem 7:
a. If the total market actually consists of 5,200 firms – not Texmac's "guesstimate" of 5,000 firms, the
estimate of expected replacement machines increases from 880 units to 915 units – and that
increase results in an increase in expected profits from $3,520,000 to $3,660,000. When students
see that this "minor" error of judgment makes a "bottom line" difference of $140,000, they develop a
better understanding of why it is important for marketing managers to have accurate information. The
spreadsheet for this analysis appears below:
P L U S - Spreadsheet
Sample
Estimate for
Total Market
Number of Firms
500
5200
*
Sample Firms as Percent of Market
9.62
Ratio of Total Market to Sample
10.40
ESTIMATES BASED ON SURVEY RESPONSES
Number of Old Machines
220
*
2288
Percent Who Want to Replace Old Machines
40.00
*
40.00
PROJECTIONS BASED ON DATA ABOVE
Expected Quantity of Replacements
88
915
Price per Replacement Machine
10000.00
*
Cost to Produce One Machine
6000.00
*
Total Expected Revenue
9150000.00
Total Production Cost
5490000.00
Contribution to Profit & Other Expenses
3660000.00
b. If the total market is actually 5,200 machines and the number of old machines per 500 is really 200
(not 220 as estimated from the sample), the estimate of profits is $3,328,000 – a decrease in
expected profit of $332,000 from the $3,660,000 profit expected with 220 machines per 500 firms.
Copyright © 2015 McGraw-Hill Education. All rights reserved. No reproduction or distribution without the prior written consent of McGraw-Hill Education.

Chapter-by-chapter aids: Chapter 7
Instructor’s Manual to Accompany Essentials of Marketing IV-7-7
Note: some students will leave the number of firms in the total market at 5,000. That is fine. The
same basic point will be made. In that case, the change from 220 machines per 500 to 200 machines
per 500 results in a decrease in expected profits from $3,520,000 to $3,200,000.
This question provides a good opportunity to discuss the importance of knowing about the population
when drawing a sample. In this case, being off by only 10 percent in the estimated size of the total
population of concern makes a significant difference in expected profits.
The spreadsheet for this analysis (based on 5,200 firms) appears below:
P L U S - Spreadsheet
Sample
Estimate for
Total Market
Number of Firms
500
5200
*
Sample Firms as Percent of Market
9.62
Ratio of Total Market to Sample
10.40
ESTIMATES BASED ON SURVEY RESPONSES
Number of Old Machines
200
*
2080
Percent Who Want to Replace Old Machines
40.00
*
40.00
PROJECTIONS BASED ON DATA ABOVE
Expected Quantity of Replacements
80
832
Price per Replacement Machine
10000.00
*
Cost to Produce One Machine
6000.00
*
Total Expected Revenue
8320000.00
Total Production Cost
4992000.00
Contribution to Profit & Other Expenses
3328000.00
c. The results of the What If analysis for this problem appear in the table below. Note the large changes
in the quantity estimate and the estimated profitability – depending on the relatively minor change in
the estimate developed from the responses in the sample.
This question provides a good opportunity to discuss the quality of data one can get from marketing
research.Precise data is valuable! The spreadsheet shows what a difference it makes.
P L U S - What If Data Display
-Sample-
-Estimate for-
Total Market-
-Estimate for-
Total Market-
% Replace
Replacements
Contribution
36.00
824
3296000.00
36.80
842
3368000.00
37.60
860
3440000.00
38.40
879
3516000.00
39.20
897
3588000.00
40.00
915
3660000.00
40.80
934
3736000.00
41.60
952
3808000.00
42.40
970
3880000.00
43.20
988
3952000.00
44.00
1007
4028000.00

Part IV
CHAPTER 7 – COMMENTS ON USE OF SUGGESTED CASES WITH THIS
CHAPTER
Case 3: NOCO United Soccer Academy
This case can be used to discuss gathering marketing information. Wesley Diekens of NOCO United
Soccer Academy appears to have relatively little factual information about his market. A discussion might
center on what type of market research he could do to fill this knowledge gap. The instructor might show
the marketing strategy planning process model (from the beginning of the chapter – or Exhibit 2-9) and
walk through each element. For example, the case gives relatively little information about competitors.
Does Wesley have this information? How could he gather such information? What does he currently know
about his customers? Wesley also has to make decisions about a marketing strategy. What information
would help him make better decisions about his marketing mix for each target market? How could he
gather that information?
There are opportunities to talk about both primary and secondary data. The five-step scientific approach
to the marketing research process (see Exhibit 7-3) could also be used to guide students through a
discussion. See case discussion in Part V.
Case 8: Besitti’s Restaurant
This case can be used to illustrate how our strategy planning framework can help identify the right
problem level and help focus marketing research—in this case on the target market. The case can also
be used to discuss how the five-step approach to marketing research would be applied, starting with
definition of the problem. As small as this company is, however, it probably could not afford much formal
research – this can be used to emphasize the need for careful execution of the first two steps. See case
discussion.
Case 9: Peaceful Rest Motor Lodge
This case can be used in the same way as suggested for Case 8. Both require more careful analysis of
alternative target markets. And both are small companies that probably will not be able to afford a formal
marketing strategy planning in all cases. See case discussion.
CHAPTER 7 – COMMENTS ON USE OF ETHICS QUESTION WITH THIS CHAPTER
Situation: You’re the new marketing manager for a small firm that offers computer repair services. The
company’s owner approves your proposal for a telephone survey to learn more about the needs of firms
that are not current customers. You identify local firms for the sample and hire a researcher to call them.
The interviewer tells respondents that their answers will be anonymous and used only for research
purposes. About halfway through the data collection, the interviewer tells you that respondents are
confused by one of the questions and that their answers to that question are probably useless. The

Chapter-by-chapter aids: Chapter 7

Part IV
Other low-cost options might include interviews with customers. For example, an interview guide could be
prepared and administered by phone to current customers and non-customers. HVC might develop a
customer satisfaction survey to make sure it understands customers’ satisfaction with the clinic. HVC
might also conduct some online research of best practices at other veterinary clinics. Such benchmarking
studies might help HVC generate additional ideas for its marketing strategy.


