Chapter 11 – Capacity Planning
11-12
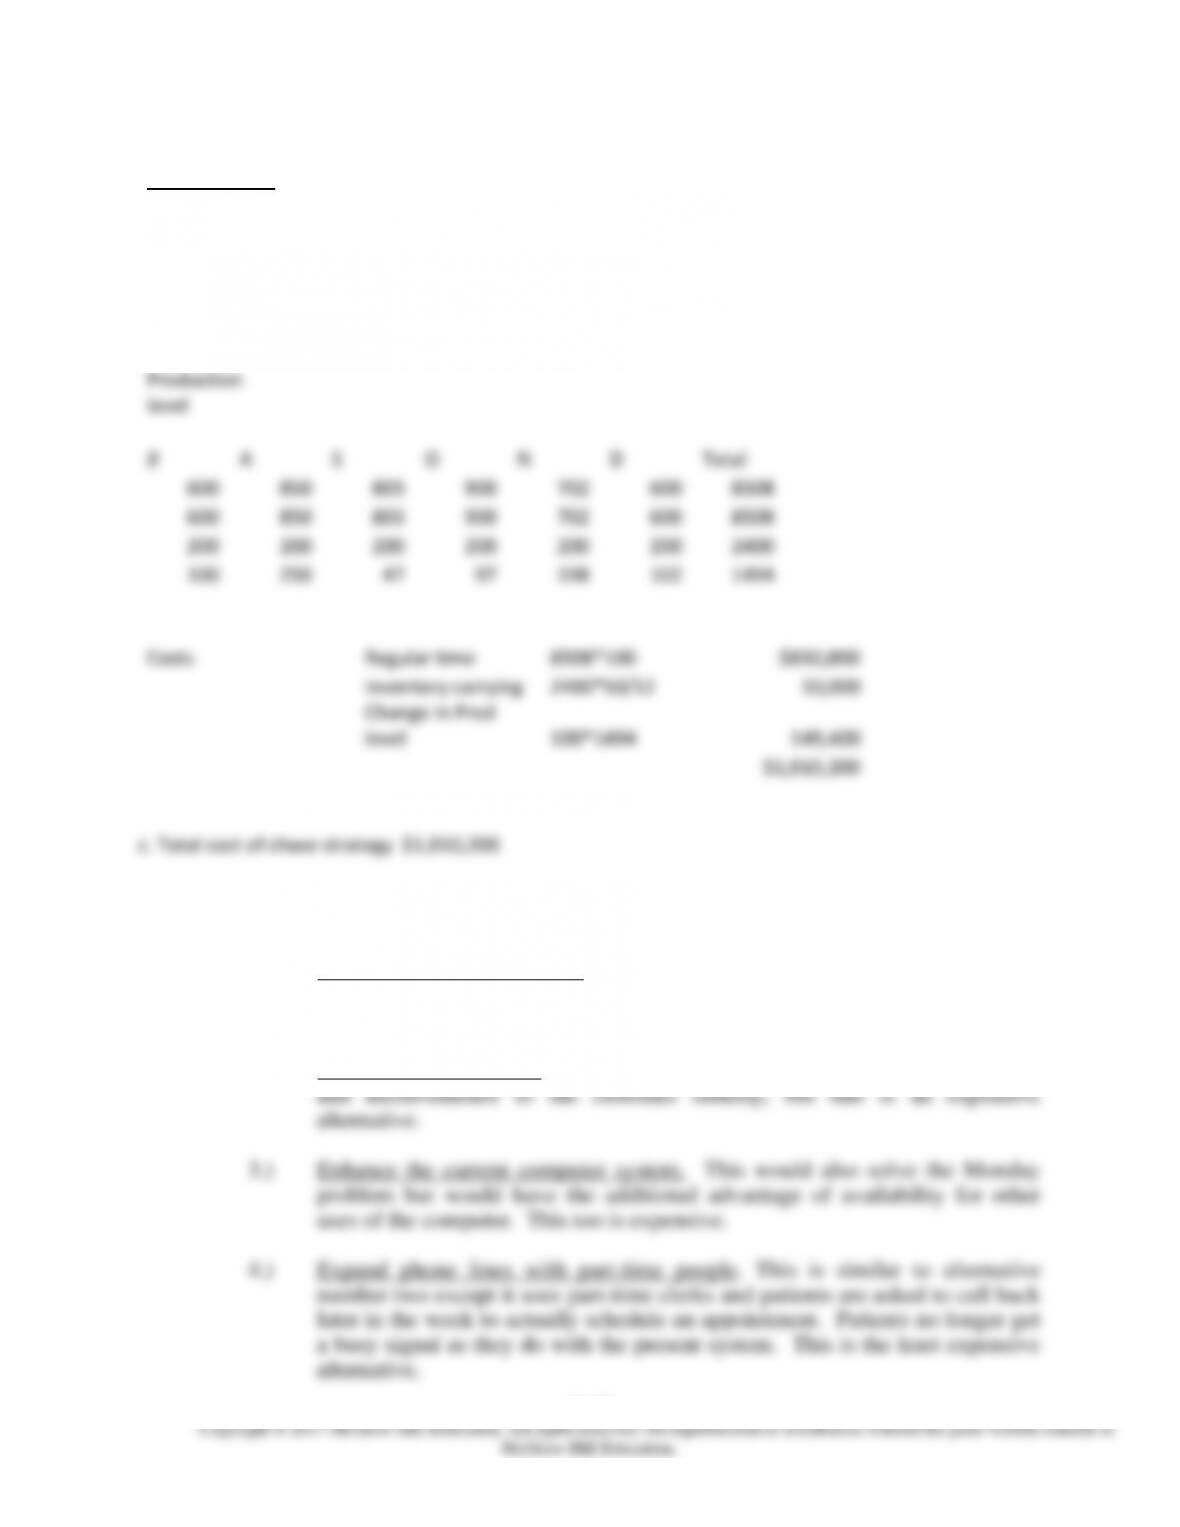
Chase Strategy
J
F
M
A
M
J
Demand
651
700
850
702
650
500
Production
651
700
850
702
650
500
Inventory
200
200
200
200
200
200
Change in
151
49
150
148
52
150
Production
level
Jl
A
S
O
N
D
Total
600
850
803
900
702
600
8508
600
850
803
900
702
600
8508
200
200
200
200
200
200
2400
100
250
47
97
198
102
1494
Costs
Regular time
8508*100
$850,800
Inventory carrying
2400*50/12
10,000
Change in Prod
level
100*1494
149,400
$1,010,200
8.
a. 1.) Continue the present System. Advantages to this strategy are that no risks are
taken and no money is spent. However, there is considerable potential loss in
business and inconvenience for customers.
2.) Expand the phone lines. This strategy would eliminate the loss of business
Chapter 11 – Capacity Planning
11-13
b. Which alternative is best depends on what level of customer service is desired.
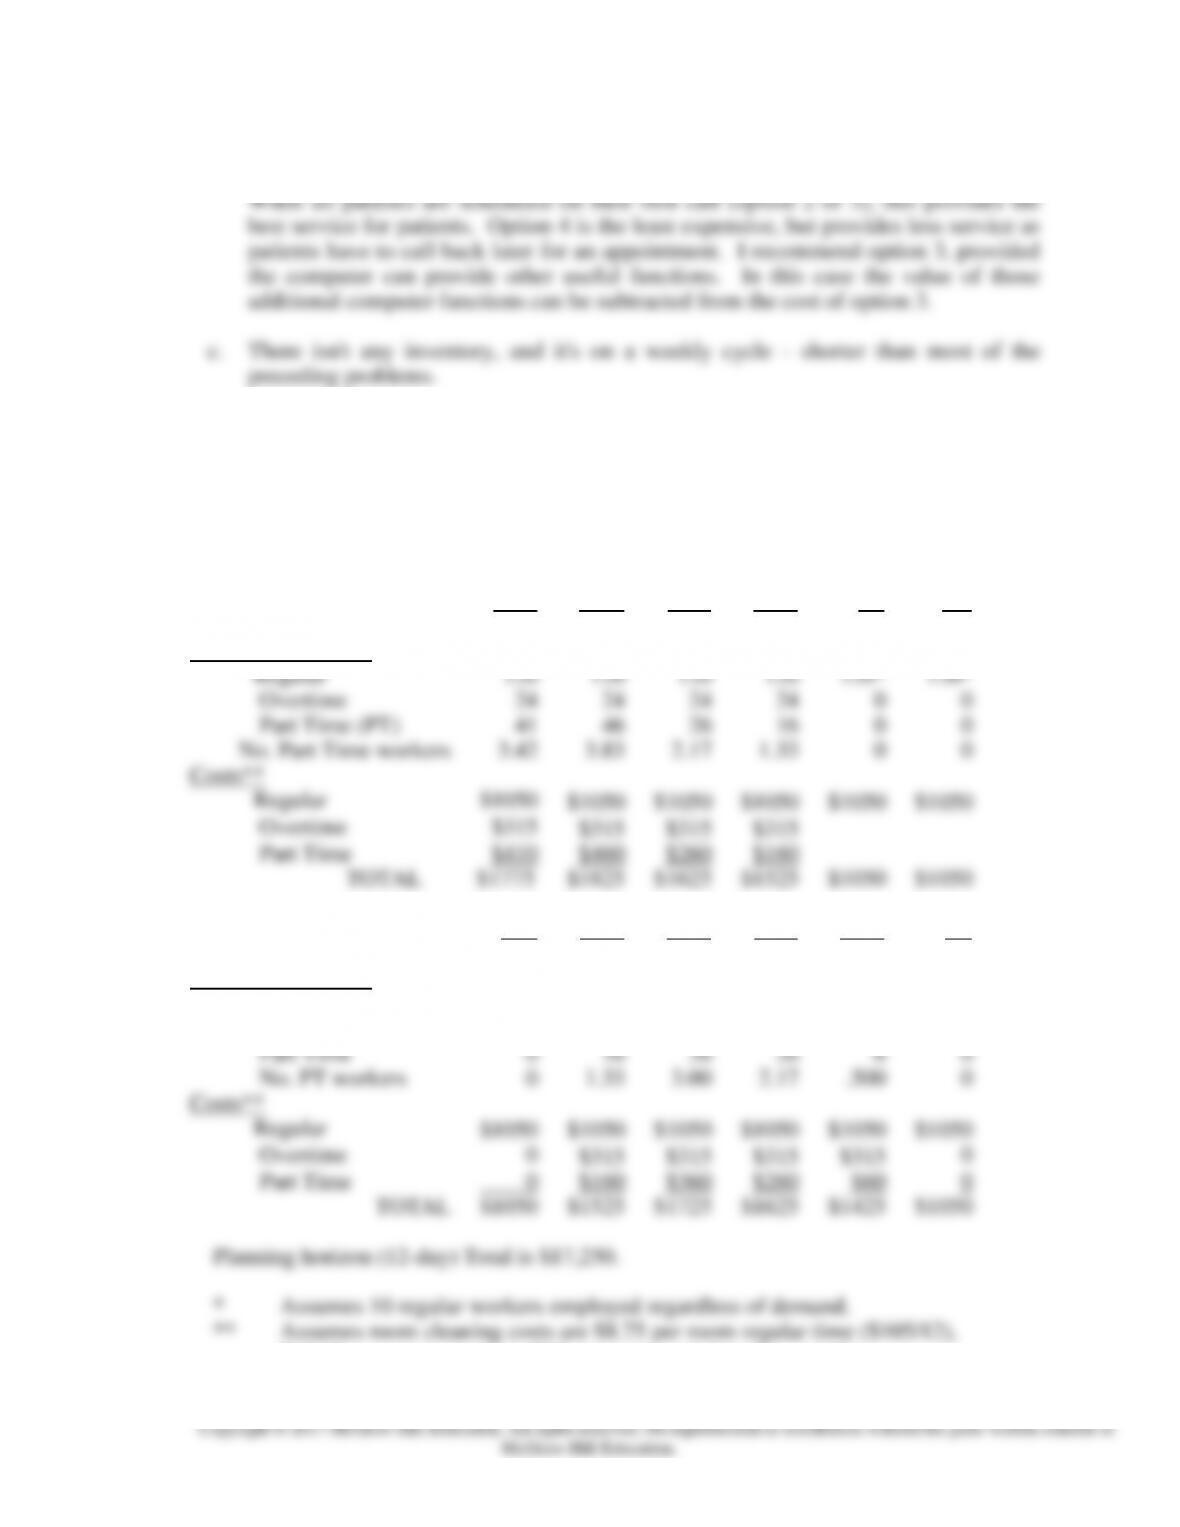
9. a. Assumes maximum overtime is used before part-time workers are hired.
Total cost is $17,250
Mon
Tues
Wed
Thur
Fri
Sat
Demand (Rooms)
185
190
170
160
110
100
Rooms Cleaned by:
Regular
120
120
120
120
120*
120*
Overtime
24
24
24
24
0
0
Part Time (PT)
41
46
26
16
0
0
No. Part Time workers
3.42
3.83
2.17
1.33
0
0
Costs**
Regular
$1050
$1050
$1050
$1050
$1050
$1050
Overtime
$315
$315
$315
$315
Part Time
$410
$460
$260
$160
TOTAL
$1775
$1825
$1625
$1525
$1050
$1050
Sun
Mon
Tues
Wed
Thur
Fri
Demand (Rooms)
100
160
180
170
150
100
Rooms Cleaned by:
Regular
120*
120
120
120
120
120*
Overtime
0
24
24
24
24
0
Part Time
0
16
36
26
6
0
No. PT workers
0
1.33
3.00
2.17
.500
0
Costs**
Regular
$1050
$1050
$1050
$1050
$1050
$1050
Overtime
0
$315
$315
$315
$315
0
Part Time
0
$160
$360
$260
$60
0
TOTAL
$1050
$1525
$1725
$1625
$1425
$1050
Planning horizon (12-day) Total is $17,250.
* Assumes 10 regular workers employed regardless of demand.
** Assumes room cleaning costs are $8.75 per room regular time ($105/12),
$13.12 per room overtime, $10 per room part-time (see part b).
Chapter 11 – Capacity Planning
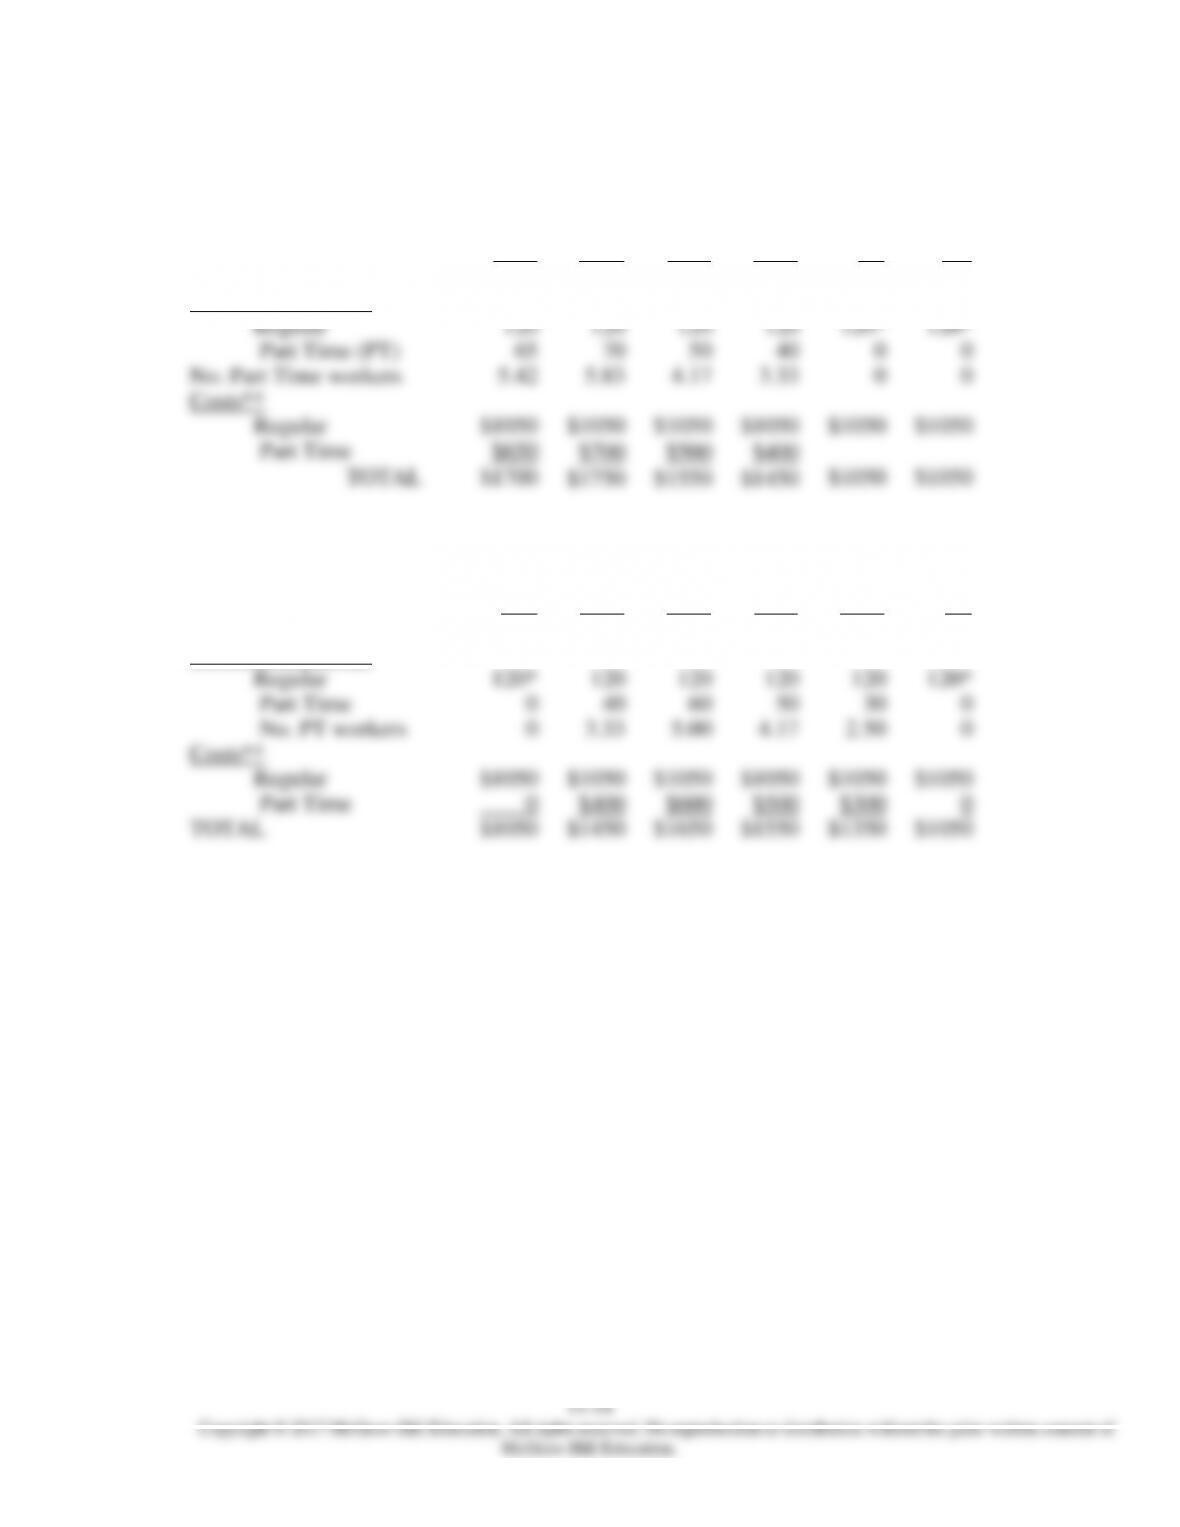
b. Total cost is $16,650
Mon
Tues
Wed
Thur
Fri
Sat
Demand (Rooms)
185
190
170
160
110
100
Rooms Cleaned by:
Regular
120
120
120
120
120*
120*
Part Time (PT)
65
70
50
40
0
0
No. Part Time workers
5.42
5.83
4.17
3.33
0
0
Costs**
Regular
$1050
$1050
$1050
$1050
$1050
$1050
Part Time
$650
$700
$500
$400
TOTAL
$1700
$1750
$1550
$1450
$1050
$1050
Sun
Mon
Tues
Wed
Thur
Fri
Demand (Rooms)
100
160
180
170
150
100
Rooms Cleaned by:
Regular
120*
120
120
120
120
120*
Part Time
0
40
60
50
30
0
No. PT workers
0
3.33
5.00
4.17
2.50
0
Costs**
Regular
$1050
$1050
$1050
$1050
$1050
$1050
Part Time
0
$400
$600
$500
$300
0
TOTAL
$1050
$1450
$1650
$1550
$1350
$1050
11-15
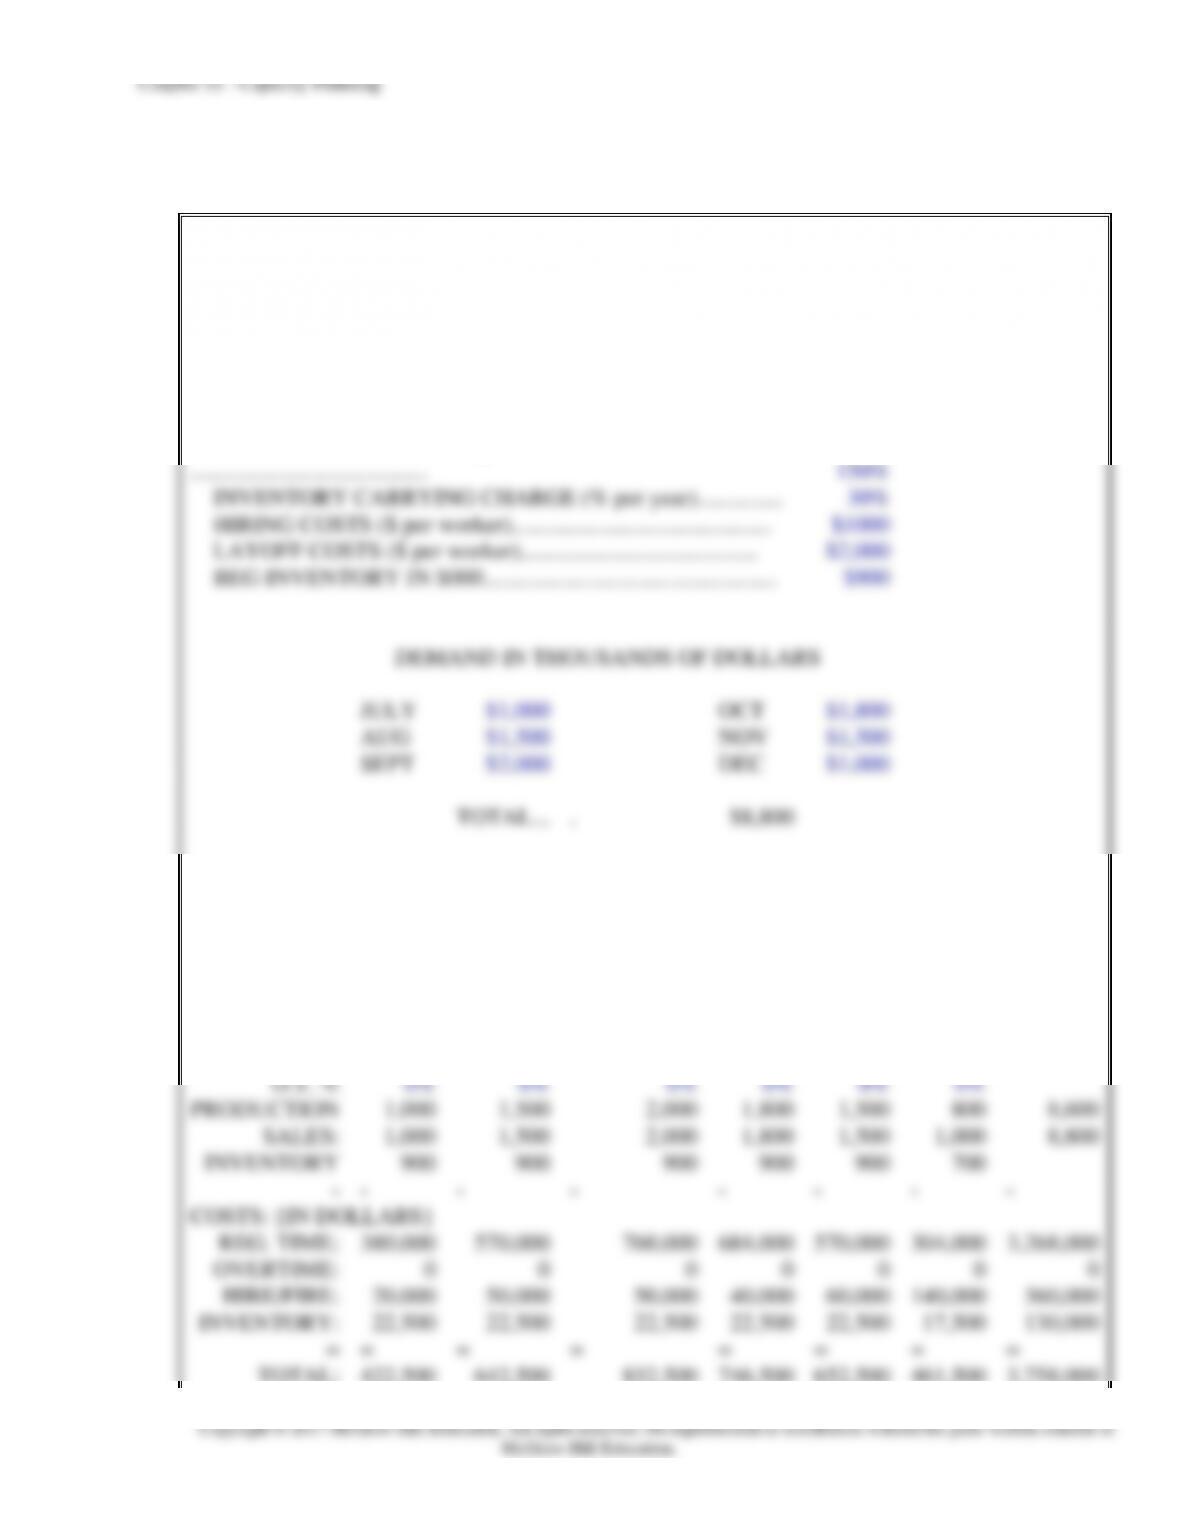
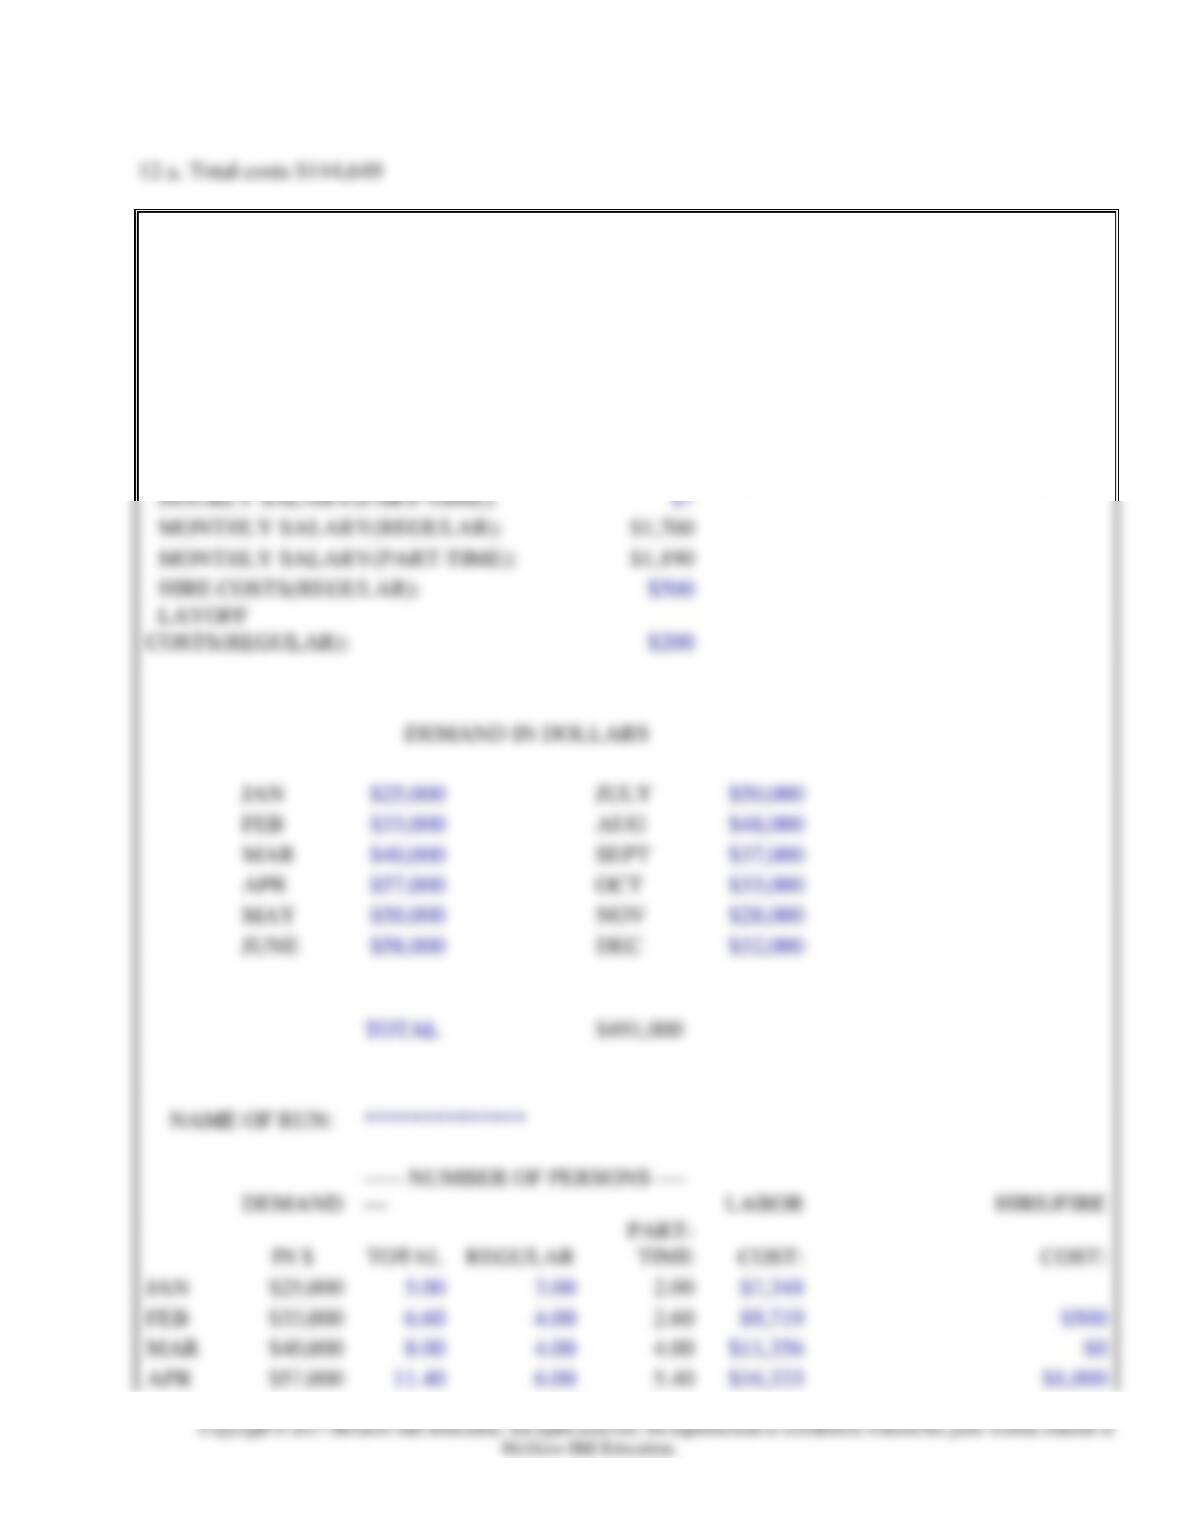
10. a. The cost of the chase strategy is $3,758,000.
NAME:
***************
CHAPTER 11, PROBLEM 10
SECT:
***************
DATE:
15-Feb-
16
INPUT SECTION:
PRESENT LABOR FORCE (employees)………………………..
80
TOYS PER WORKER PER MONTH IN $000…………………..
$10
REGULAR WAGE RATE PER MONTH………………………..
$3,800
OVERTIME RATE (% of regular time)
…………………………………..
150%
INVENTORY CARRYING CHARGE (% per year)……………
30%
HIRING COSTS ($ per worker)………………………………………
$1000
LAYOFF COSTS ($ per worker)…………………………………..
$2,000
BEG INVENTORY IN $000……………………………………………
$900
DEMAND IN THOUSANDS OF DOLLARS
JULY
$1,000
OCT
$1,800
AUG
$1,500
NOV
$1,500
SEPT
$2,000
DEC
$1,000
TOTAL…
.
$8,800
STRATEGY:
Chase
MONTH
JULY
AUG
SEPT
OCT
NOV
DEC
TOTAL
RESOURCES:
{PRODUCTION, SALES, AND INVENTORIES IN $000}
REG
WORKER:
100
150
200
180
150
80
O.T. %
0%
0%
0%
0%
0%
0%
PRODUCTION
1,000
1,500
2,000
1,800
1,500
800
8,600
SALES:
1,000
1,500
2,000
1,800
1,500
1,000
8,800
INVENTORY
900
900
900
900
900
700
–
–
–
–
–
–
–
–
COSTS: {IN DOLLARS}
REG. TIME:
380,000
570,000
760,000
684,000
570,000
304,000
3,268,000
OVERTIME:
0
0
0
0
0
0
0
HIRE/FIRE:
20,000
50,000
50,000
40,000
60,000
140,000
360,000
INVENTORY:
22,500
22,500
22,500
22,500
22,500
17,500
130,000
=
=
=
=
=
=
=
=
TOTAL:
422,500
642,500
832,500
746,500
652,500
461,500
3,758,000
Chapter 11 – Capacity Planning
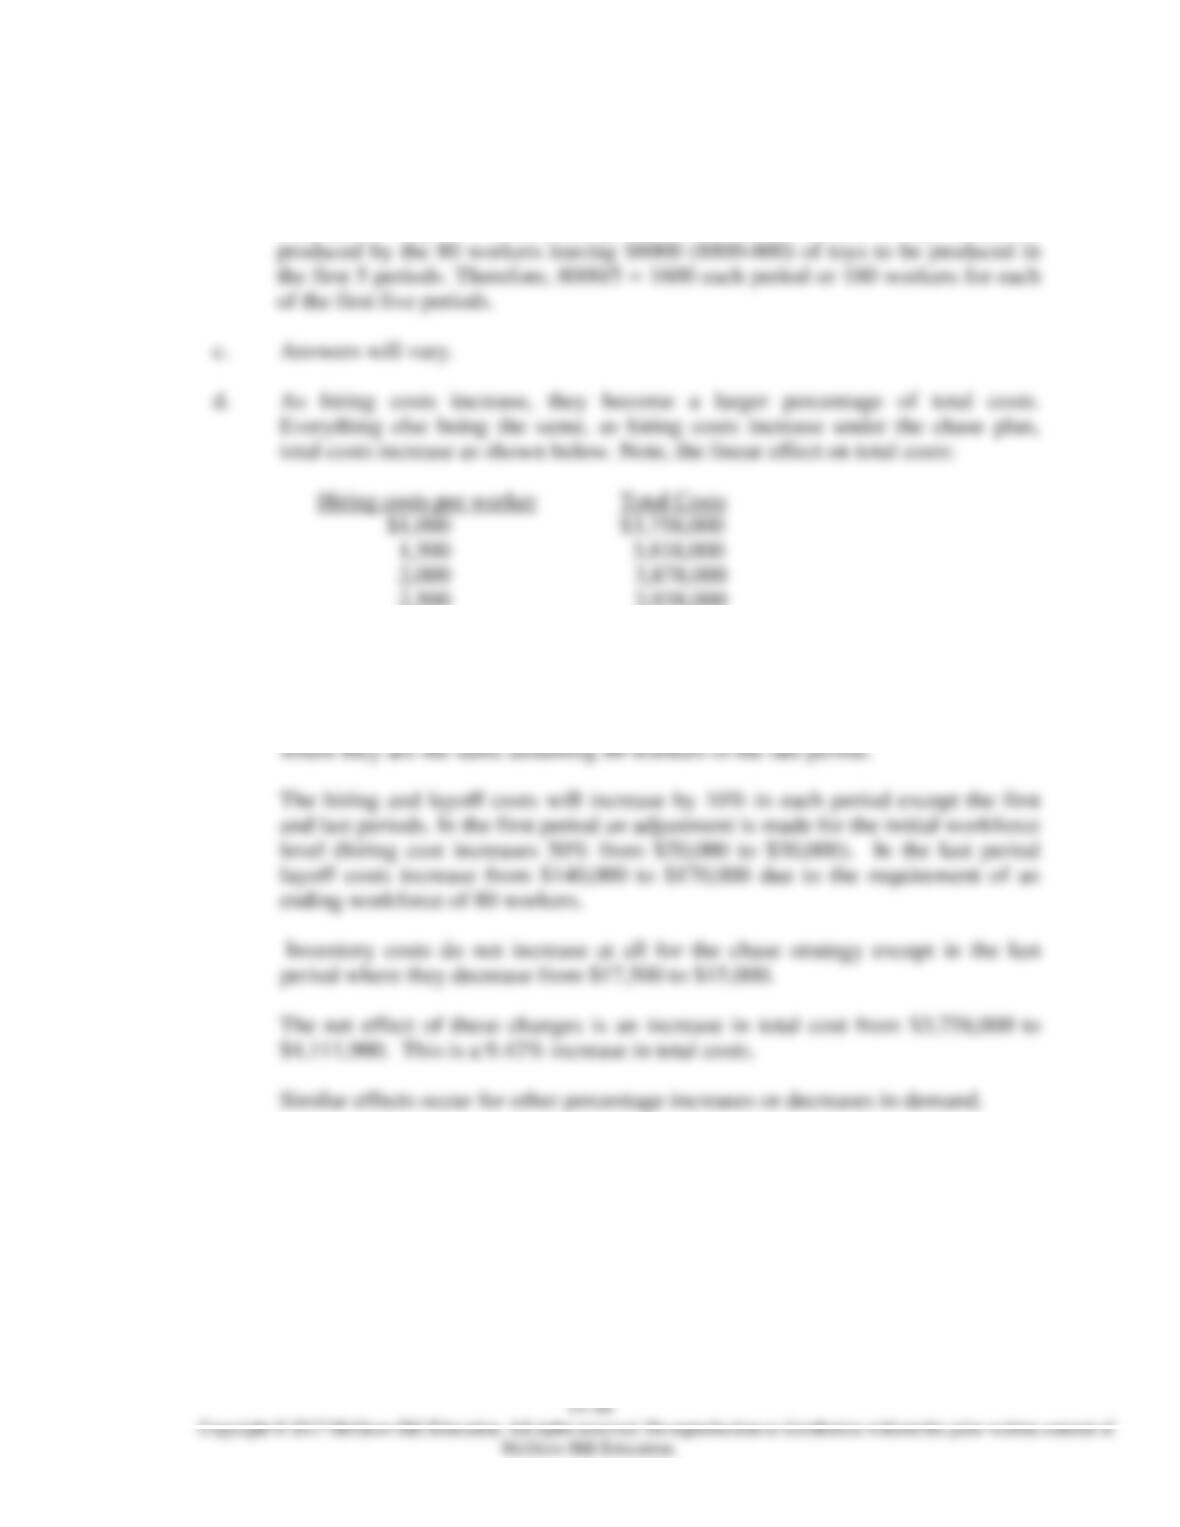
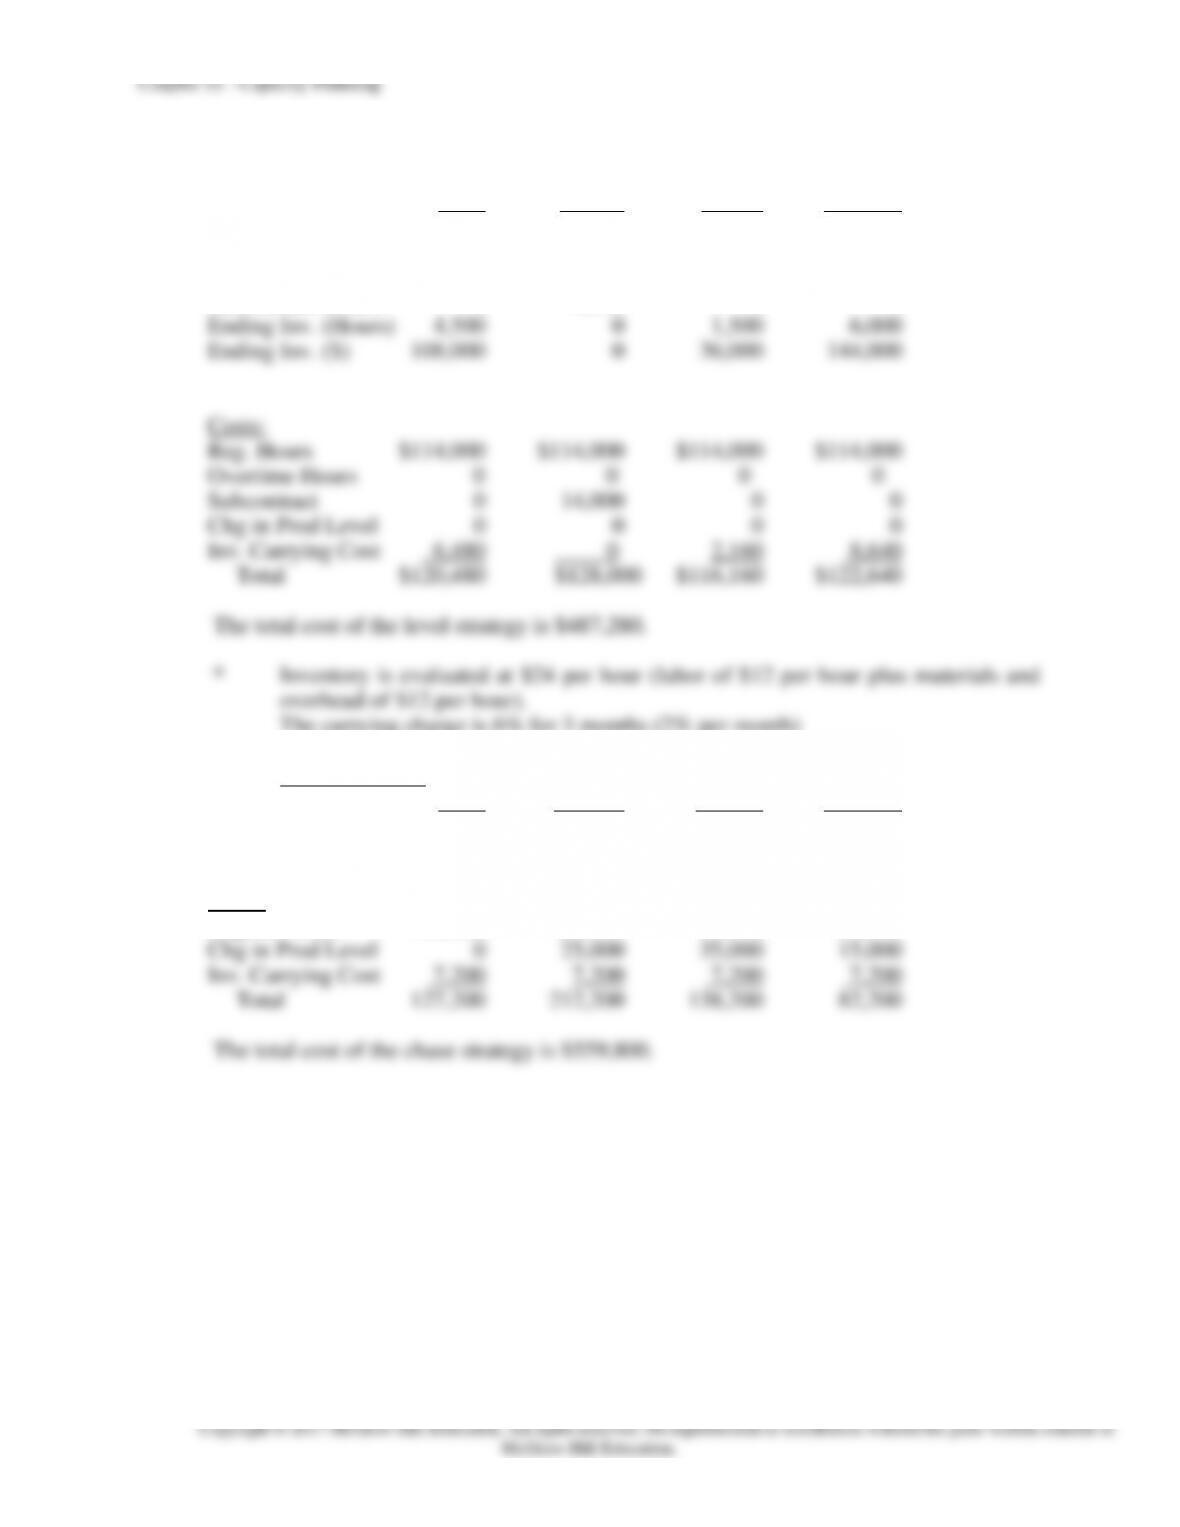
b. The cost of the level strategy is $3,766,500. Note: the level strategy provides for
the same number of workers in each period, except the last period where 80
workers are required. In the last period $ 800 (in thousands) of toys would be
2,500 3,938,000
e. The effect of a 10% increase in demand, for example, will have the following
effects:
Increase regular time worker costs by 10% in each period except the last period
11-17
11. a. Level Strategy:
Fall Winter Spring Summer
Demand (Hours) 10,000 15,000 8,000 5,000
Reg. Hours 9,500 9,500 9,500 9,500
Overtime Hours 0 0 0 0
Subcontract Hours 0 1,000 0 0
The carrying charge is 6% for 3 months (2% per month)
b. Chase Strategy:
Fall Winter Spring Summer
Demand (Hours) 10,000 15,000 8,000 5,000
Regular Hours 10,000 15,000 8,000 5,000
Costs:
Regular Hours 120,000 180,000 96,000 60,000
Chapter 11 – Capacity Planning
11-18
Copyright © 2017 McGraw-Hill Education. All rights reserved. No reproduction or distribution without the prior written consent of
McGraw-Hill Education.
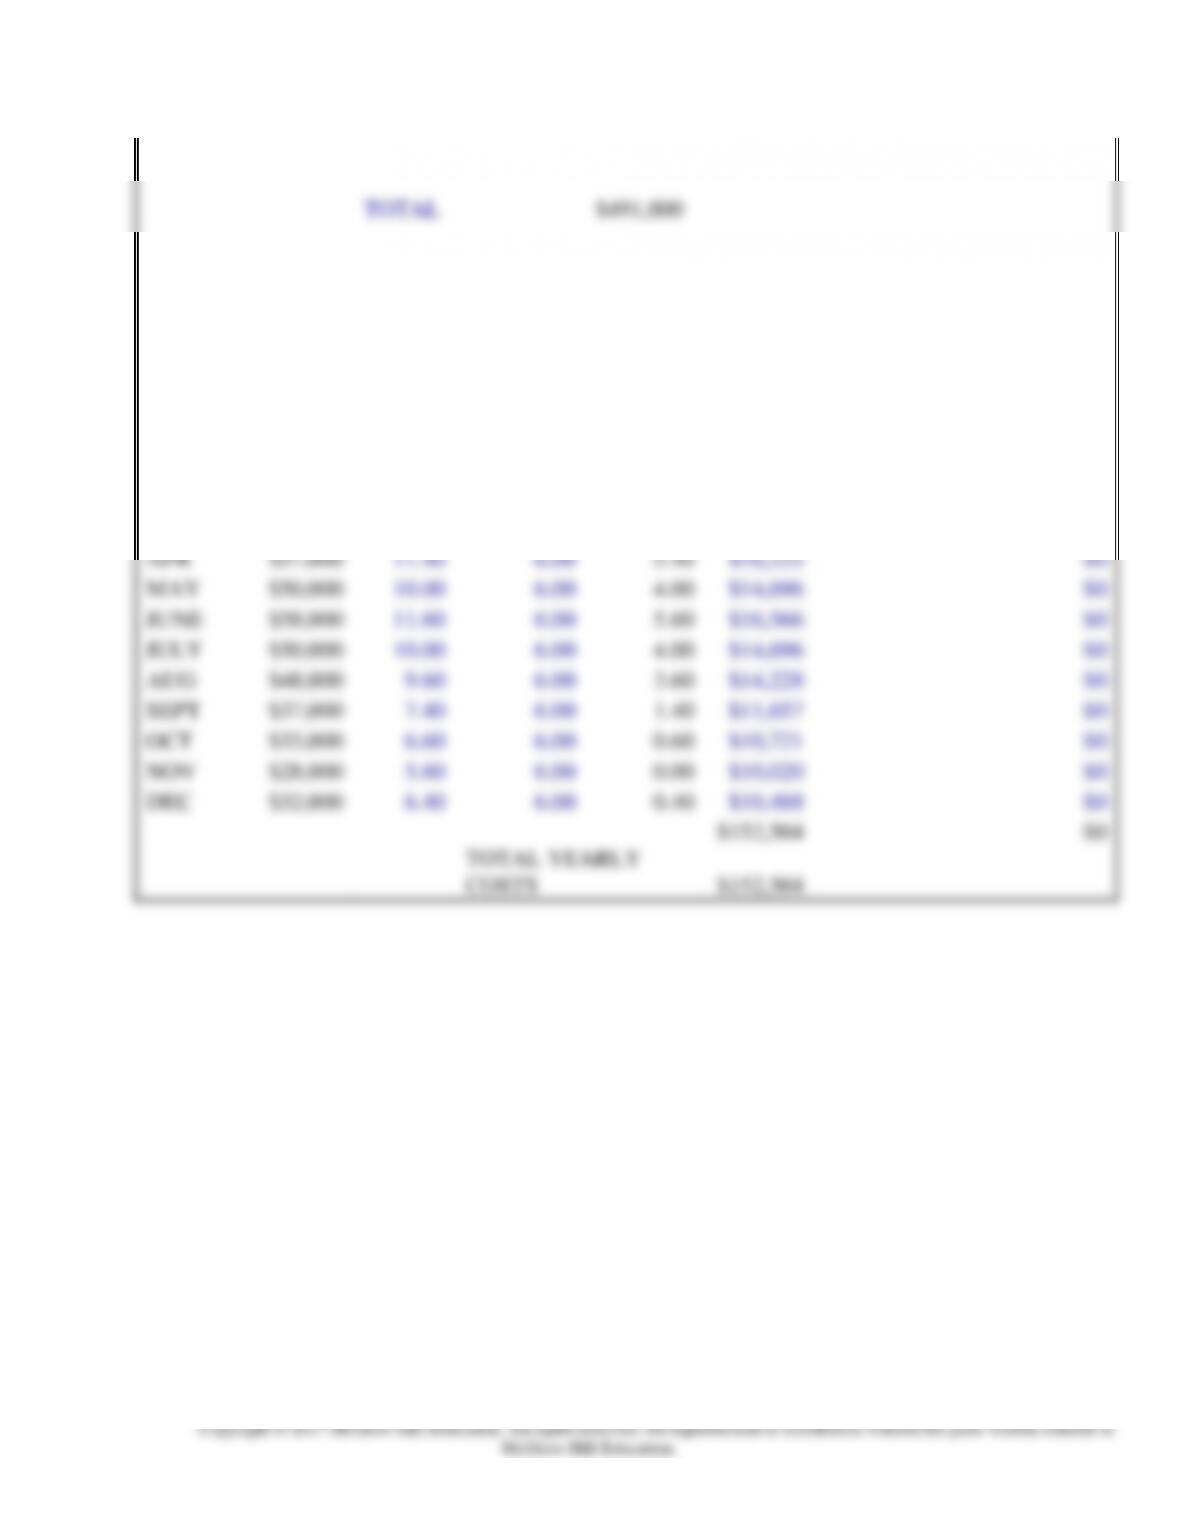
12 a. Total costs $144,649
NAME:
*****************
CHAPTER 11,
PROBLEM 12
SECT:
********
DATE:
21-Sep-16
INPUT SECTION:
PRODUCTION/WORKER/MONTH:
$5,000
HOURLY SALARY(REGULAR):
$10
HOURLY SALARY(PART-TIME):
$7
MONTHLY SALARY(REGULAR):
$1,700
MONTHLY SALARY(PART-TIME):
$1,190
HIRE COSTS(REGULAR):
$500
LAYOFF
COSTS(REGULAR):
$200
DEMAND IN DOLLARS
JAN
$25,000
JULY
$50,000
FEB
$33,000
AUG
$48,000
MAR
$40,000
SEPT
$37,000
APR
$57,000
OCT
$33,000
MAY
$50,000
NOV
$28,000
JUNE
$58,000
DEC
$32,000
TOTAL
$491,000
NAME OF RUN:
**************
DEMAND
—– NUMBER OF PERSONS —-
—
LABOR
HIRE/FIRE
IN $
TOTAL
REGULAR
PART-
TIME
COST:
COST:
JAN
$25,000
5.00
3.00
2.00
$7,348
FEB
$33,000
6.60
4.00
2.60
$9,719
$500
MAR
$40,000
8.00
4.00
4.00
$11,356
$0
APR
$57,000
11.40
6.00
5.40
$16,333
$1,000
Chapter 11 – Capacity Planning
11-19
MAY
$50,000
10.00
5.00
5.00
$14,195
$200
JUNE
$58,000
11.60
6.00
5.60
$16,566
$500
JULY
$50,000
10.00
5.00
5.00
$14,195
$200
AUG
$48,000
9.60
5.00
4.60
$13,727
$0
SEPT
$37,000
7.40
4.00
3.40
$10,655
$200
OCT
$33,000
6.60
4.00
2.60
$9,719
$0
NOV
$28,000
5.60
3.00
2.60
$8,049
$200
DEC
$32,000
6.40
4.00
2.40
$9,486
$500
$141,349
$3,300
TOTAL YEARLY
COSTS
$144,649
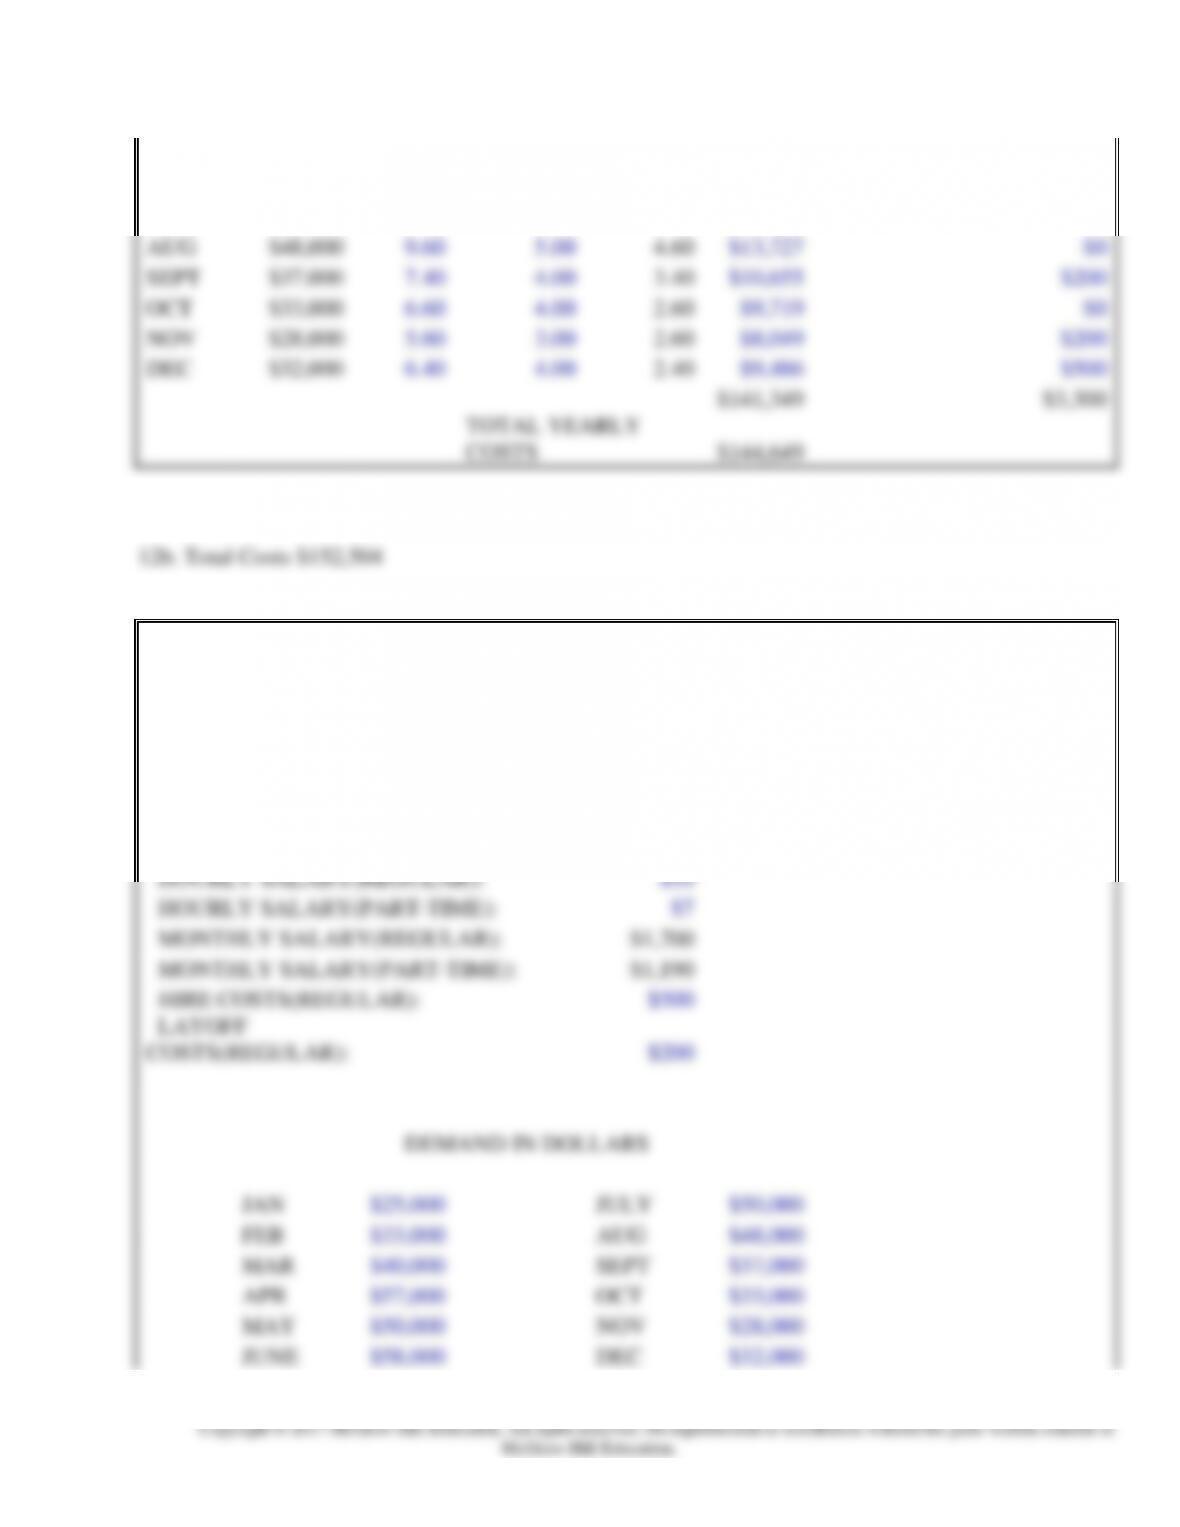
NAME:
*****************
CHAPTER 11,
PROBLEM 12
SECT:
********
DATE:
21-Sep-16
INPUT SECTION:
PRODUCTION/WORKER/MONTH:
$5,000
HOURLY SALARY(REGULAR):
$10
HOURLY SALARY(PART-TIME):
$7
MONTHLY SALARY(REGULAR):
$1,700
MONTHLY SALARY(PART-TIME):
$1,190
HIRE COSTS(REGULAR):
$500
LAYOFF
COSTS(REGULAR):
$200
DEMAND IN DOLLARS
JAN
$25,000
JULY
$50,000
FEB
$33,000
AUG
$48,000
MAR
$40,000
SEPT
$37,000
APR
$57,000
OCT
$33,000
MAY
$50,000
NOV
$28,000
JUNE
$58,000
DEC
$32,000
Chapter 11 – Capacity Planning
11-20
TOTAL
$491,000
NAME OF RUN:
**************
DEMAND
—– NUMBER OF PERSONS —-
—
LABOR
HIRE/FIRE
IN $
TOTAL
REGULAR
PART-
TIME
COST:
COST:
JAN
$25,000
5.00
6.00
0.00
$10,020
FEB
$33,000
6.60
6.00
0.60
$10,721
$0
MAR
$40,000
8.00
6.00
2.00
$12,358
$0
APR
$57,000
11.40
6.00
5.40
$16,333
$0
MAY
$50,000
10.00
6.00
4.00
$14,696
$0
JUNE
$58,000
11.60
6.00
5.60
$16,566
$0
JULY
$50,000
10.00
6.00
4.00
$14,696
$0
AUG
$48,000
9.60
6.00
3.60
$14,228
$0
SEPT
$37,000
7.40
6.00
1.40
$11,657
$0
OCT
$33,000
6.60
6.00
0.60
$10,721
$0
NOV
$28,000
5.60
6.00
0.00
$10,020
$0
DEC
$32,000
6.40
6.00
0.40
$10,488
$0
$152,504
$0
TOTAL YEARLY
COSTS
$152,504
Chapter 11 – Capacity Planning
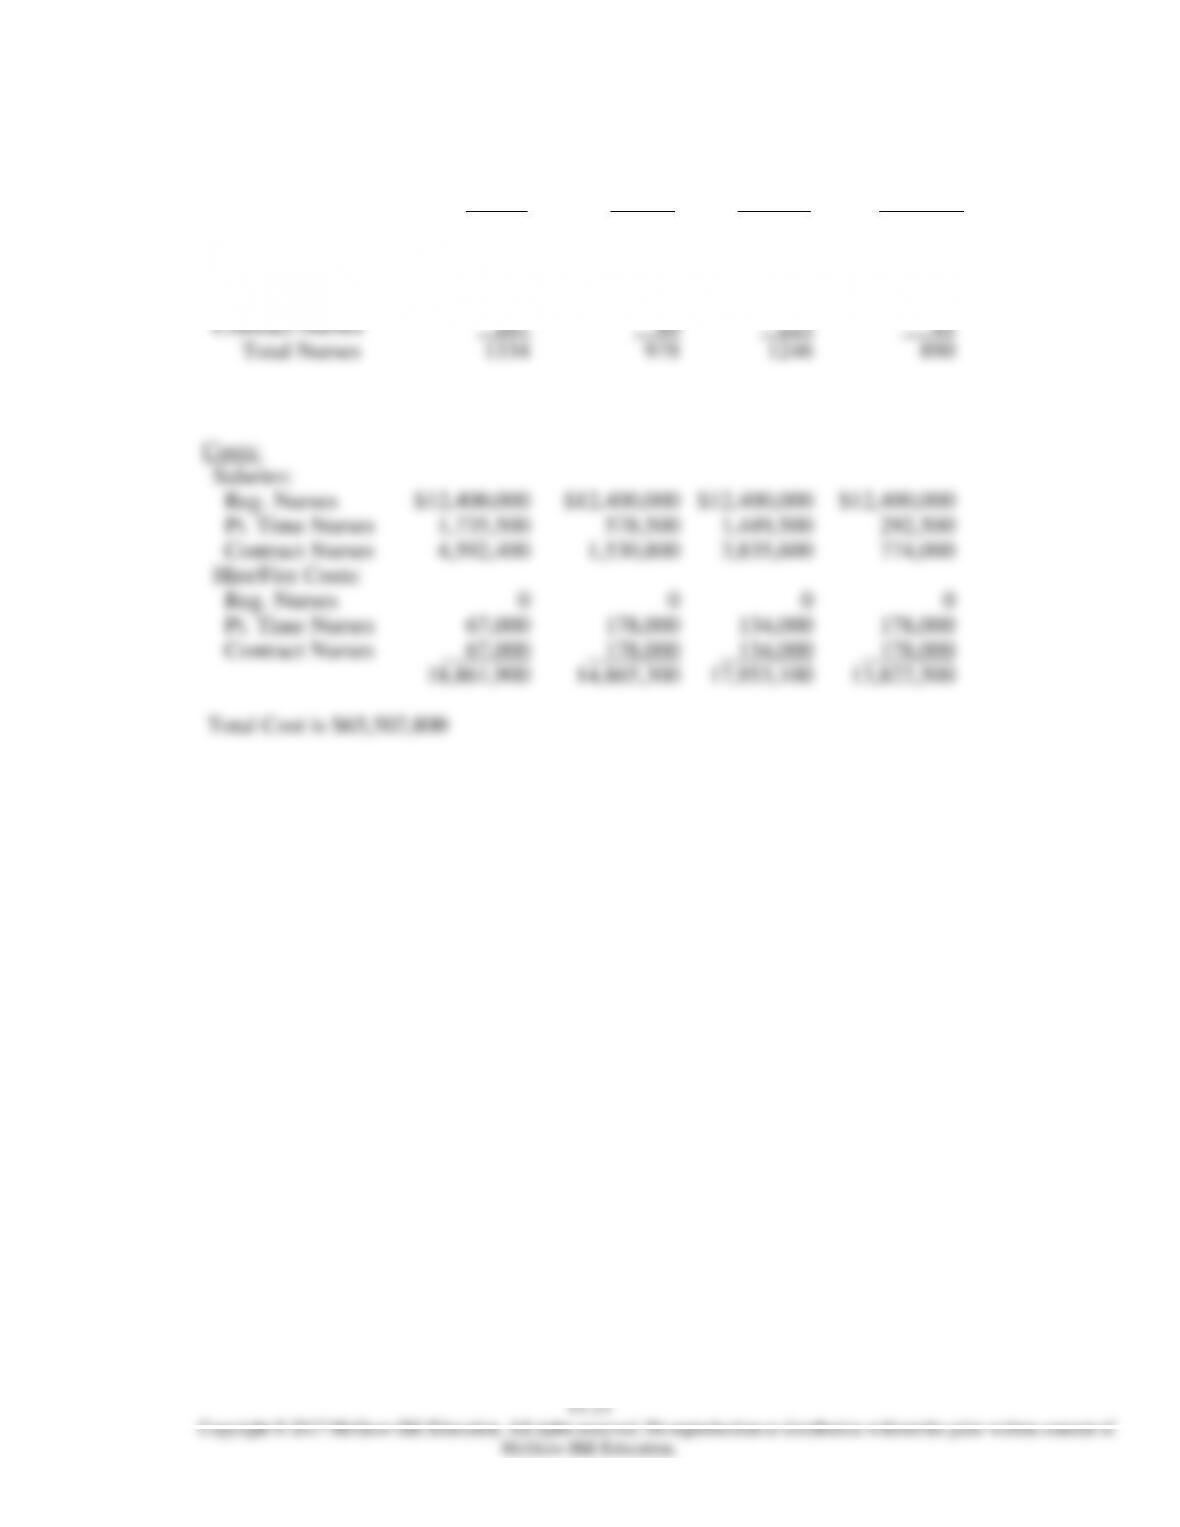
13. Assume each patient day requires 0.8 nurse days.
Fall Winter Spring Summer
Forecast – Pt. Days 90,000 70,000 85,000 65,000
Forecast – Nurse Days 72,000 56,000 68,000 52,000
Reg. Nurses 800 800 800 800
Pt. Time Nurses 267 89 223 45