Chapter 09 – Short-Term Profit Planning: Cost-Volume-Profit (CVP) Analysis
9-40 (Continued-1)
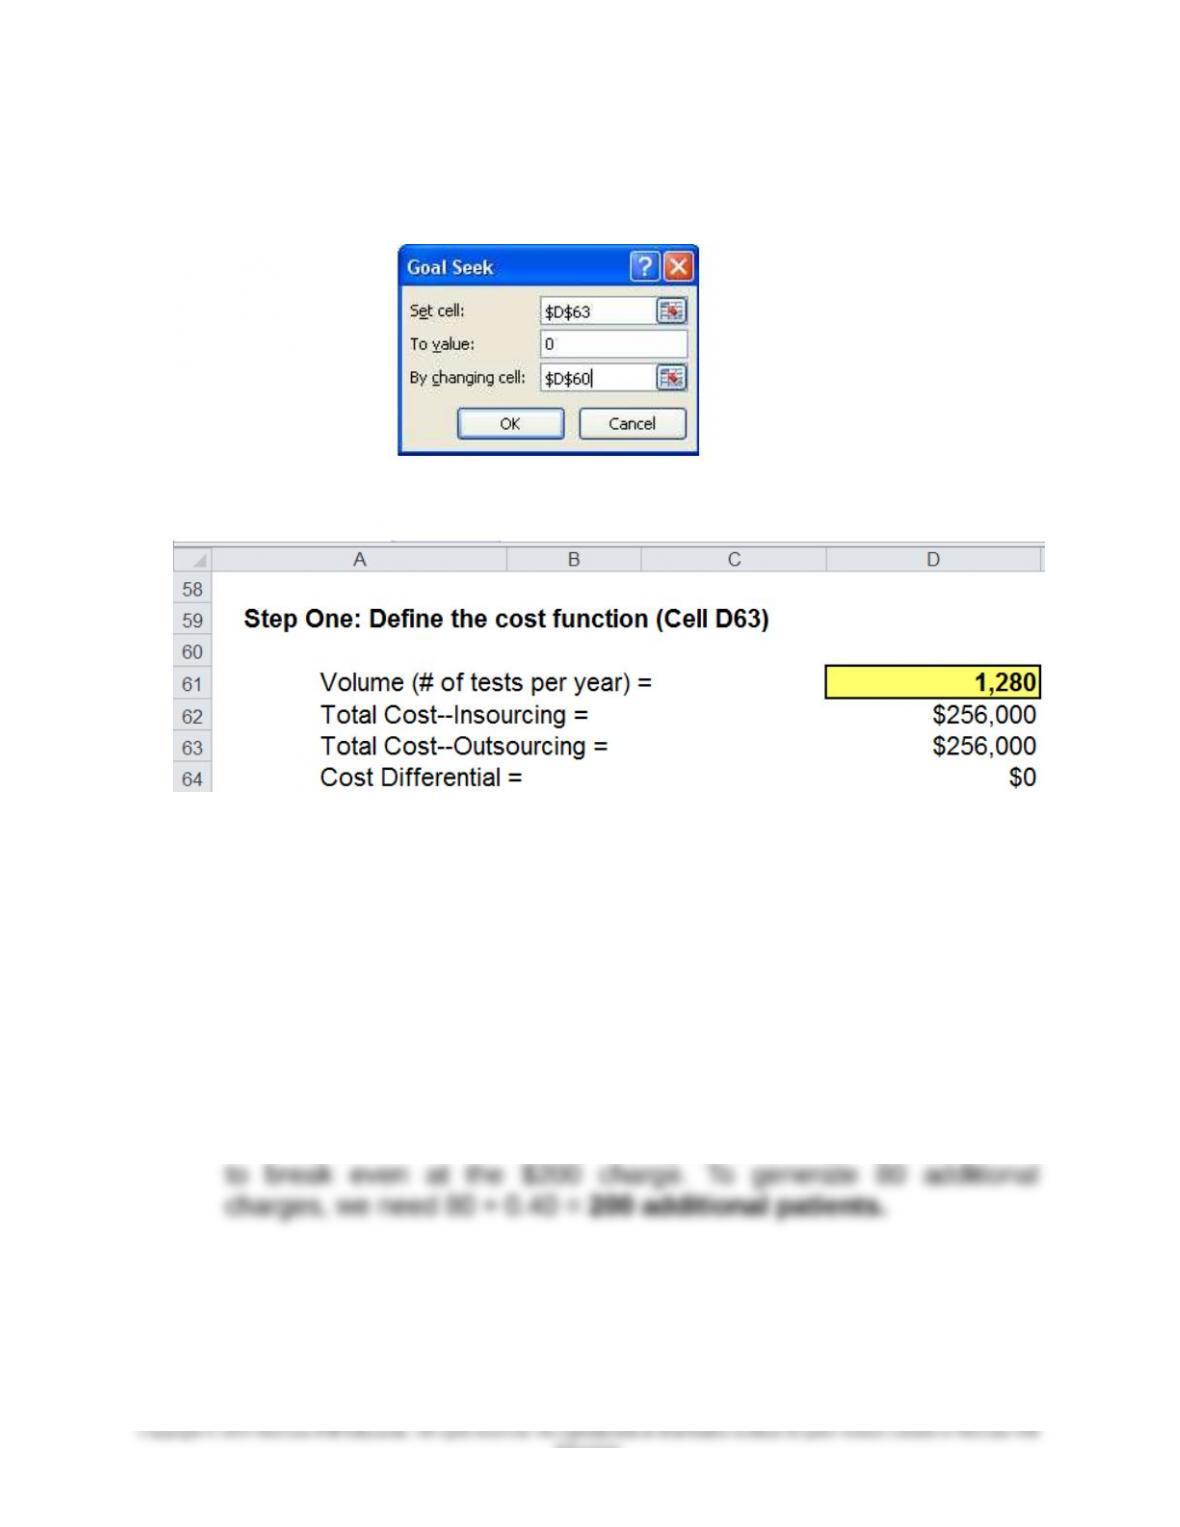
Step Two: Run Goal Seek
Step Three: Results
Thus, at 1,280 tests per year, the total cost under each of the two
decision alternatives would be the same: $256,000.
3. Current number of patients per year needing analysis = 3,000
# needing blood-gas analysis = 3,000 × 40% = 1,200
The difference = 1,280 − 1,200 = 80 tests per year
80 is the additional number of blood gas samples (per year) needed
9-40
Education.
Chapter 09 – Short-Term Profit Planning: Cost-Volume-Profit (CVP) Analysis
9-40 (Continued-2)
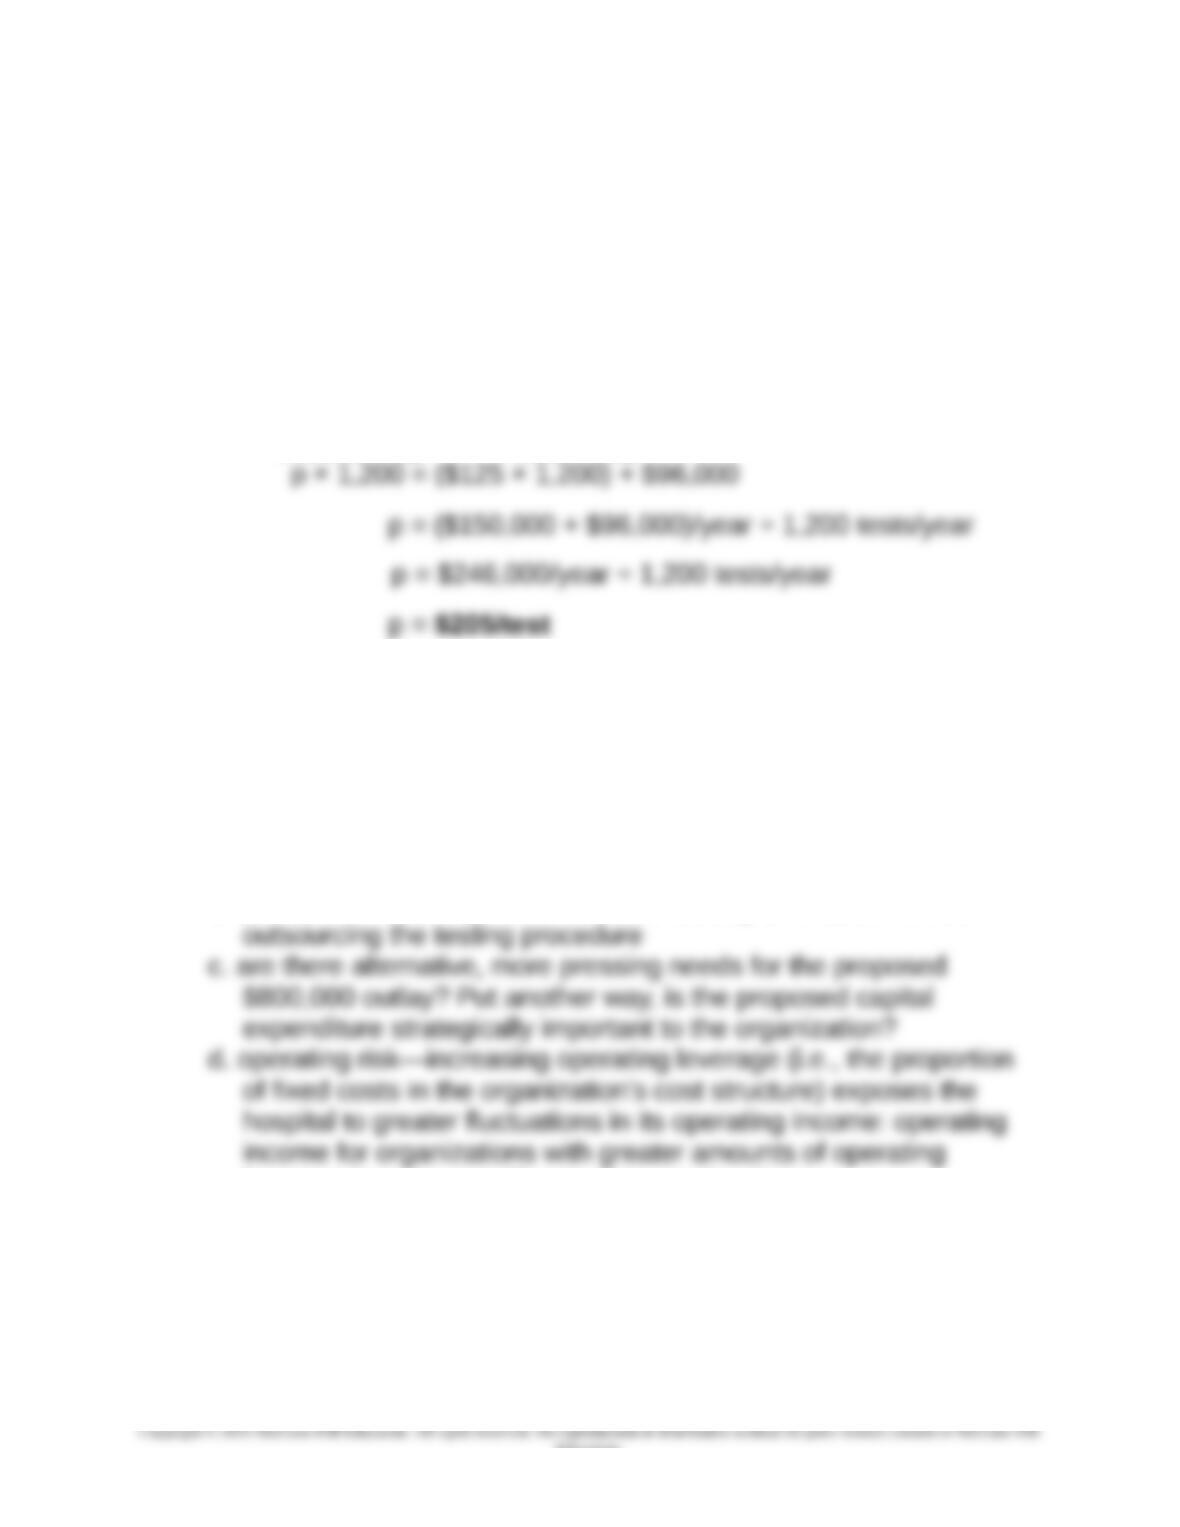
4. Indifference point—external price/test that would make the lab
indifferent between the two decision alternatives (i.e., insource vs.
outsource):
Let p = required charge (external service fee)
Current # of tests performed per year = 3,000 × 0.40 = 1,200
To solve for the breakeven charge rate (per test):
Outsourcing Insourcing
Note: the above result could have been obtained, as well, through
the use of Goal Seek.
5. Additional factors to be considered:
a. time-value-of-money (opportunity cost of capital)—the decision at
hand is really a capital budgeting problem
b. quality and reliability of the in-house testing alternative versus
leverage is more sensitive to changes in volume.
e. would the purchase of the machine now provide a disincentive to
invest in this area in the future?
9-41
Education.
Chapter 09 – Short-Term Profit Planning: Cost-Volume-Profit (CVP) Analysis
9-41 CVP Analysis in a Professional Service Firm (30 min)
1. If operating profit is to increase, the contribution margin (i.e., revenue
less variable costs) of the new business must exceed any incremental
fixed costs.
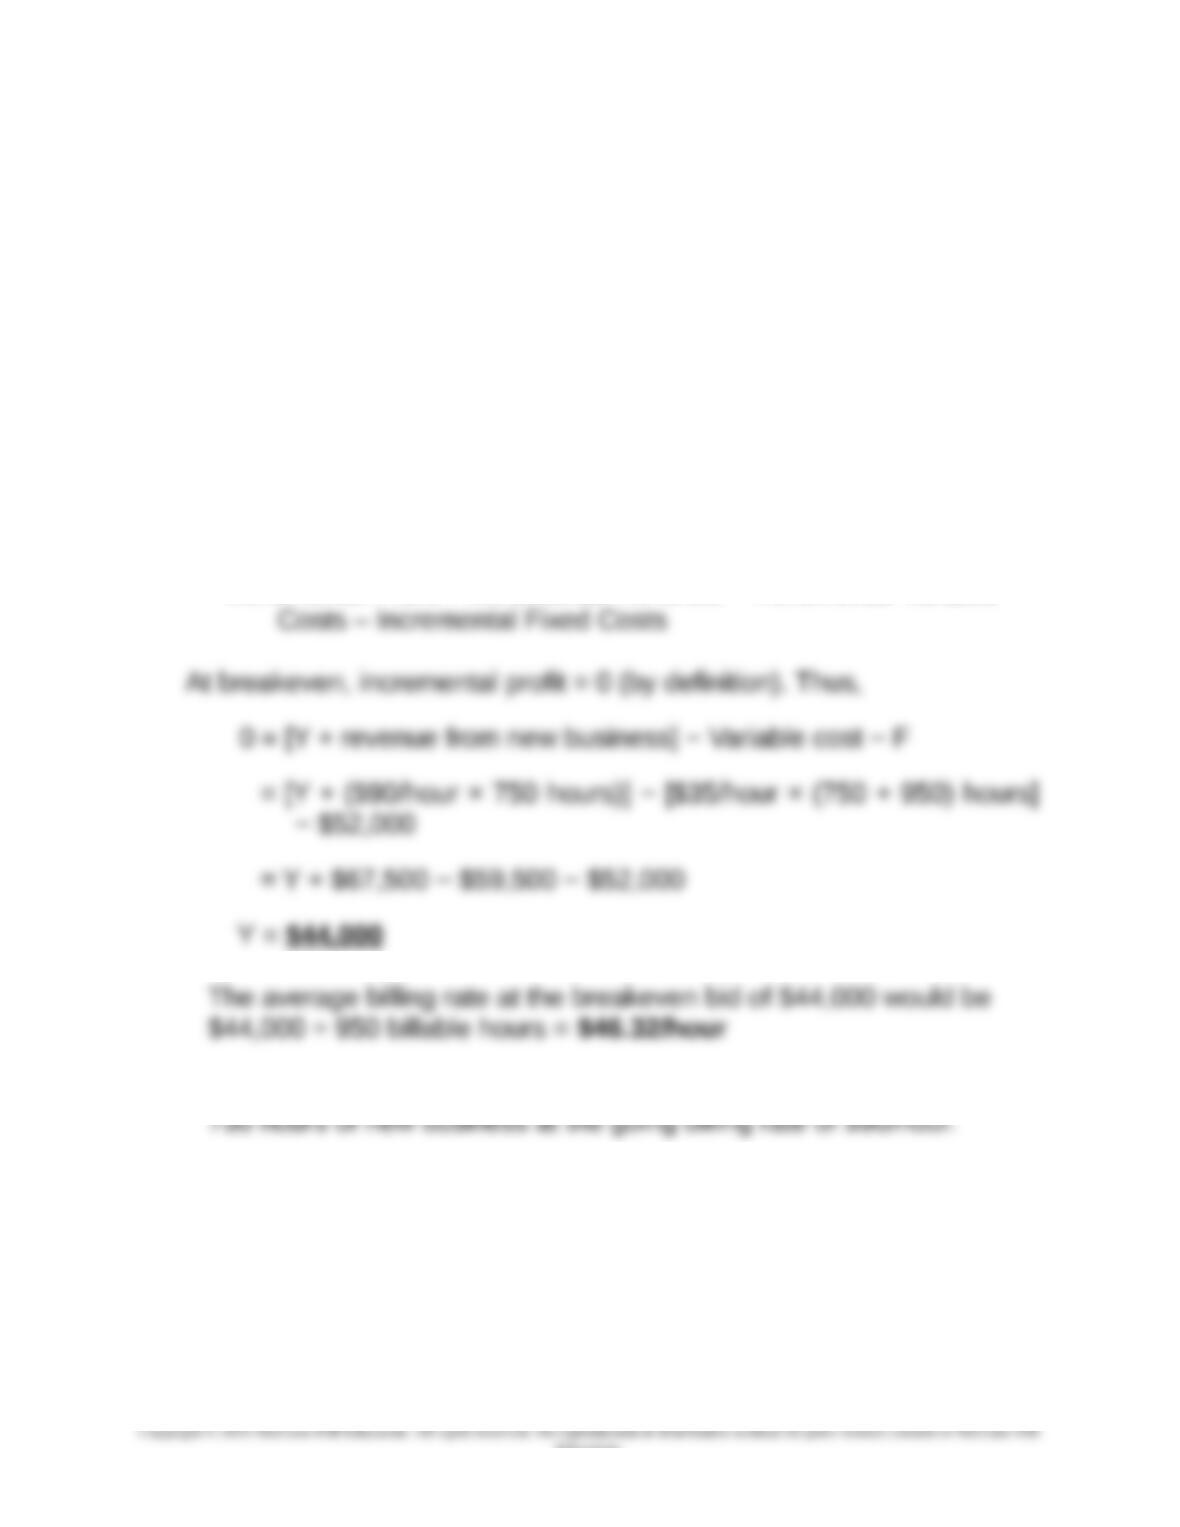
For a breakeven situation, incremental revenue (billings, both from the
county audits and from any new business) must equal incremental
costs (both variable and fixed).
Let Y = the minimum revenue that must be earned from the county
work in order to insure that operating profit of the firm does not
decrease. Thus, looking at this new business proposal in its entirety:
Incremental Profit = Incremental Revenue – Incremental Variable
Clearly, the key to the bidding strategy is the desirability of bringing in
2. At breakeven point for the total new business (county audit job +
additional new business), incremental revenue (billings) in total would
equal incremental costs (both variable and fixed).
incremental profit = incremental revenues (billings) − incremental
variable costs − incremental fixed costs
9-42
Education.
Chapter 09 – Short-Term Profit Planning: Cost-Volume-Profit (CVP) Analysis
9-41 (Continued)
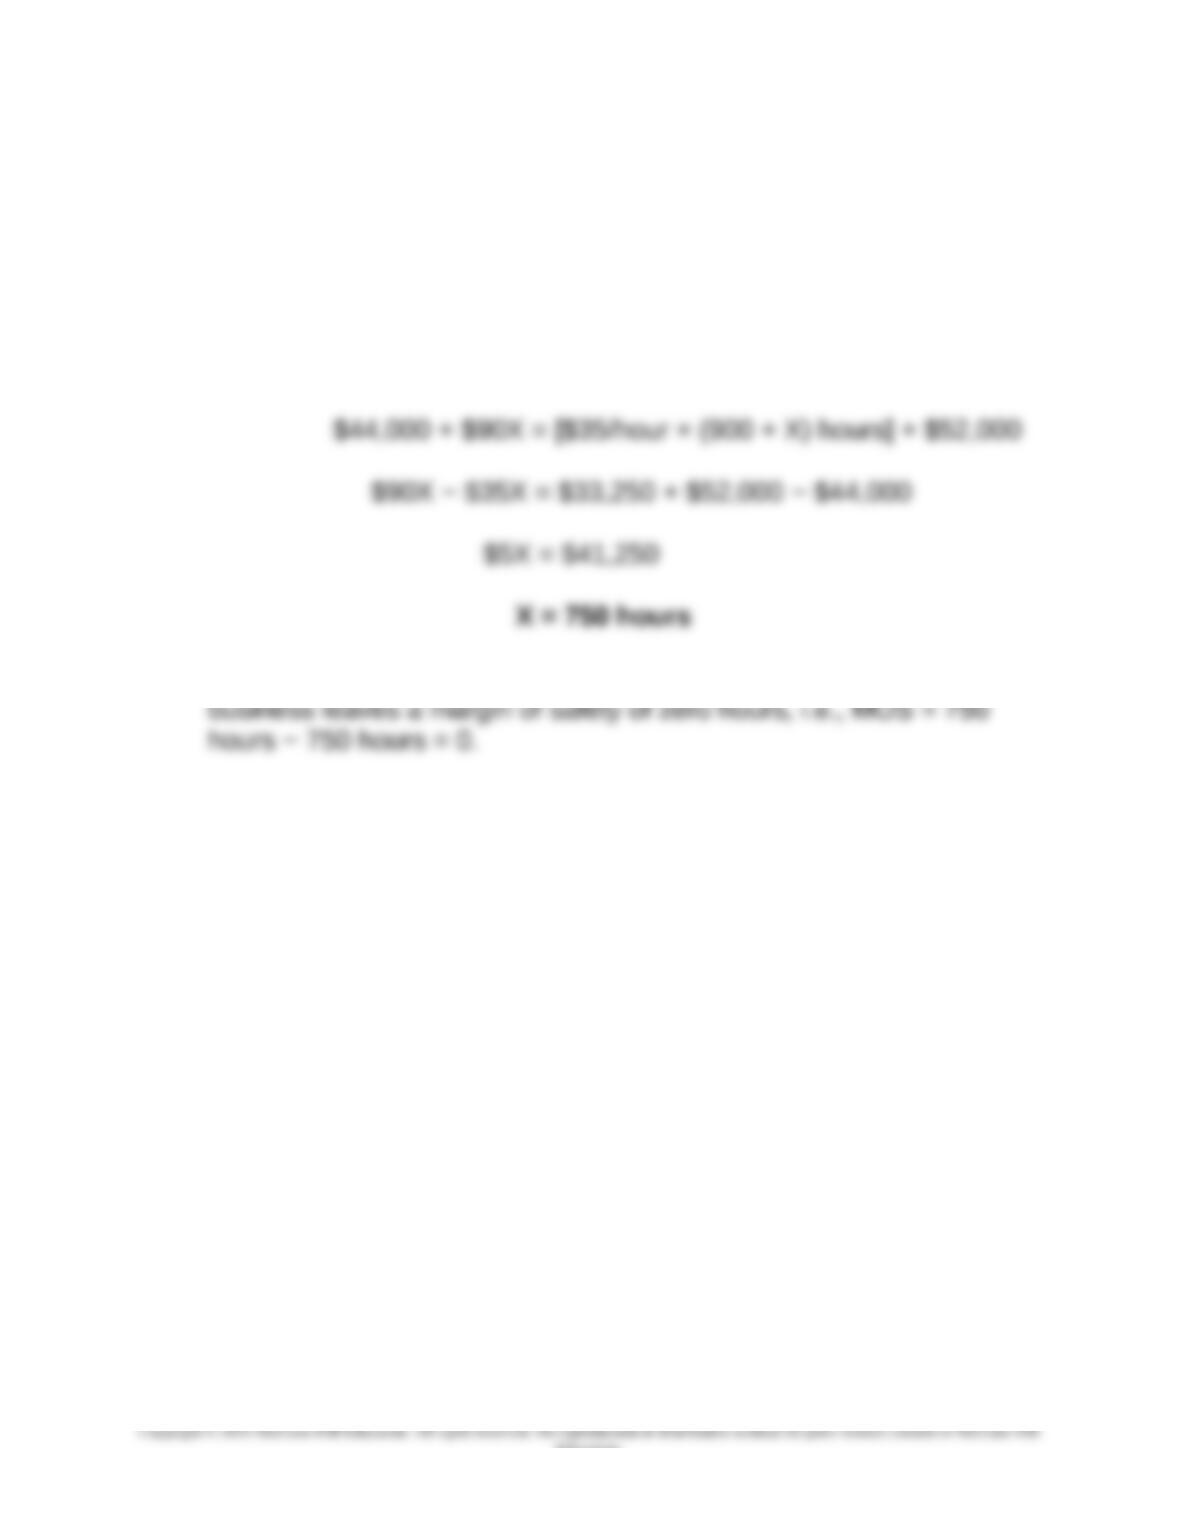
Alternatively, at breakeven:
Incremental revenues (billings) = incremental costs (variable + fixed)
Let X equal the minimum number of hours of additional new business
required to breakeven. At breakeven, we have:
Note that the managing partner’s estimate of 750 hours of new
9-43
Education.
Chapter 09 – Short-Term Profit Planning: Cost-Volume-Profit (CVP) Analysis
9-42 CVP Analysis; Sensitivity Analysis; Multiple Products (50-60 min)
1. GoGo Juice’s profit (loss) before tax from implementing the promotional
coupon with no change in sales volume and sales mix is ($6,500)
Gasoline
Food &
Beverage Other Total
Sales Revenue $100,000 $60,000 $40,000 $200,000
Coupons redeemed
(note 1)
(15,000) (15,000)
Cost of Sales (note
2)
(75,000) (36,000) =
0.6 × 60,000
(20,000) =
0.5 × 40,000
(131,000)
Contribution Margin $10,000 $24,000 $20,000 54,000
Fixed costs (note 3) 60,500
Loss before tax $(6,500)
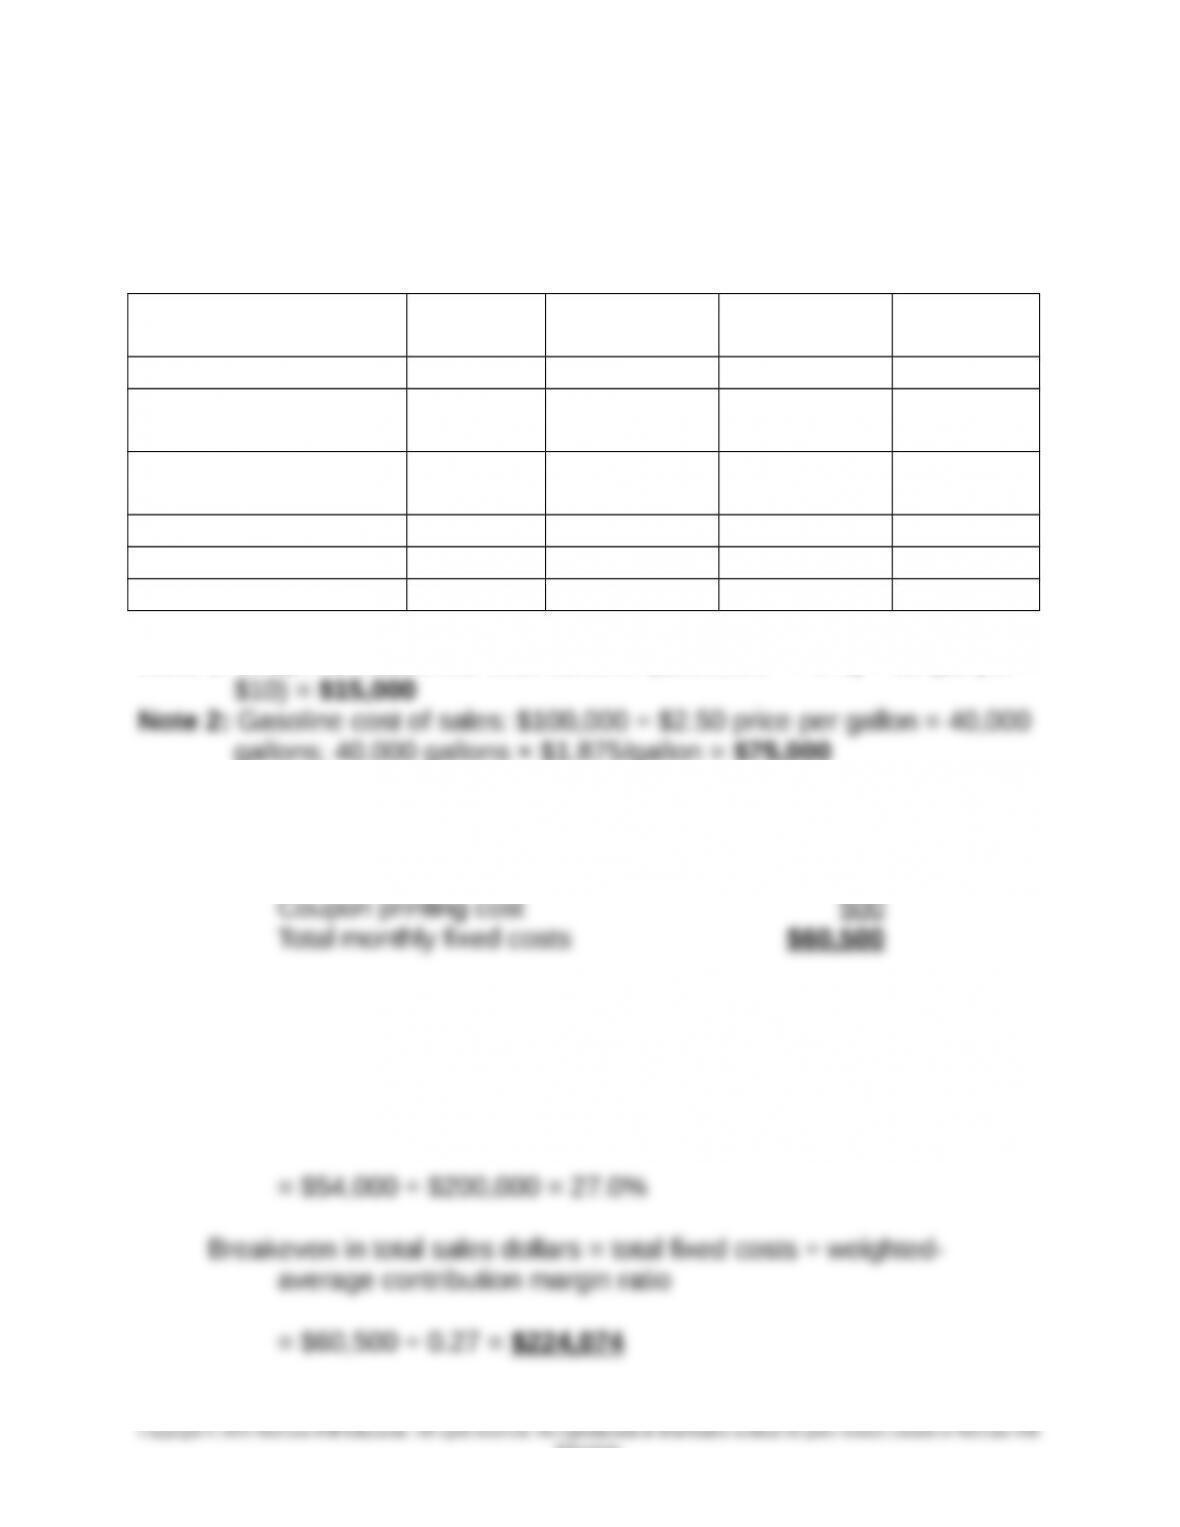
Note 1: Coupons redeemed: total sales of ($200,000 × 75%) ÷ 10 ($1 per
gallons; 40,000 gallons × $1.875/gallon = $75,000
Note 3: Fixed costs:
Labor ($10,000 + $2,500) $12,500
Rent, power, supplies, etc. 40,000
Depreciation 7,500
2. The breakeven point in sales dollars for GoGo, based on the weighted-
average contribution margin ratio (CMR) approach:
Weighted-average contribution margin ratio = total contribution
margin ÷ total sales dollars
9-44
Education.
Chapter 09 – Short-Term Profit Planning: Cost-Volume-Profit (CVP) Analysis
9-42 (continued-1)
3. Allocation of total breakeven sales dollars across the three product lines
(based on sales mix determined on the basis of relative sales dollars, not
units, of the three products):
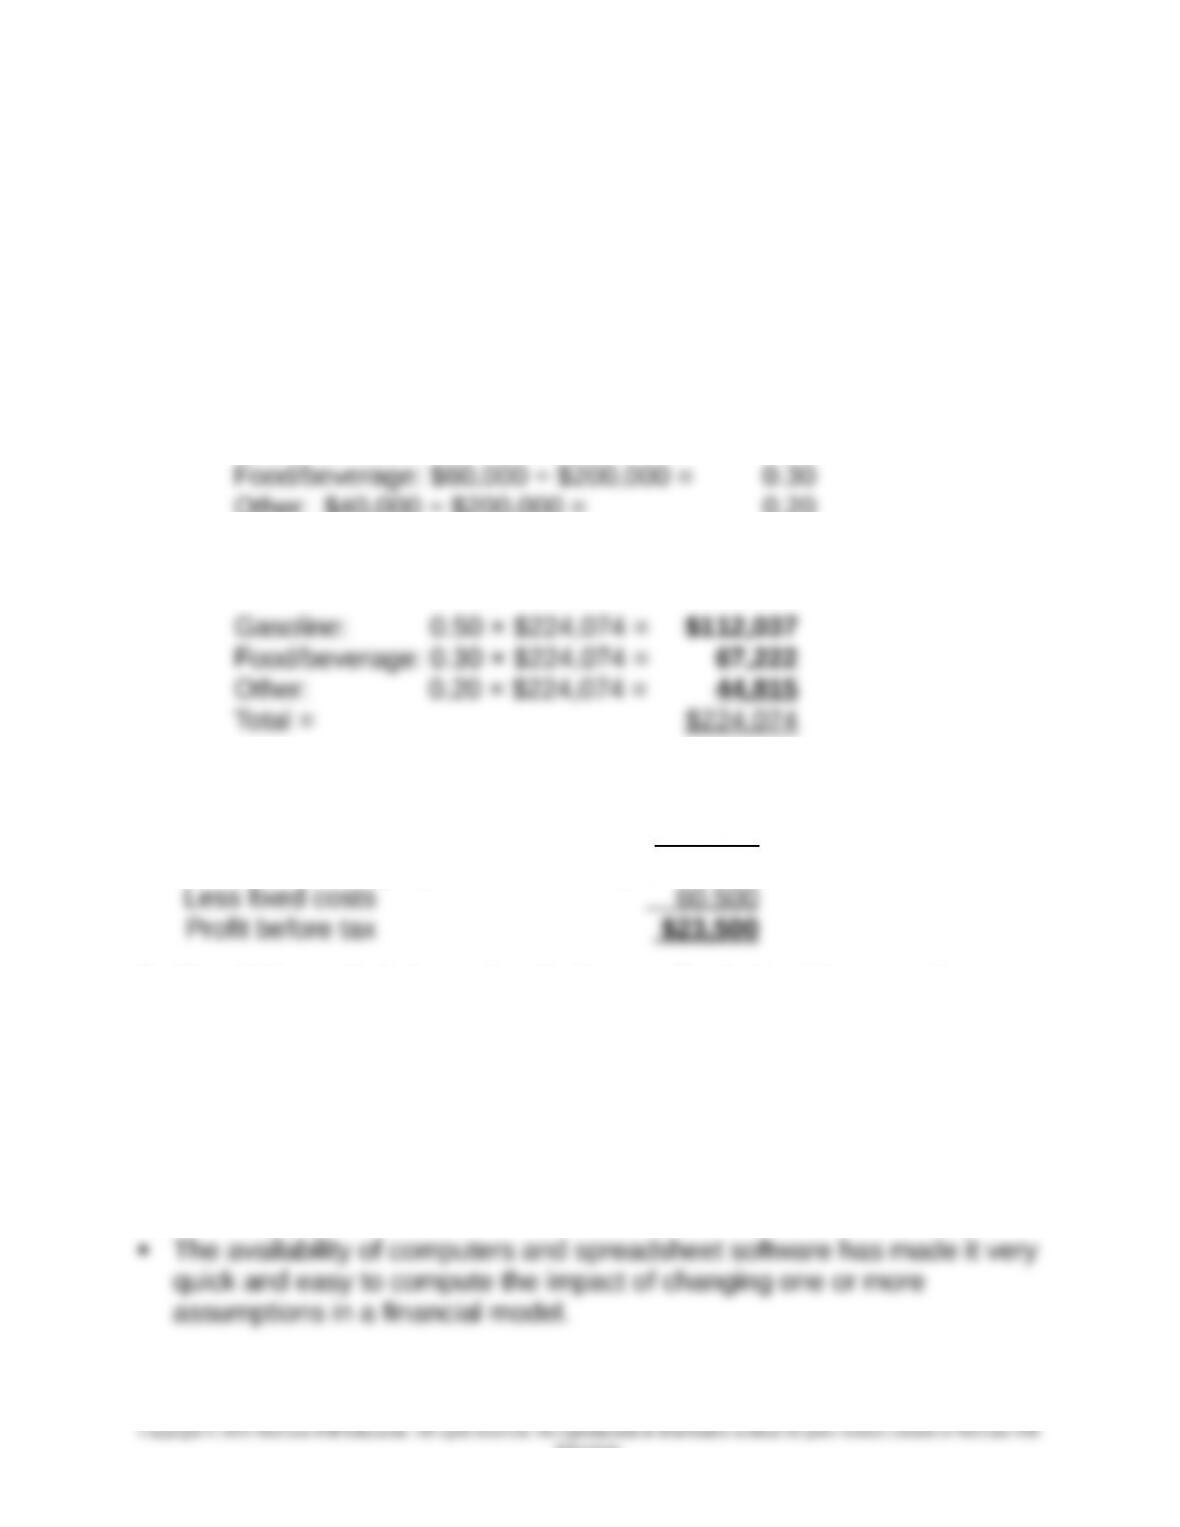
Total breakeven sales dollars (#2 above) = $224,074
Sales mix percentages, based on relative sales dollars:
Gasoline: $100,000 ÷ $200,000 = 0.50
Other: $40,000 ÷ $200,000 = 0.20
Breakdown of total breakeven sales dollars ($224,074):
4.
Sales revenue ($200,000 × 1.2) $240,000
Variable costs (sales − CM) 156,000
Contribution margin ($240,000 × 35%) 84,000
5. Sensitivity analysis is used to deal more effectively with uncertainty or
risk. Sensitivity analysis is a “what-if’ type of analysis used to determine the
outcomes if any parameters change from the initial assumptions. For
example, revenues or costs could be changed from the initial assumptions
and a new break-even sales volume calculated.
At least three factors that make sensitivity analysis prevalent in decision-
making today include the following:
9-45
Education.
Chapter 09 – Short-Term Profit Planning: Cost-Volume-Profit (CVP) Analysis
9-42 (Continued-2)
As the business environment is becoming more dynamic and
competitive, sensitivity analysis provides management with an
understanding of the impact of changes in the environment. The
Sensitivity analysis aids management in identifying the key variables
6. As discussed in the chapter, the following methods that can be used to
address uncertainty in the profit-planning process:
Conventional measures associated with CVP analysis:
oDegree of operating leverage (DOL)
oMargin of safety (MOS) and margin of safety ratio (MOS%)
Sensitivity analysis:
oSimple “what-if” analysis/analyses
9-46
Education.
Chapter 09 – Short-Term Profit Planning: Cost-Volume-Profit (CVP) Analysis
9-43 CVP Analysis; Commissions; Ethics (50 min)
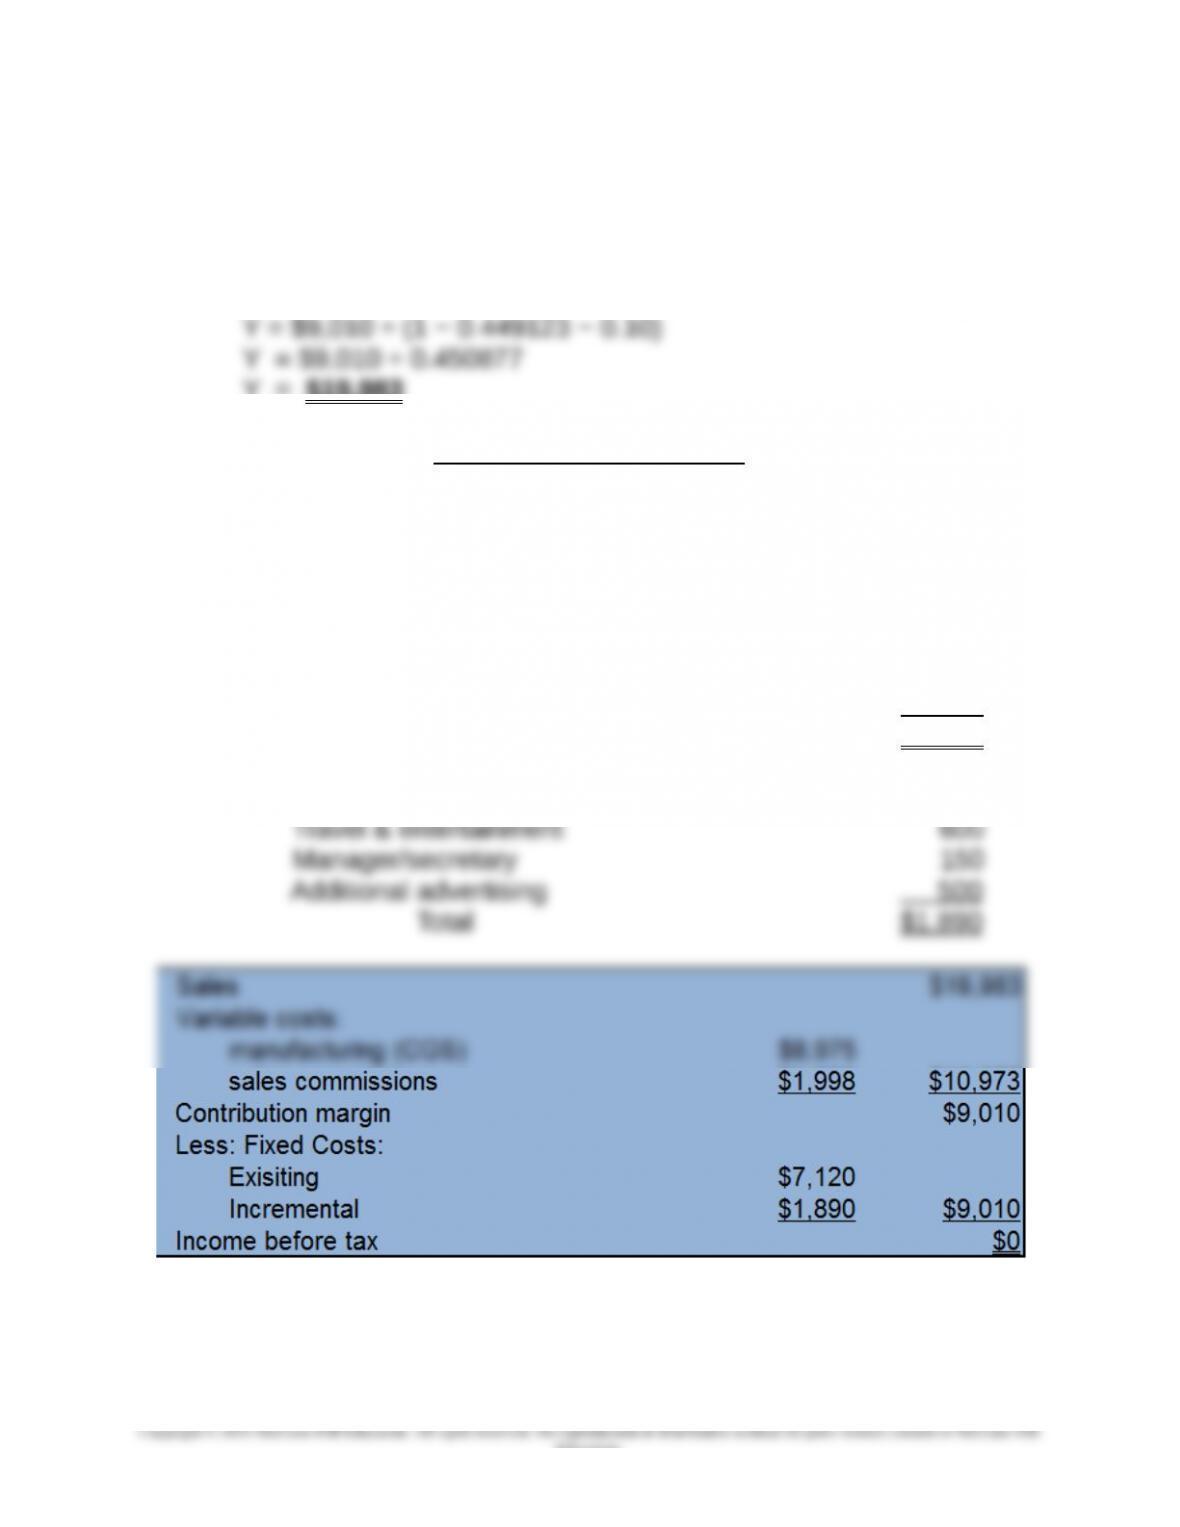
1. Breakeven dollars (dollars in thousands), Y:
Y = total fixed costs ÷ contribution margin ratio
Y = ($7,120 + $1,890) ÷ (1 − VCGS rate − commissions rate)
Y = $19,983
Supporting Calculations
Variable cost of goods sold (VCGS) rate (dollars in thousands):
$12,800 ÷ $28,500 = 44.9123%
Current fixed costs ($ thousands):
Fixed cost of goods sold $3,500
Fixed advertising cost 770
Fixed administrative cost 2,150
Fixed interest expense 700
Total $7,120
Incremental fixed costs ($ thousands):
Sales people (8 × $80) $ 640
9-47
Education.
Chapter 09 – Short-Term Profit Planning: Cost-Volume-Profit (CVP) Analysis
9-43(Continued-1)
2. Required sales (to maintain current level of pre-tax income, $3,450,
while paying the requested increase in commission):
Let Y = required sales level:
$3,450 = Total sales − total variable costs − total fixed costs
$3,450 = Y − (0.449123Y + 0.23Y) − $7,120
3. The general assumptions underlying breakeven analysis that may limit
its usefulness include the following:
All costs can be divided into fixed and variable elements.
Variable costs vary proportionally to volume (thus, the variable cost
function is linear)—there are no efficiency changes as output
changes
certainty
4. Let sales (in 000s) at the indifference point be Y.
Since the two decision alternatives do not affect the selling price per
unit, we can define the indifference point as the volume level that
results in equal total cost between the two decision alternatives:
9-48
Education.
Chapter 09 – Short-Term Profit Planning: Cost-Volume-Profit (CVP) Analysis
9-43 (Continued-2)
Cost Under Alternative #1 = Cost Under Alternative #2
0.4491Y + 0.23Y + $7,120 = 0.4491Y + $7,120 + $1,890 + 0.10Y
5. Alan Chen should consider the firm’s ethical responsibility to its
shareholders, employees and agents. The new plan would be a
savings for the firm and thus would have an upward effect on stock
price and thus benefit the shareholders. However, the plan would be
a blow to the sales agents, many of whom may be depend on Lionel
Corporation for a significant portion (or perhaps all of) their income.
9-49
Education.