Chapter 09 – Short-Term Profit Planning: Cost-Volume-Profit (CVP) Analysis
9-37 (Continued-1)
4. BE units = F ÷ contribution margin per unit
= ($500,000 + $160,000) ÷ ($80.00 − $41.50)/unit
= $660,000 ÷ $38.50/unit = 17,143 units
πB= Sales − variable costs − fixed costs
= [Q × (unit contribution margin)] − F
5. A key strategic issue is that Hank’s sales staff is a critical success
factor for the business, especially in the growing and competitive
environment of Hank’s business. His knowledgeable and courteous
staff help to bring in and retain customers. If the salary/commissions
plan would alienate his sales staff, the plan could be a big mistake.
Finally, there is the issue of operating risk associated with moving to
a cost structure characterized by relatively higher fixed costs (traded-
off against lower variable costs).
Possible benefits:
oIf variable costs (such as variable labor costs) are high, this
9-30
Education.
Chapter 09 – Short-Term Profit Planning: Cost-Volume-Profit (CVP) Analysis
9-37 (Continued-2)
Possible costs/disadvantages:
oIncreased operating (business) risk (e.g., generally
speaking, there will be a higher breakeven point)
oIf sales volume recedes, these reductions are magnified in
costs can dramatically increase operating risk.
oIncreased fixed costs (e.g., those associated with insourcing)
may expose the company to increased risk or exposure to
production slow-downs or stoppages, as experienced in
2011 in Japan as a consequence of the earthquake/tsunami
that hit the country).
There are two additional points worth making:
1. Ultimately, the decision to increase operating leverage is affected
by some of the following considerations: year-to-year fluctuations in
sales—that is, uncertainty (the greater the uncertainty, the greater the
attractiveness of lower operating leverage, due to the increased
2. Without knowing the future, it is impossible to specify which of the
two strategies (cost structures) is more desirable.
9-31
Chapter 09 – Short-Term Profit Planning: Cost-Volume-Profit (CVP) Analysis
9-38 Profit Planning: Multiple Products (50-60 min)
1. Break-even in units: weighted-average contribution margin approach
a. Overall breakeven point = F ÷ weighted-average contribution
margin/unit
Weighted-average unit contribution per unit
b. Breakdown of breakeven units:
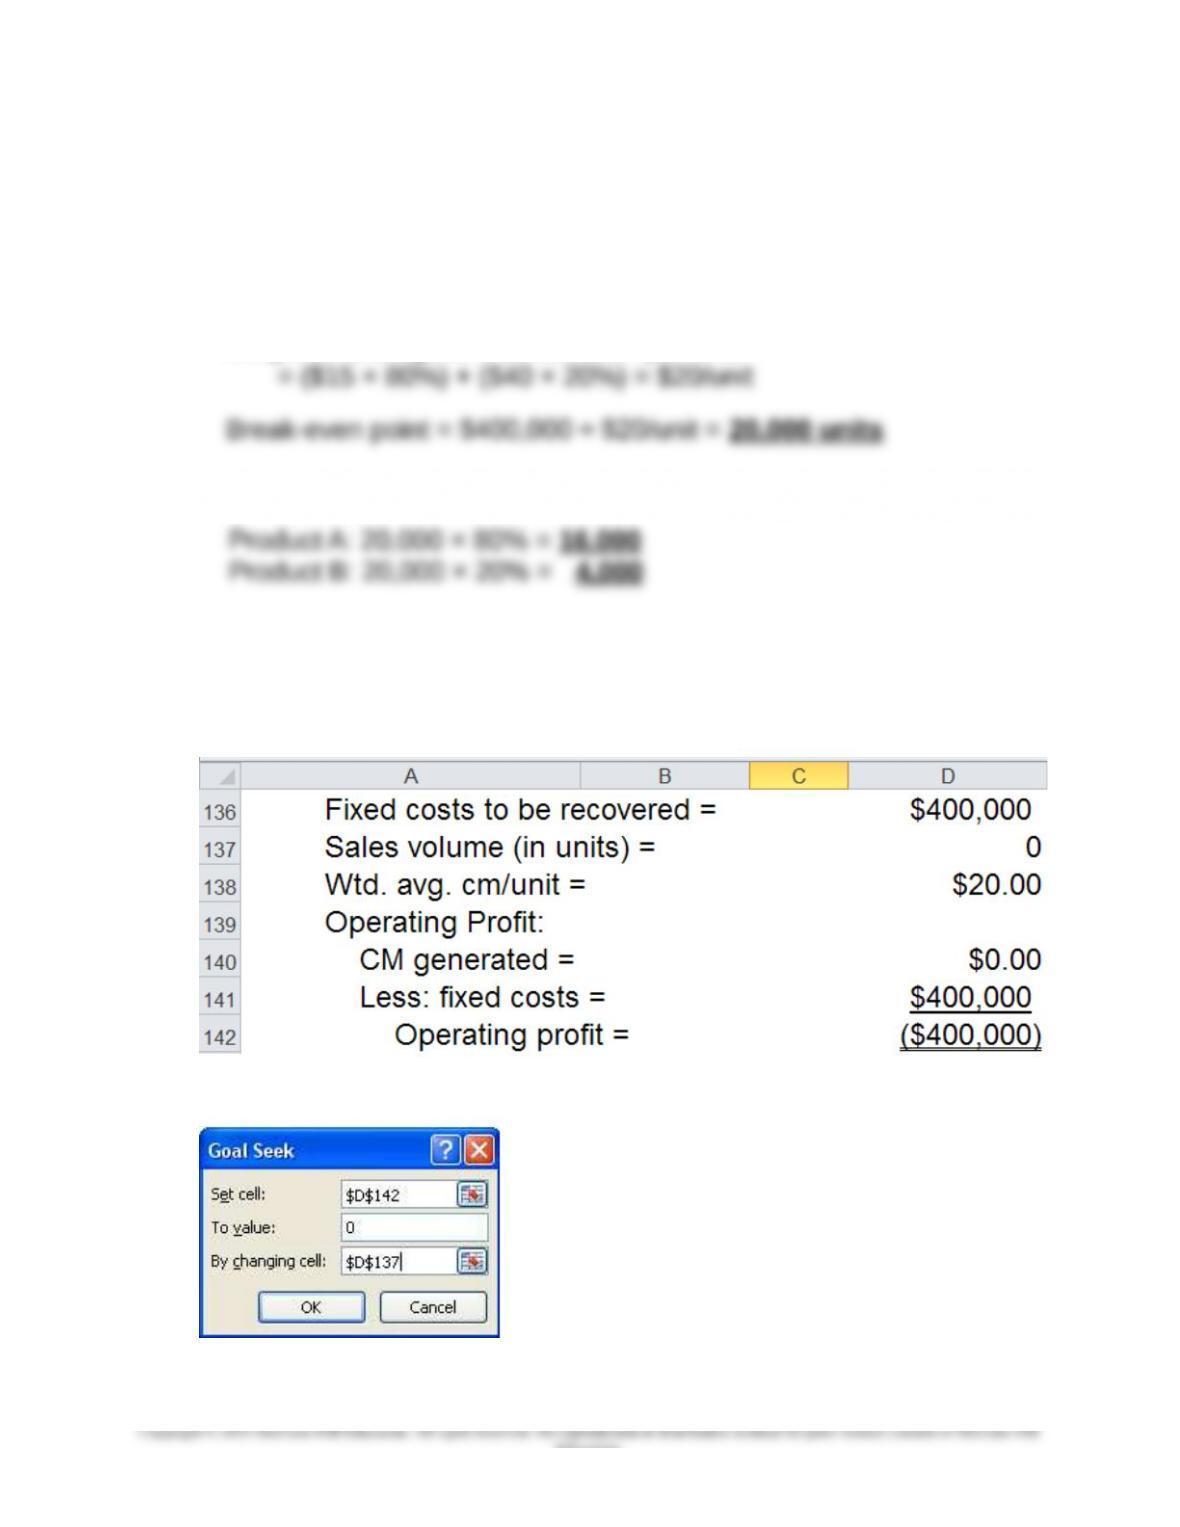
2. Use Goal Seek (in Excel) to calculate the breakeven point, in terms of
total units:
Step One: Set Up the Equation for Operating Income
Step Two: Run Goal Seek
9-32
Education.
Chapter 09 – Short-Term Profit Planning: Cost-Volume-Profit (CVP) Analysis
9-38 (Continued-1)
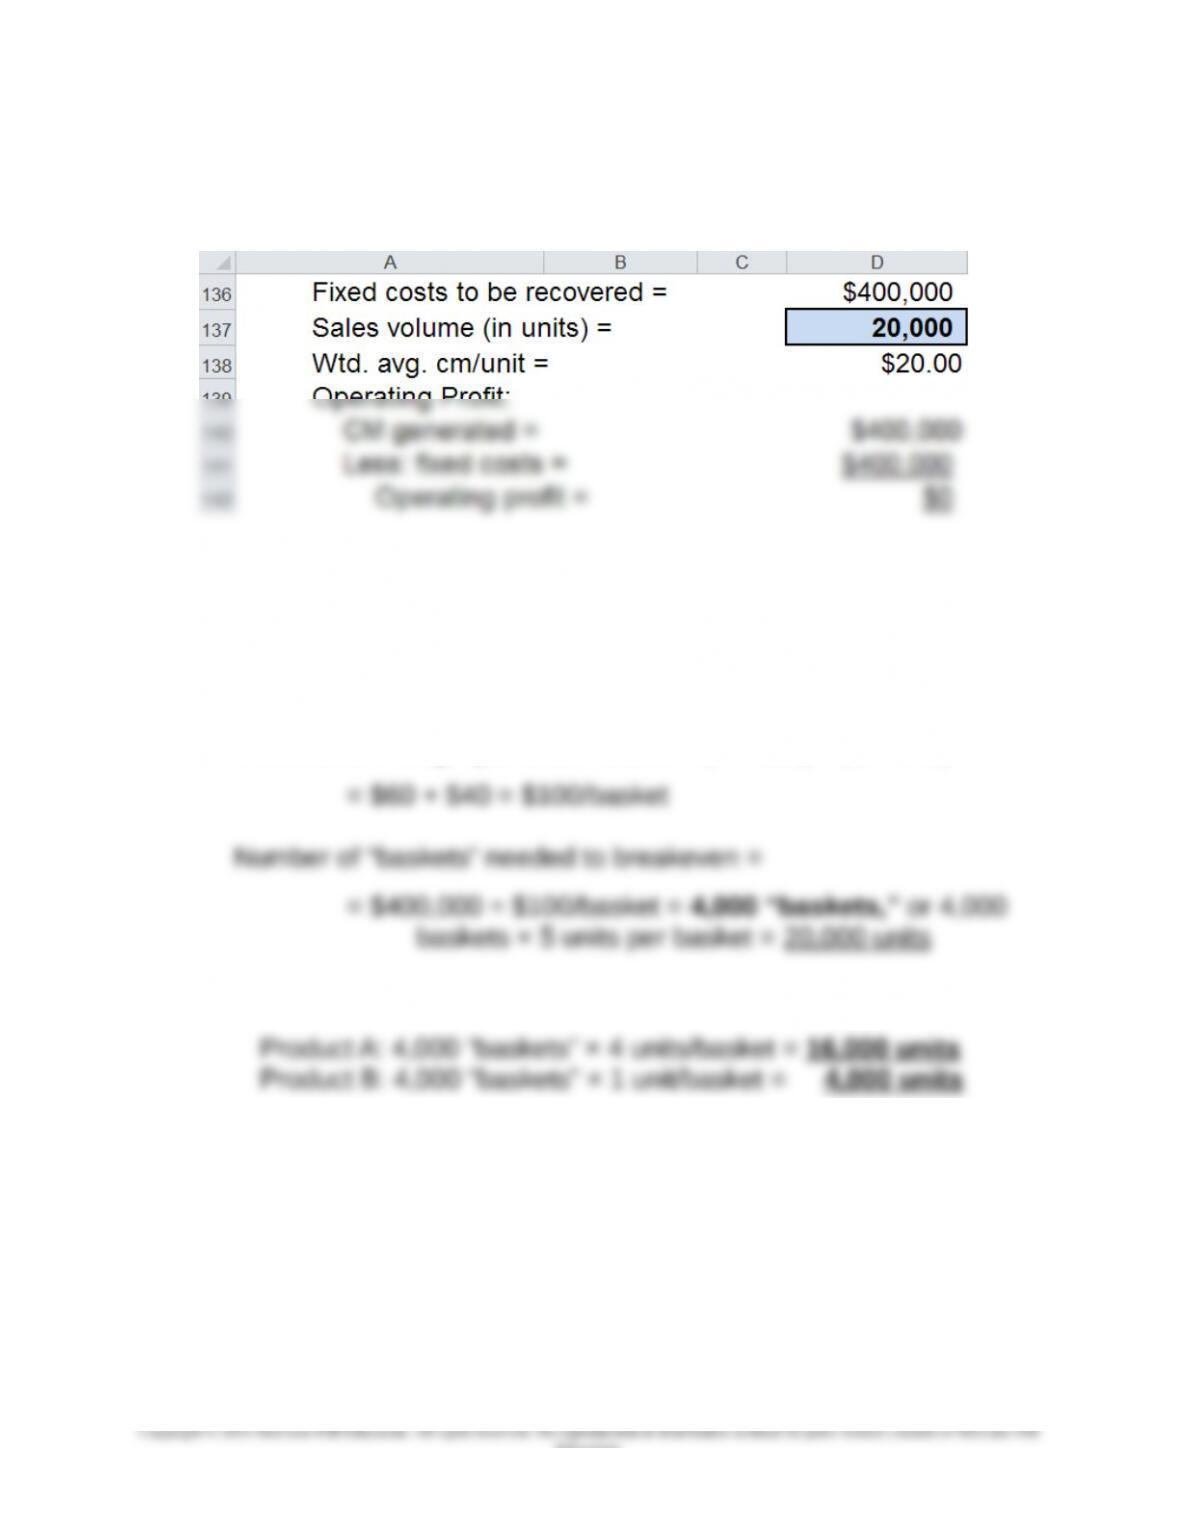
Step Three: Results (after running Goal Seek)
3. Breakeven point in units: “Sales basket” approach (assume that each
basket consists of 4 units of Product A and 1 unit of Product B).
a. Overall breakeven point (in baskets) = F ÷ contribution
margin/basket
Contribution margin per sales basket = (4 × $15) + (1 × $40)
b. Breakdown of breakeven units:
4. Distribution of breakeven point in terms of sales dollars (based on
weighted-average contribution margin ratio, where the individual
product weights are based on relative sales dollars, not physical unit,
of each product in the standard sales mix).
a. Breakeven ($) = F ÷ weighted-average cm ratio
Relative sales dollars (not units), based on standard sales mix:
9-33
Education.
Chapter 09 – Short-Term Profit Planning: Cost-Volume-Profit (CVP) Analysis
Problem 9-38 (Continued-2)
Product A: 18,000 units × $80/unit = $1,440,000
Product B: 4,500 units × $140/unit = $630,000
Weights:
Product A: $1,440,000 ÷ $2,070,000 = 0.6956522
Weighted-average contribution margin ratio:
A: 0.69565 × ($15/$80) = 0.6956522 × 0.1875 = 0.13043479
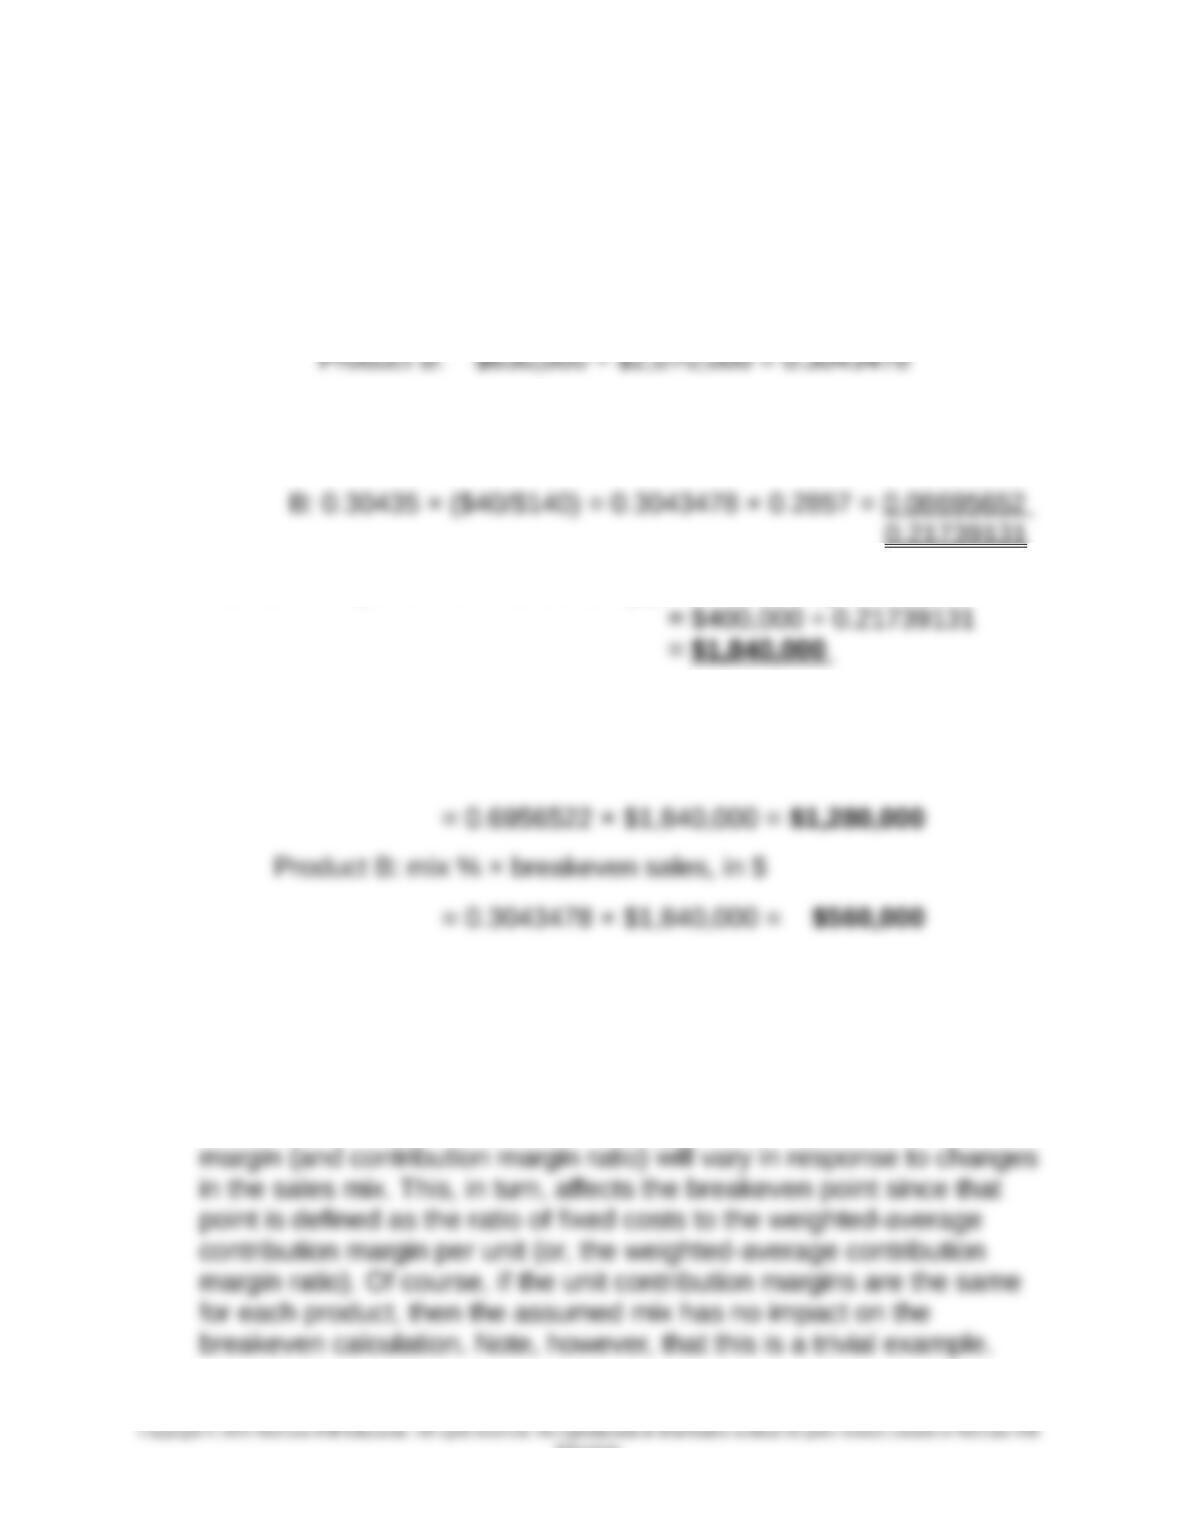
Breakeven point in overall dollars ($) = F ÷ wtd. avg. cm ratio
b. breakdown of total breakeven sales dollars, by product:
Product A: mix % × breakeven sales, in $
5. For the multiproduct firm, there is no breakeven point independent of
the sales mix assumption. For the multiproduct firm, we typically
assume that the outputs are sold in some standard mix, based either
on relative physical units or relative sales dollars. If the individual
products differ in terms of their contribution margin per unit (or
contribution margin ratio), then the weighted-average contribution
9-34
Education.
Chapter 09 – Short-Term Profit Planning: Cost-Volume-Profit (CVP) Analysis
Problem 9-38 (Continued-3)
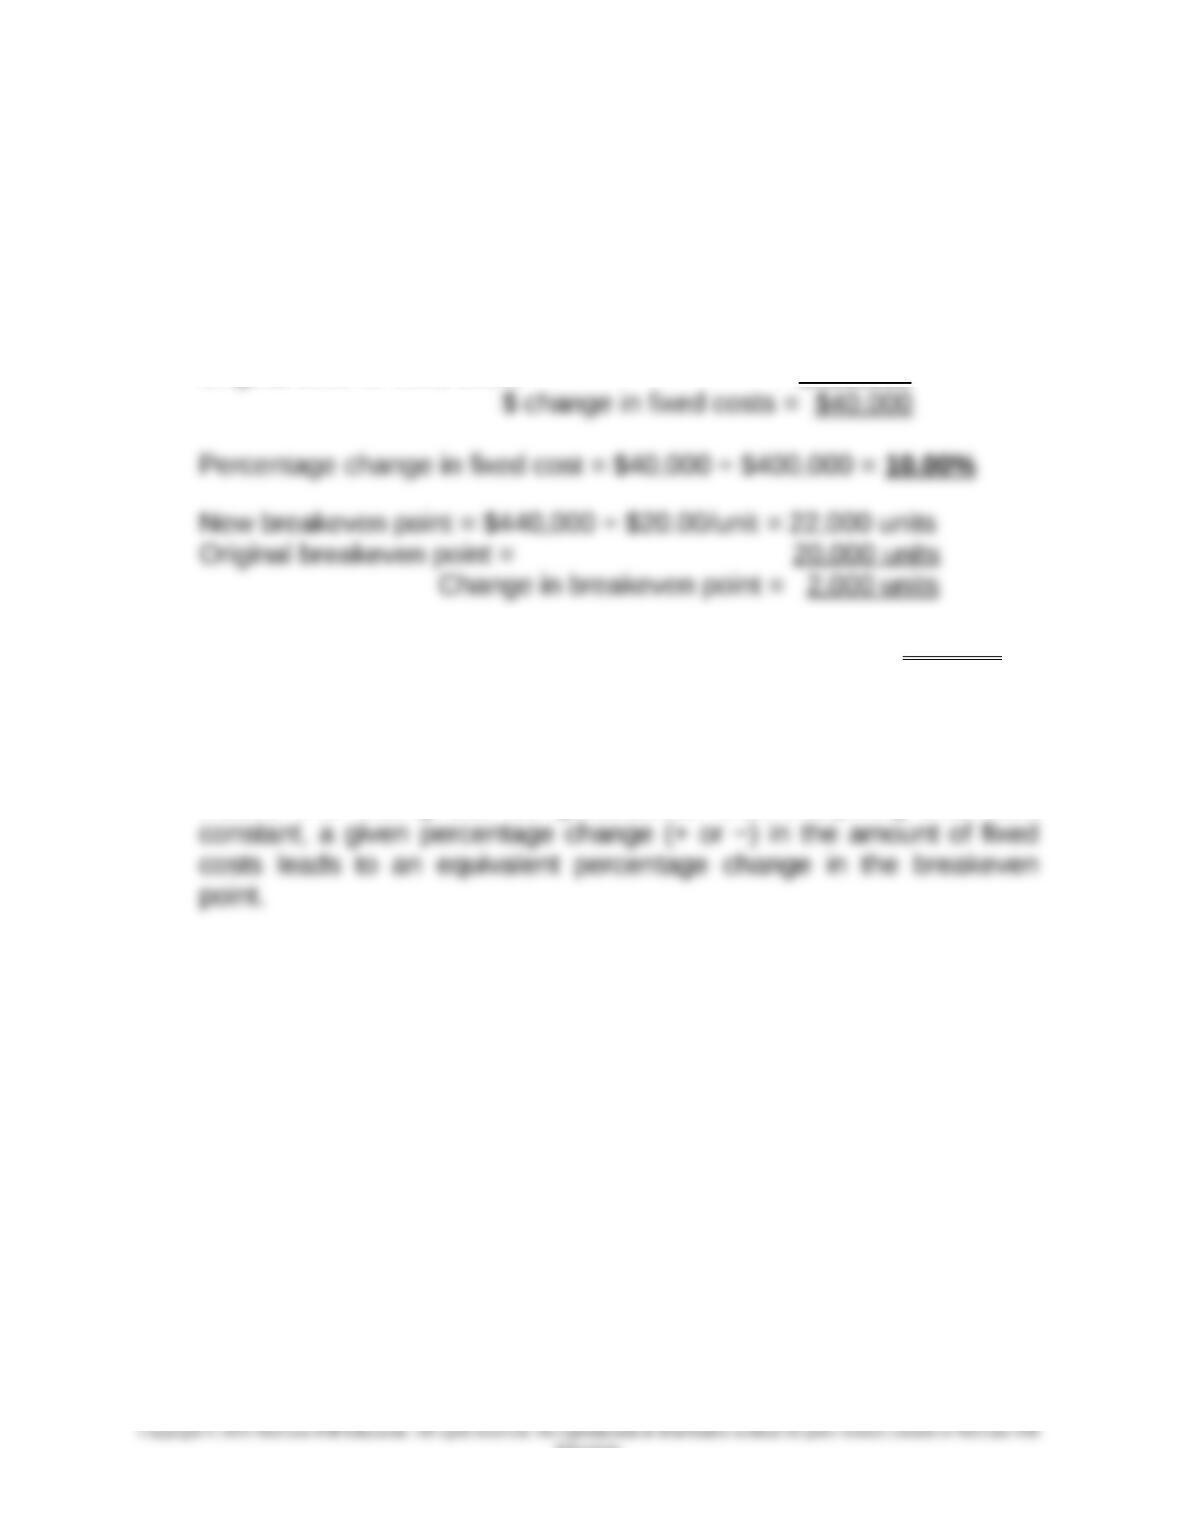
6. Change in the breakeven point (in total units) in response to a 10%
change in fixed costs:
New level of fixed costs = $400,000 + $40,000 = $440,000
Original level of fixed costs = $400,000
Percentage change in breakeven point = 2,000 ÷ 20,000 = 10.00%
As seen from the above, the percentage change in fixed cost (here
10%) led to an identical percentage change in the breakeven point.
Because of the linear cost functions assumed in a conventional CVP
model, this finding can be generalized: with everything else held
9-35
Education.
Chapter 09 – Short-Term Profit Planning: Cost-Volume-Profit (CVP) Analysis
9-39 CVP Analysis/Profit Planning (45-60 min)
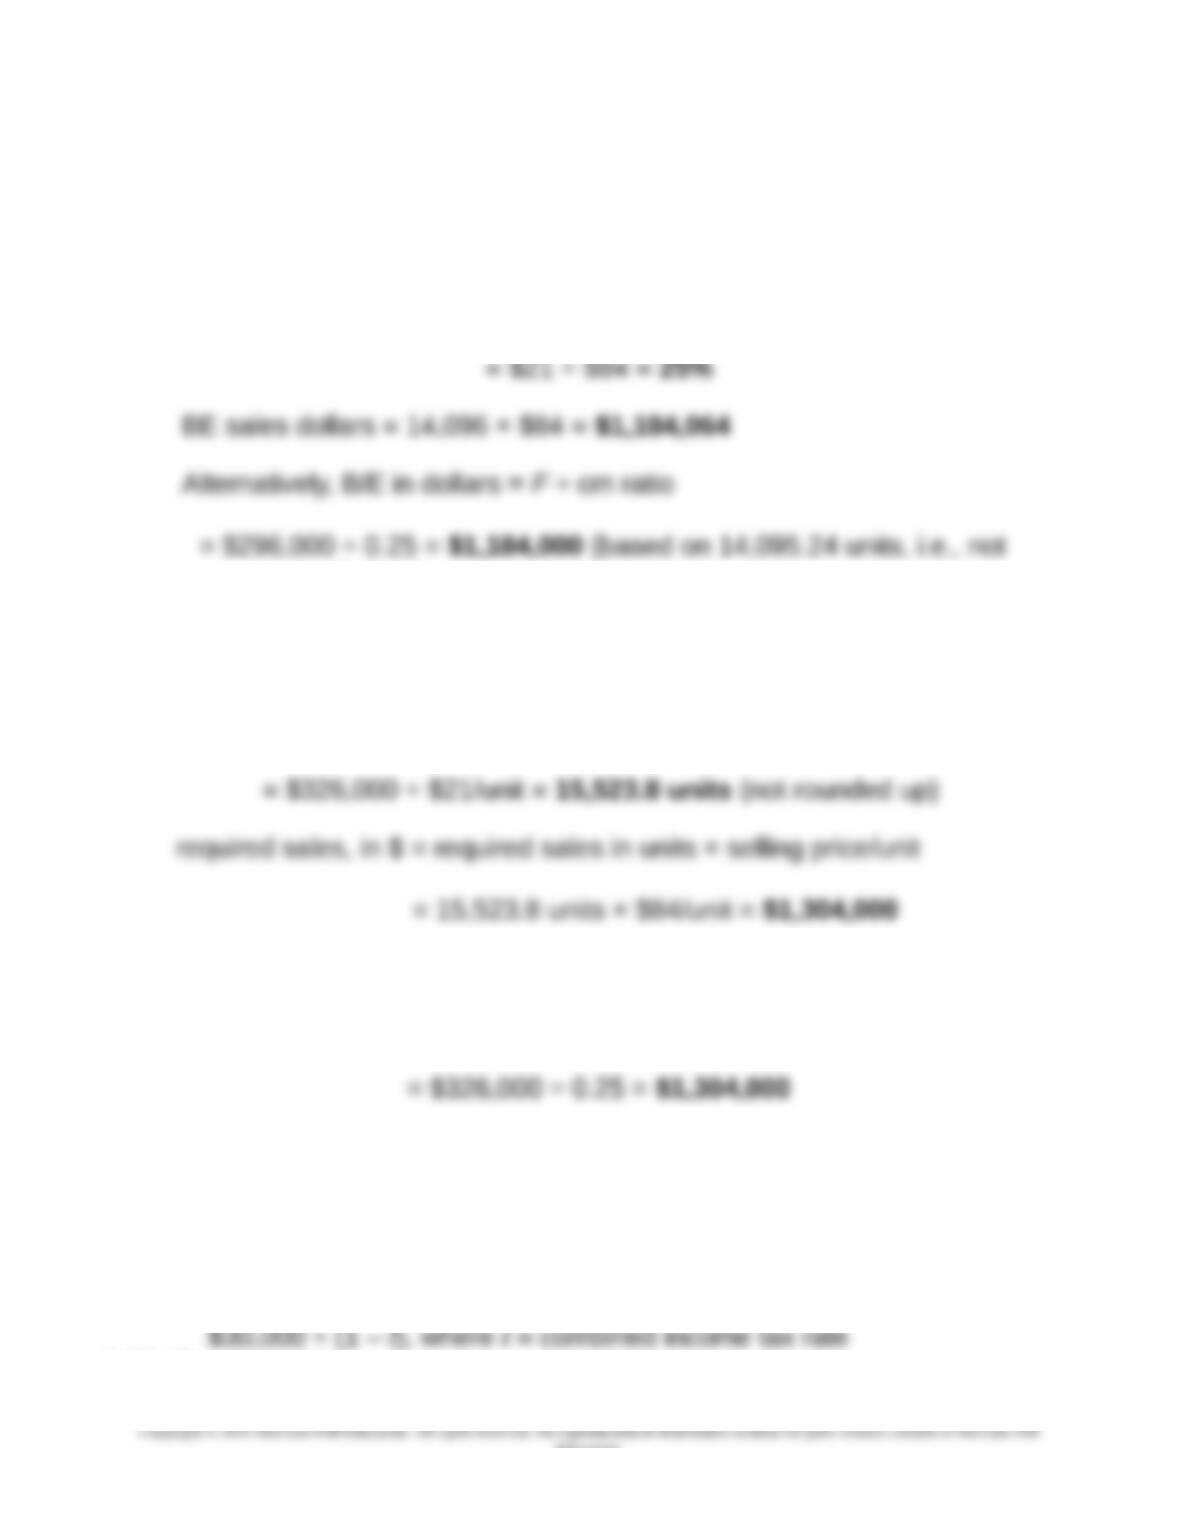
1. BE in units = F ÷ (p − v) = $296,000 ÷ ($84 − $63)/unit = 14,095.24
units (14,096 rounded up)
Contribution margin ratio = (p – v) ÷ p
rounded up)
2. Required sales, in units and in dollars, to achieve pre-tax profit goal of
$30,000:
# units = (F + πB) ÷ cm per unit = ($296,000 + $30,000) ÷ $21/unit
OR,
Required sales in $ = (F + πB) ÷ cm ratio
3. Required sales to achieve after-tax profit goal:
After-tax profit goal = $30,000
Conversion of after-tax profit goal into pre-tax dollar equivalent:
$30,000 ÷ (1 – t), where t = combined income tax rate
9-39 (Continued-1)
9-36
Education.
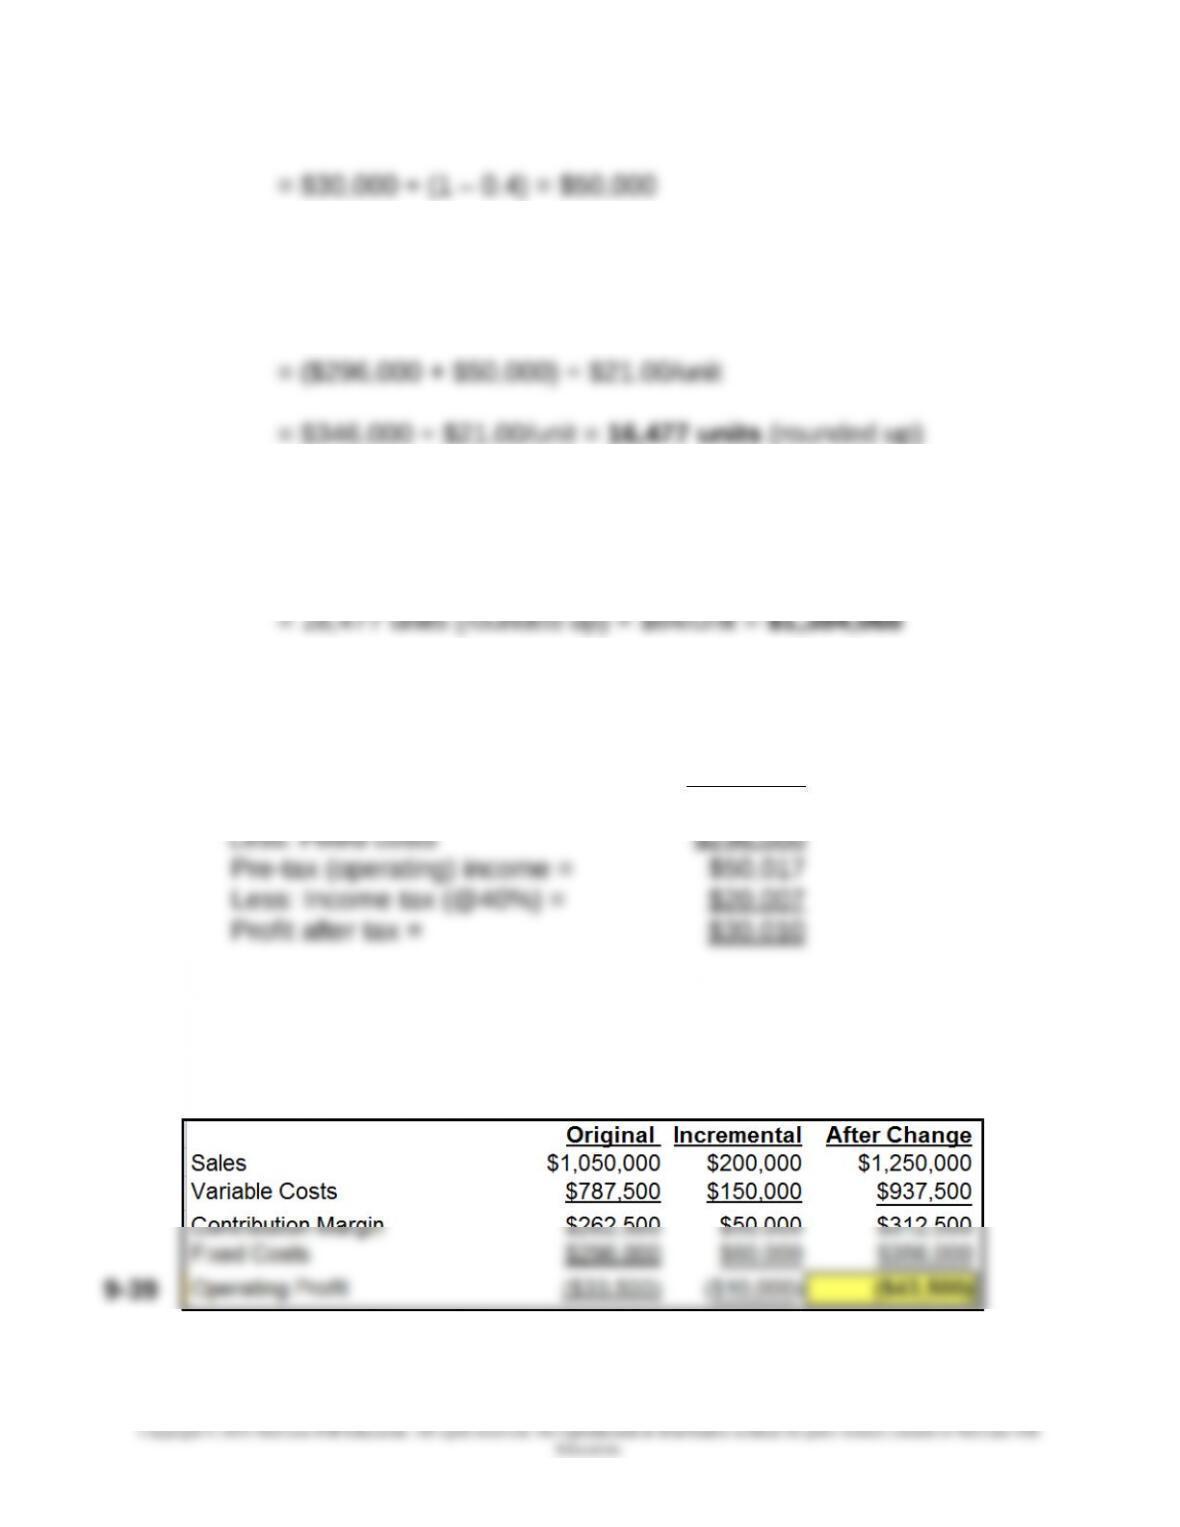
Chapter 09 – Short-Term Profit Planning: Cost-Volume-Profit (CVP) Analysis
Required sales (in units) to achieve after-tax profit target
= (F + targeted pre-tax profit) ÷ cm per unit
Required sales, in $, to achieve after-tax profit target
= required sales volume, in units × selling price/unit
4. Contribution income statement:
Sales (16,477 units × $84/unit) = $1,384,068
Less: Variable cost (@ $63/unit) = 1,038,051
Contribution margin (@ $21/unit) = $346,017
Note: Difference of $10 is due to rounding up in terms of the required
sales volume in units.
5. Profits will decrease by $10,000, from ($33,500) to ($43,500)
(Continued-2)
9-37
Chapter 09 – Short-Term Profit Planning: Cost-Volume-Profit (CVP) Analysis
Or,
= Increase in CM – Increase in Fixed Costs
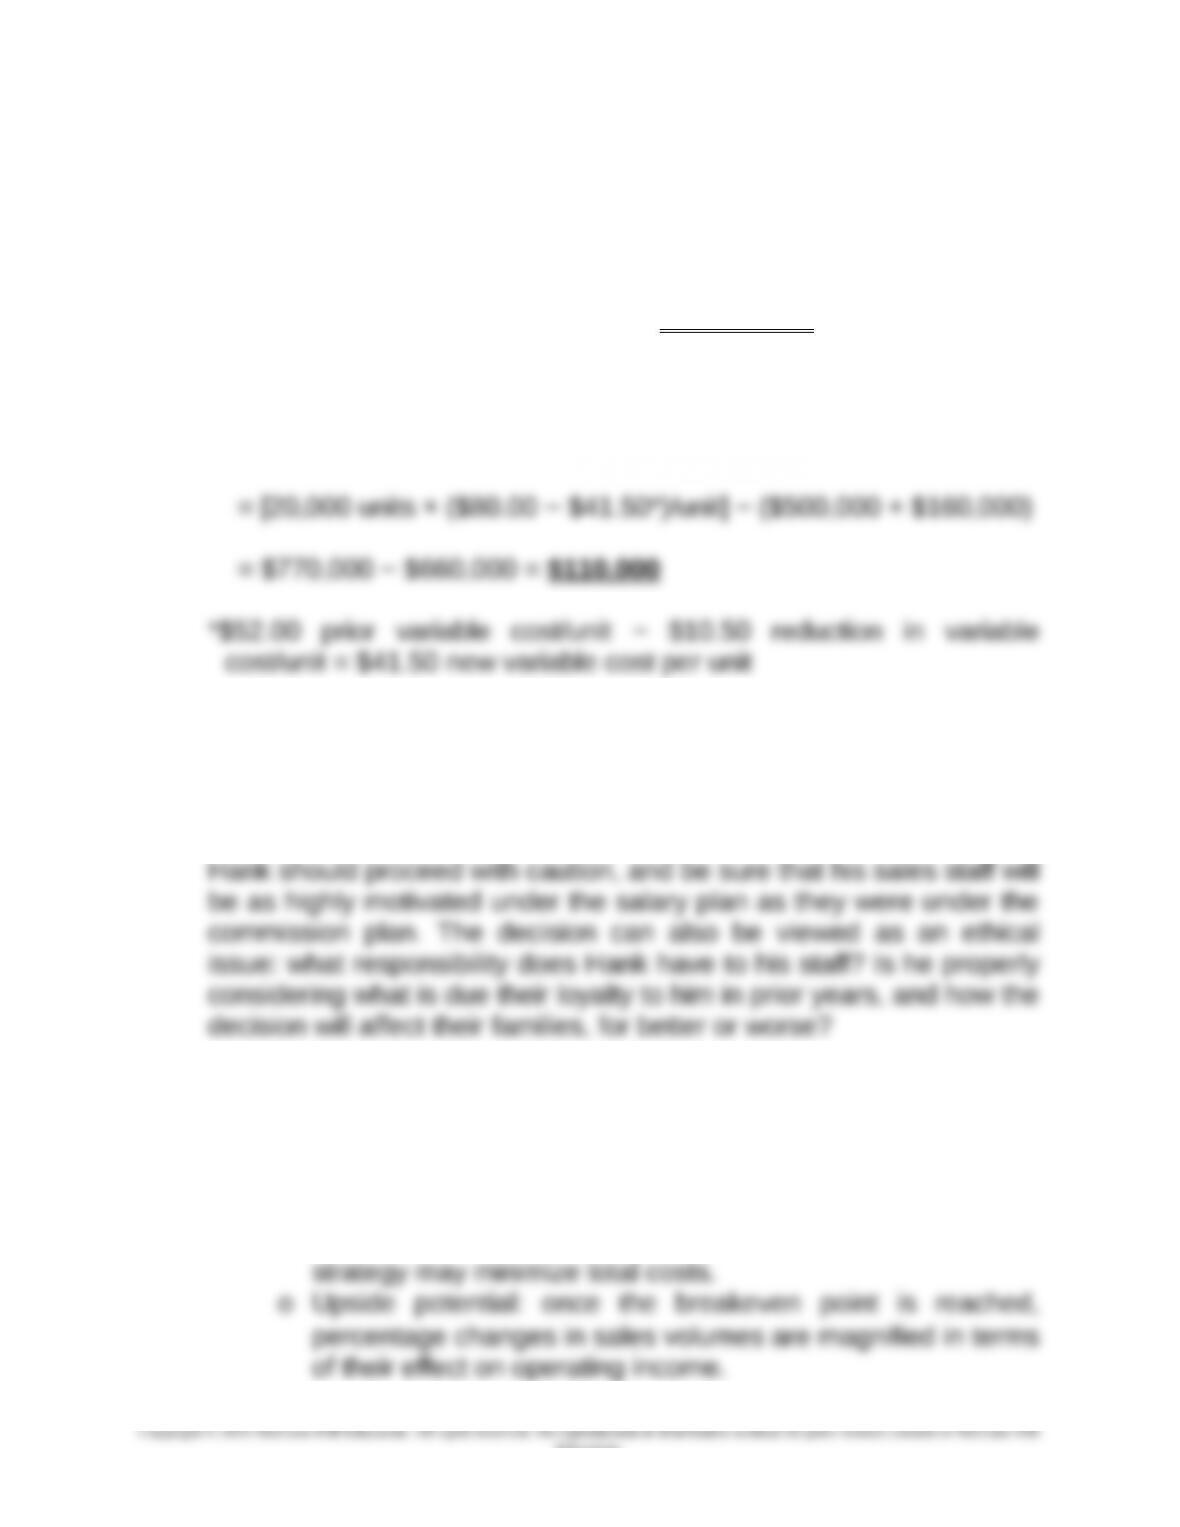
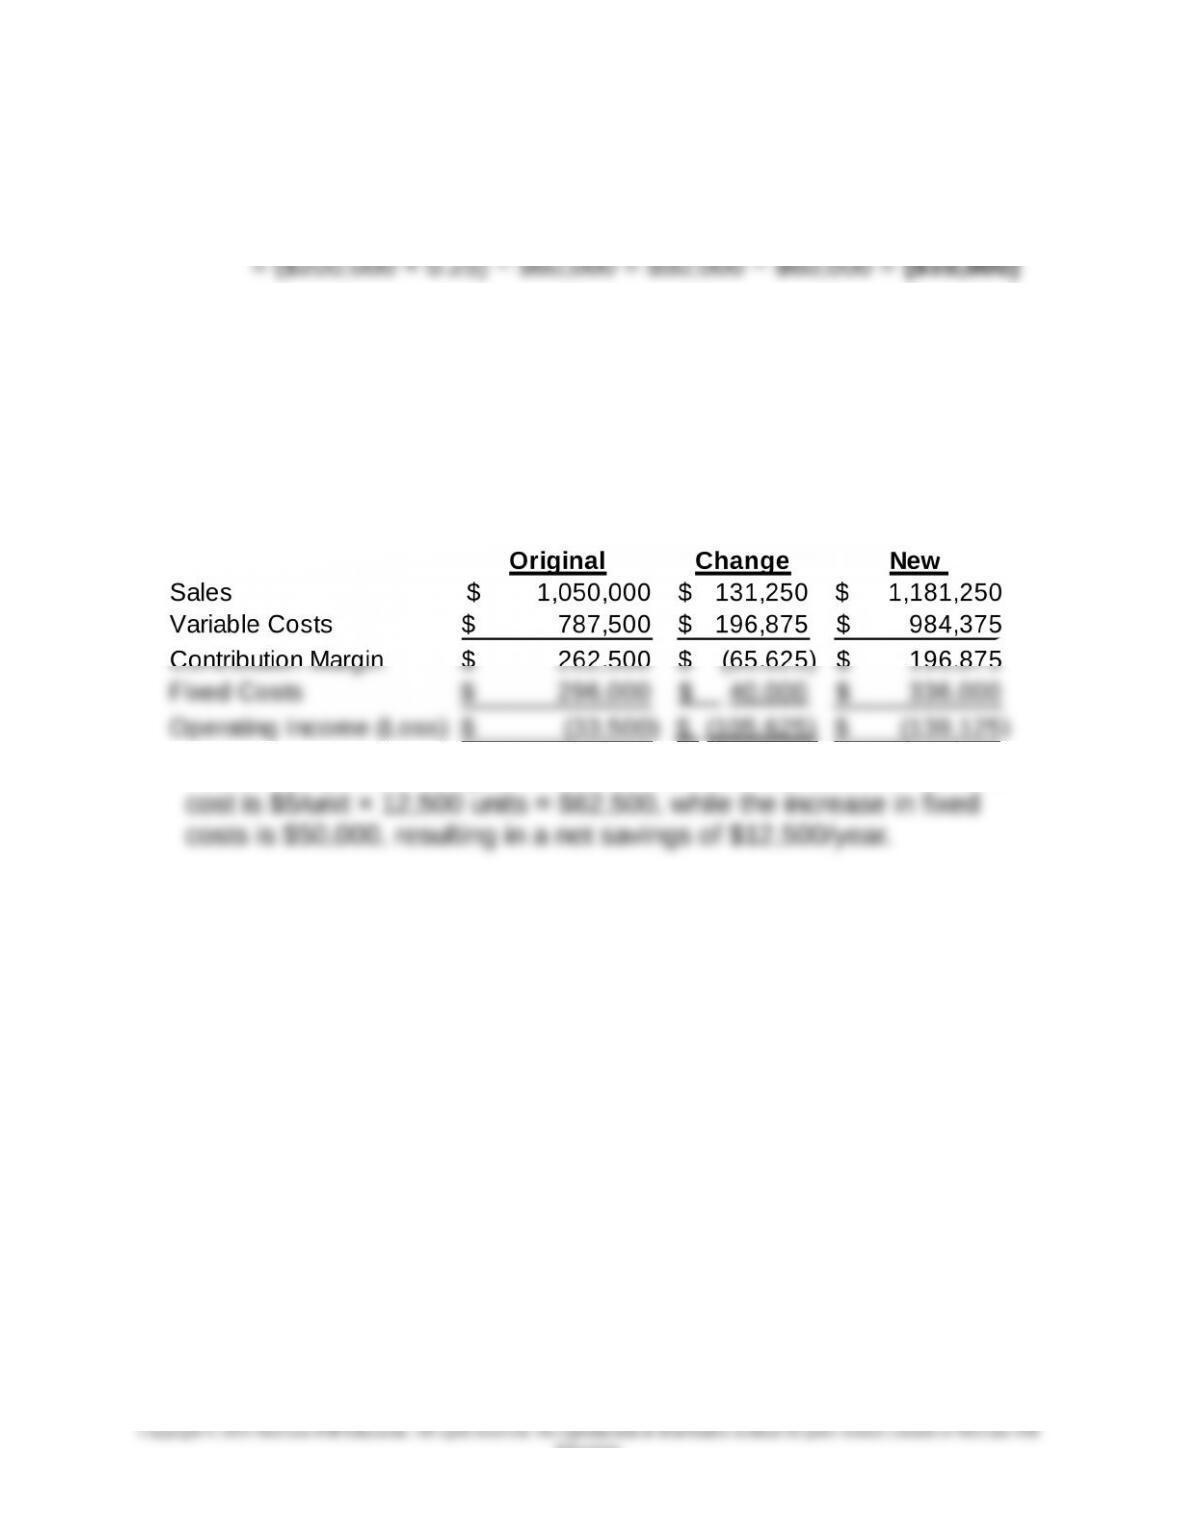
6. Operating Profit will decrease $105,625, from a loss of $33,500 to a
loss of $139,125:
Planned reduction in selling price/unit = 10%
Estimated increase in sales volume (units) = 25%
Estimated increase in fixed costs = $40,000
7. Yes, the proposed change is desirable. The total reduction in variable
9-38
Education.
Chapter 09 – Short-Term Profit Planning: Cost-Volume-Profit (CVP) Analysis
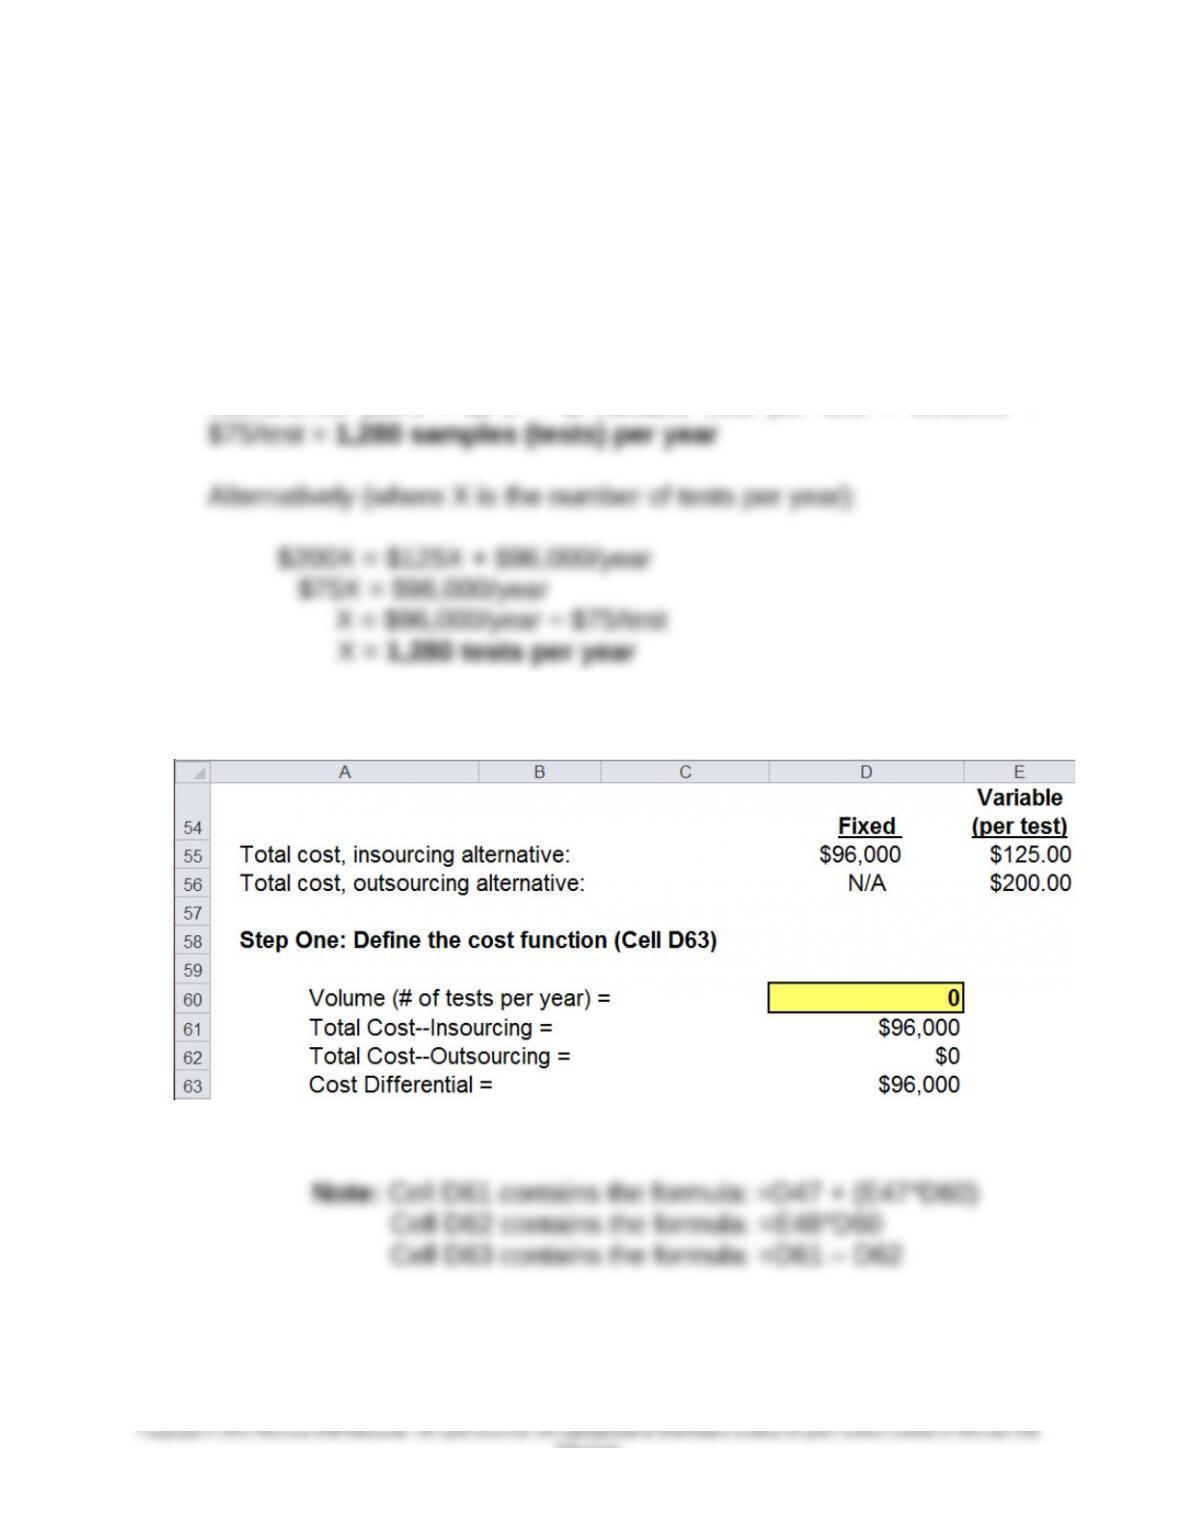
9-40 CVP Analysis (45-50 min)
1. Pro-rated per-year fixed cost of blood gas analysis machine =
$960,000 ÷ 10 years = $96,000/year
Savings per sample in direct costs if a blood gas analysis machine is
purchased: $200 − $125 = $75/test
Indifference point = ∆FC ÷ ∆ variable cost per test = $96,000 ÷
2. Using Goal Seek to determine the indifference point:
9-39
Education.