Chapter 09 – Short-Term Profit Planning: Cost-Volume-Profit (CVP) Analysis
9-32 Further Analysis–Degree of Operating Leverage (DOL) (40-45 min)
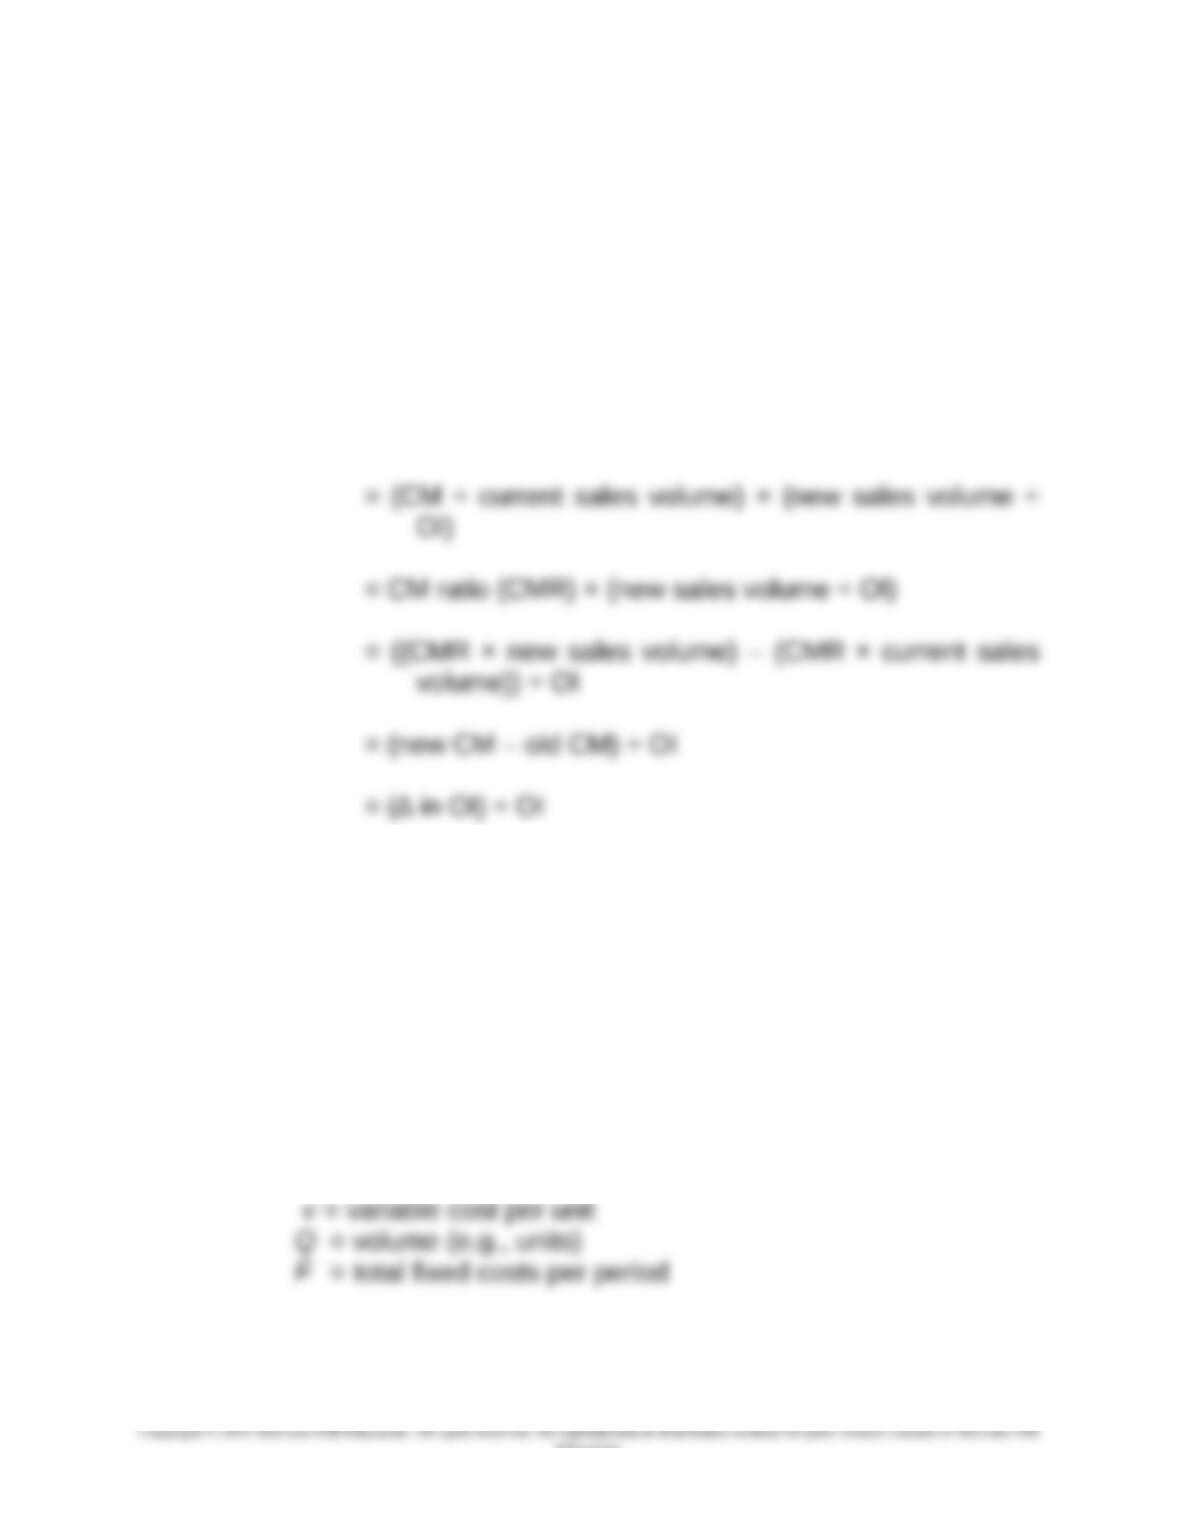
1. Demonstrating that DOL represents the % change in operating income
DOL = CM ÷ Operating Income (OI), for any given sales volume (Q)
New level of OI = DOL × percentage change in sales volume
= (CM ÷ OI) × (new sales volume ÷ current sales
volume)
= percentage change in Operating Income (OI)
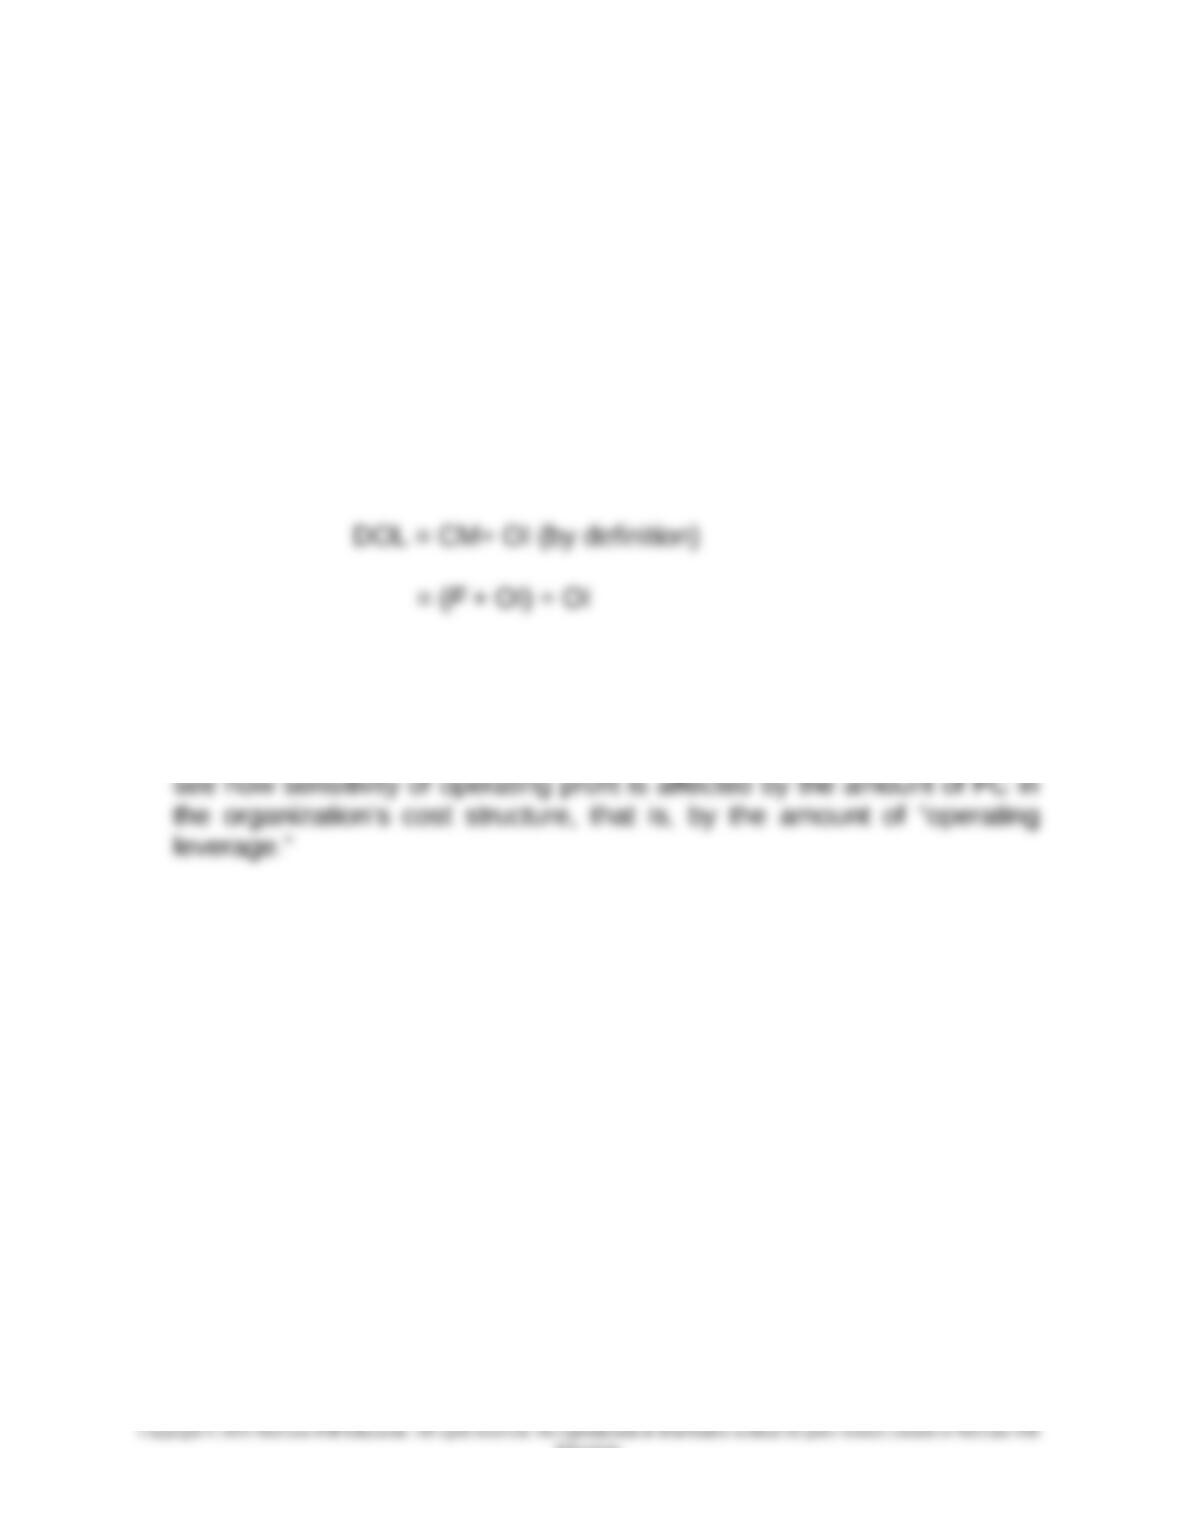
2. Relationship between definition of “operating leverage” and the DOL
measure
First, recall the basic profit equation for operating income (OI):
OI = [(p − v) × Q] − F
where p = selling price per unit
9-20
Education.
Chapter 09 – Short-Term Profit Planning: Cost-Volume-Profit (CVP) Analysis
9-32 (Continued)
Second, we can rewrite the above as (where CM = total contribution
margin):
F + OI = (p – v) × Q
= CM
Third,
Finally,
DOL = (F ÷ OI) + 1.0
The advantage of the above specification is that we can more readily
9-21
Education.
Chapter 09 – Short-Term Profit Planning: Cost-Volume-Profit (CVP) Analysis
9-33 Cost Structure of Retailers; the Internet; Operating Leverage (15
min)
1. A retailer can significantly reduce its operating leverage and reduce
costs during a period of initial growth in e-commerce by outsourcing
its e-commerce activity to service-providers. The term ESP for “e-
commerce service provider” is sometimes used for this type of
successful.
2. Globalization presents an opportunity for the retailer to obtain the
outsourcing service in low-cost countries throughout the world.
9-22
Education.
Chapter 09 – Short-Term Profit Planning: Cost-Volume-Profit (CVP) Analysis
9-34 Contribution Income Statements; Sensitivity Analysis; Goal Seek
(Excel) (40-45 minutes)
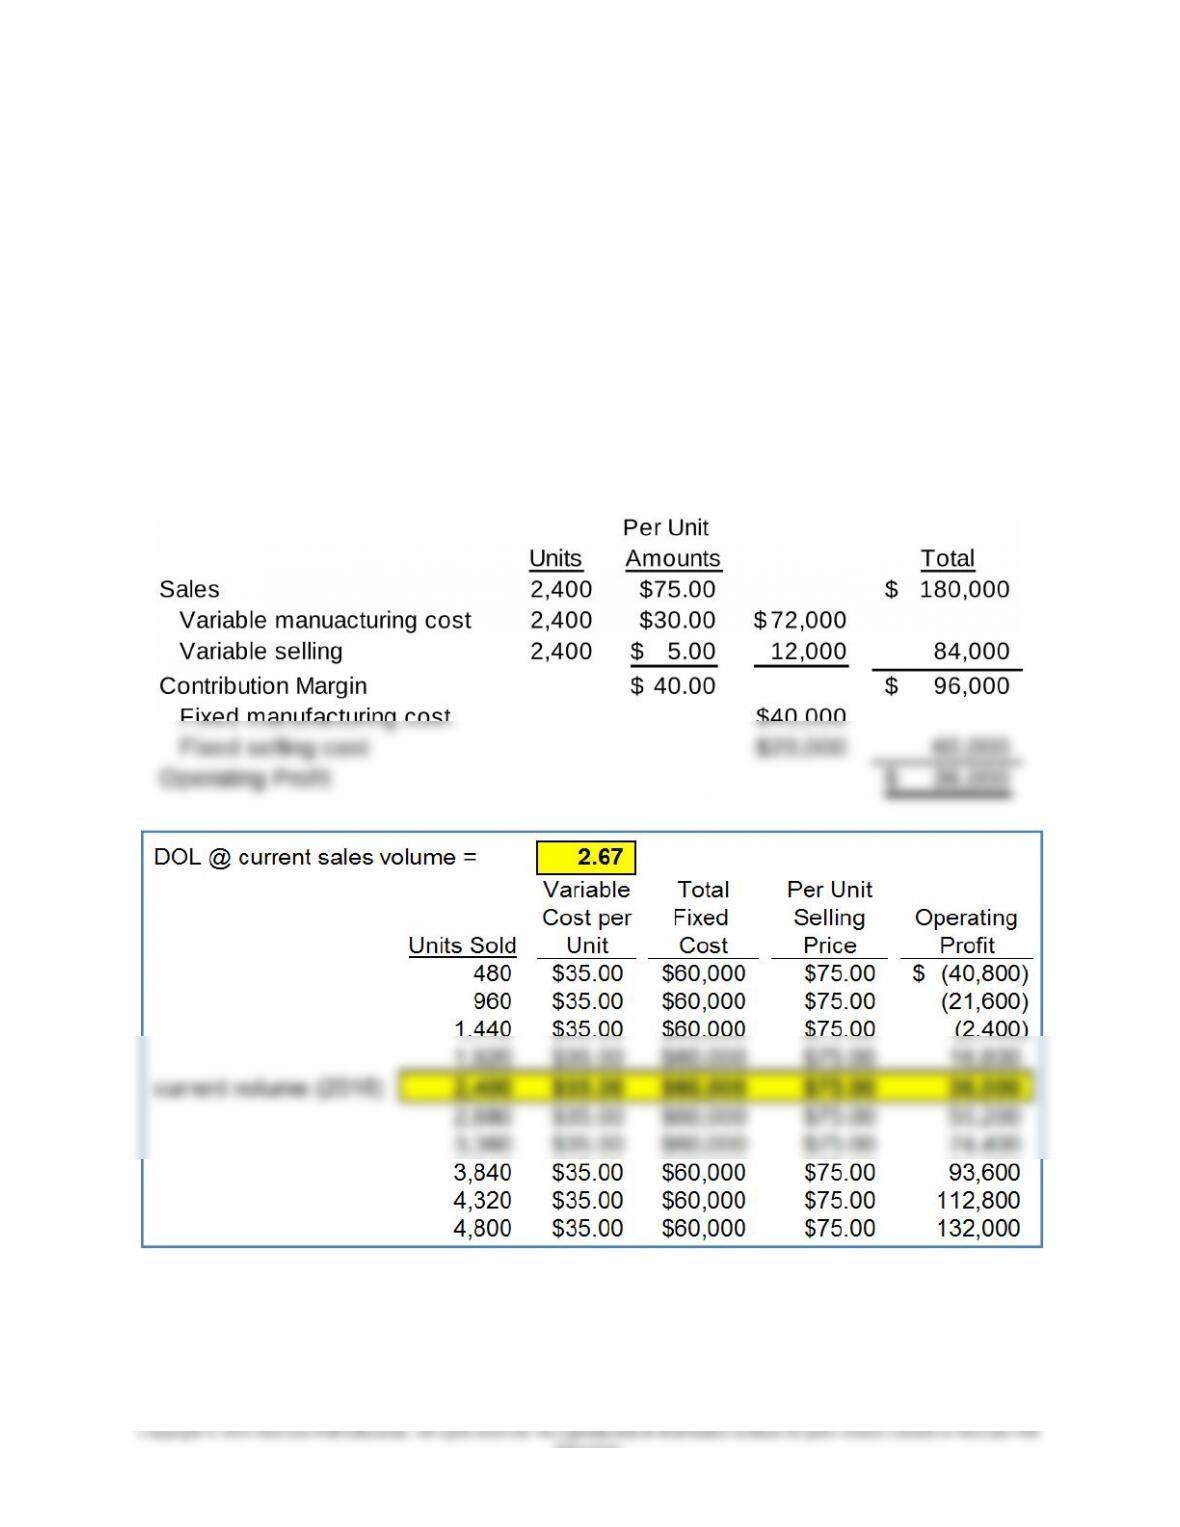
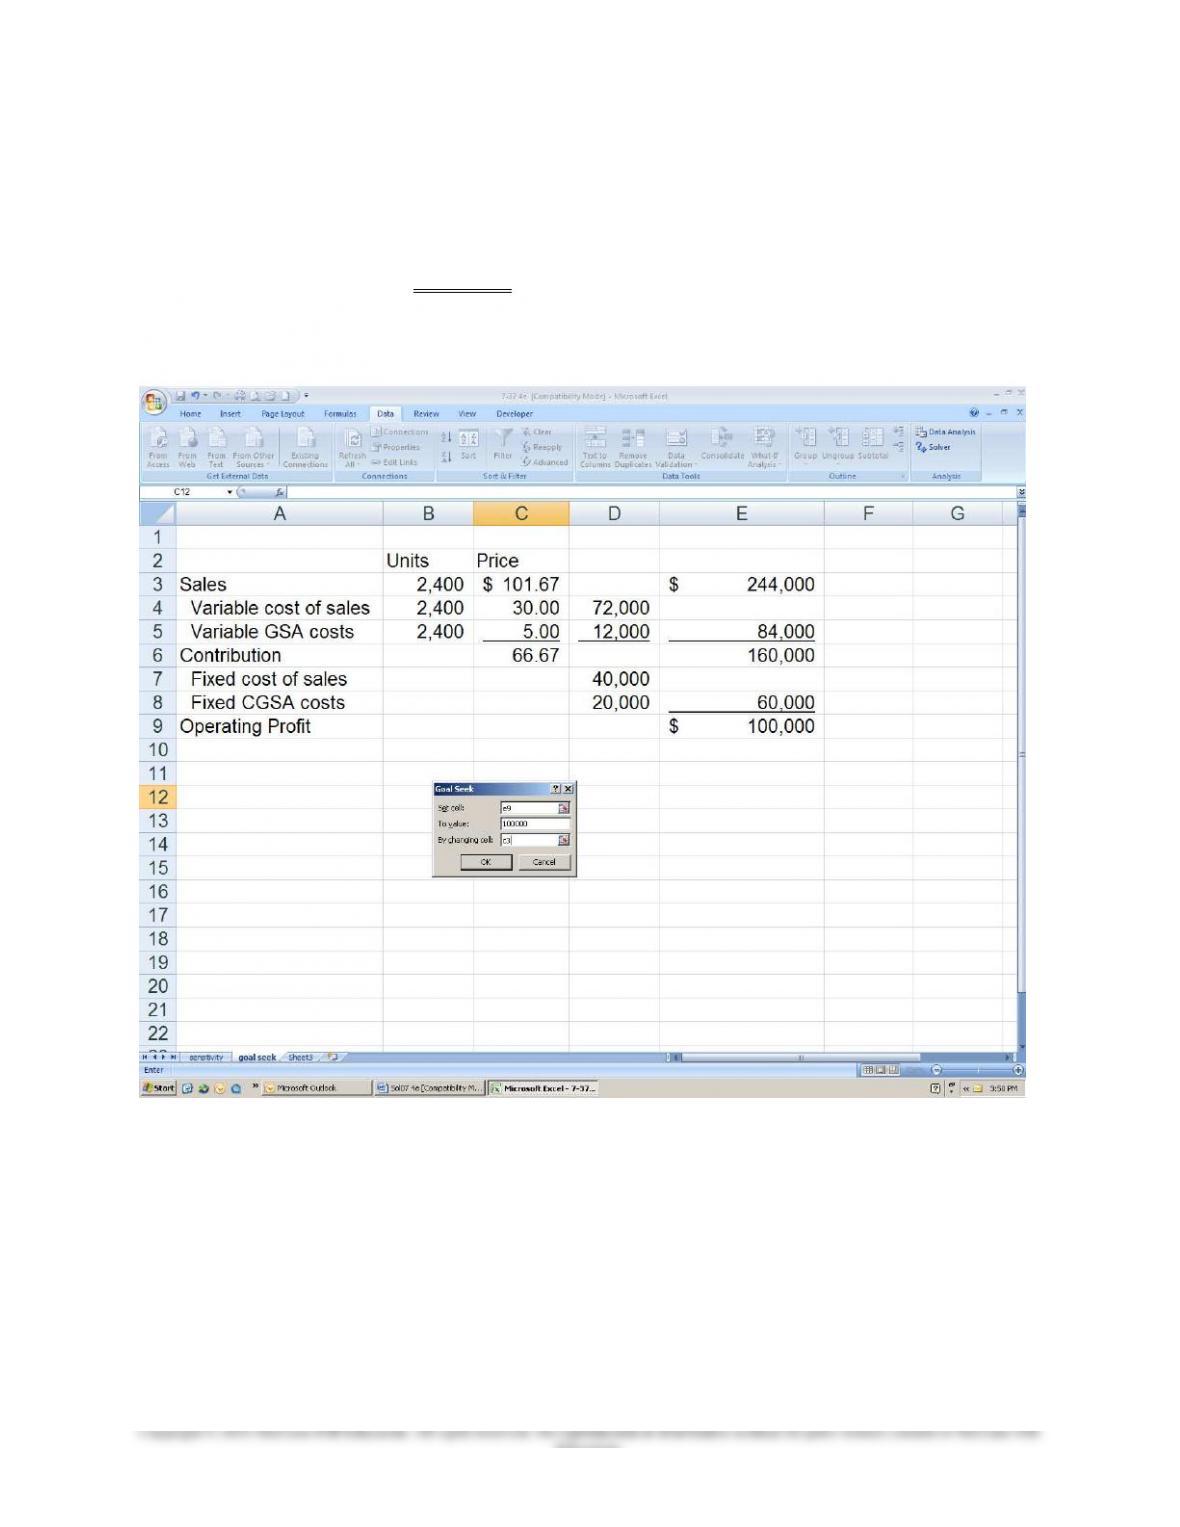
1. A variety of possible spreadsheets could satisfy this requirement. One
example is the spreadsheet embedded below. The sensitivity analysis
shows sales levels from 20% to 200% of 2016 expected sales of 2,400
units, and the related effect on operating profit.
At a sales volume of 2,400 units HFI’s degree of operating leverage
(DOL) is 2 2/3. From this volume level, each percentage change in sales
results in a 2.667% change in operating profit.
9-23
Education.
Chapter 09 – Short-Term Profit Planning: Cost-Volume-Profit (CVP) Analysis
9-34 (continued-1)
2. The Goal Seek tool is available under Data//What-if Analysis/Goal Seek
in Excel. An example of how it is used is show below. The price would
have to increase to $101.67 in order for HFI to make a $100,000 before
tax profit.
9-24
Education.
Chapter 09 – Short-Term Profit Planning: Cost-Volume-Profit (CVP) Analysis
9-35 CVP Analysis (20 min)
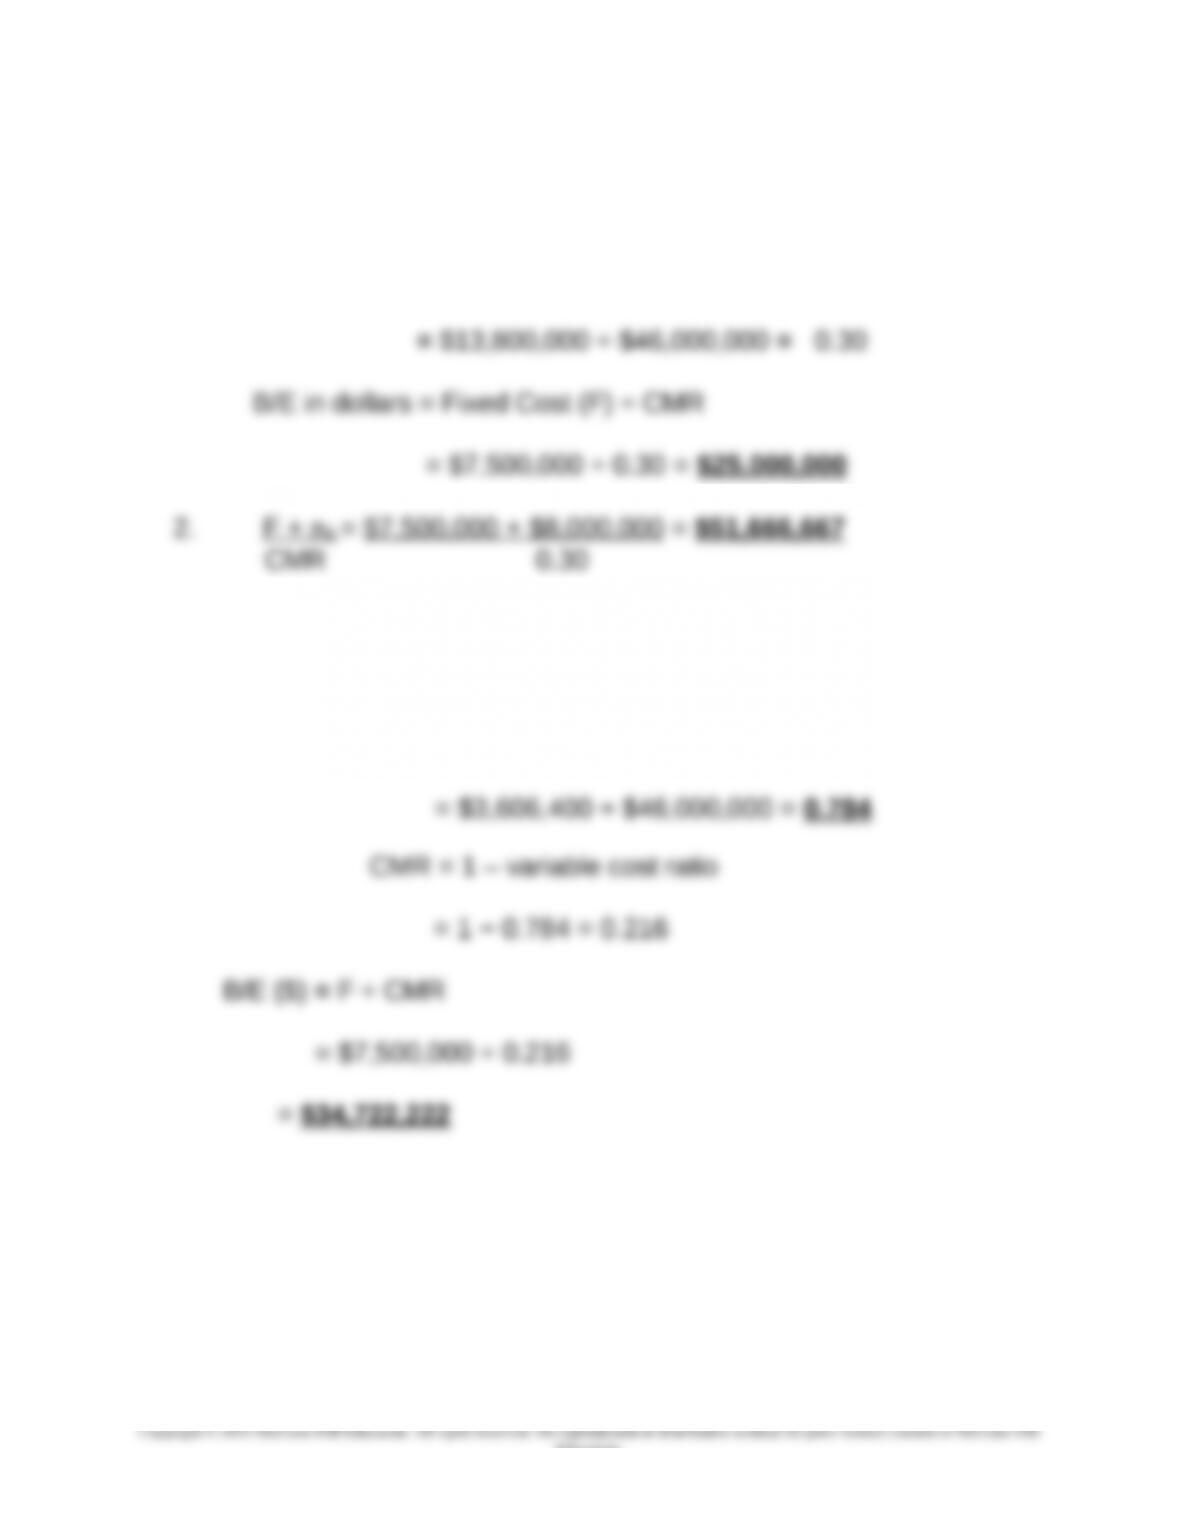
1. Contribution margin ratio (CMR) = Contribution margin ÷ Sales
Thus, CMR = ($46,000,000 − $32,200,000) ÷ $46,000,000
3. Variable cost ratio = Total variable costs ÷ Sales ($)
= (Original variable costs × 1.12) ÷ Sales ($)
= ($32,200,000 × 1.12) ÷ $46,000,000
9-25
Education.
Chapter 09 – Short-Term Profit Planning: Cost-Volume-Profit (CVP) Analysis
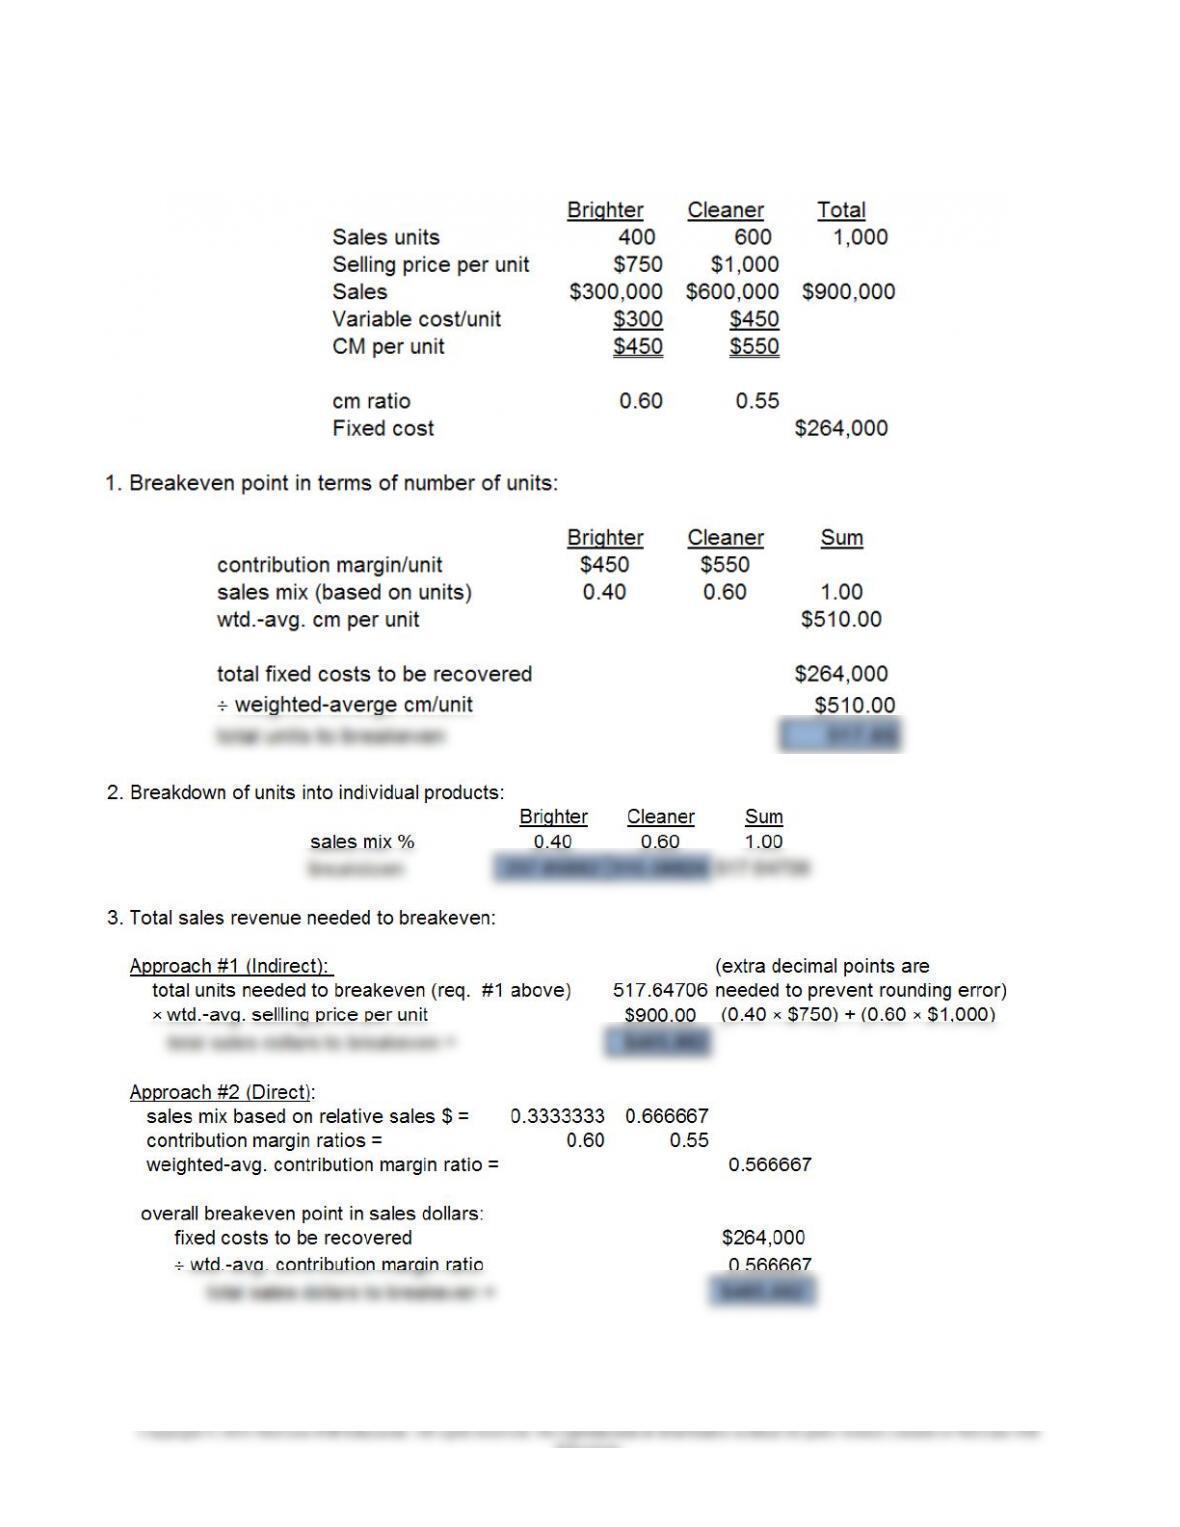
9-36 Multiple Product CVP Analysis (40-45 minutes)
9-26
Education.

Chapter 09 – Short-Term Profit Planning: Cost-Volume-Profit (CVP) Analysis
9-36 (Continued)
4. If machine hours are limited (i.e., if they represent a “scare resource”),
then information regarding the machine-hour consumption of each of the
two products would be important for product-planning purposes. That is,
such information could be used to calculate the contribution margin per
machine hour for each of the two products. This information, in turn, would
help guide the product-mix decision: the greater the contribution margin per
machine hour, the greater the profitability (and therefore desirability) of the
product.
An Excel spreadsheet that provides the solution for this exercise is
embedded below:
9-27
Education.
Ex 9–36.xlsx
Chapter 09 – Short-Term Profit Planning: Cost-Volume-Profit (CVP) Analysis
PROBLEMS
9-37 CVP Analysis; Strategy (45-50 min)
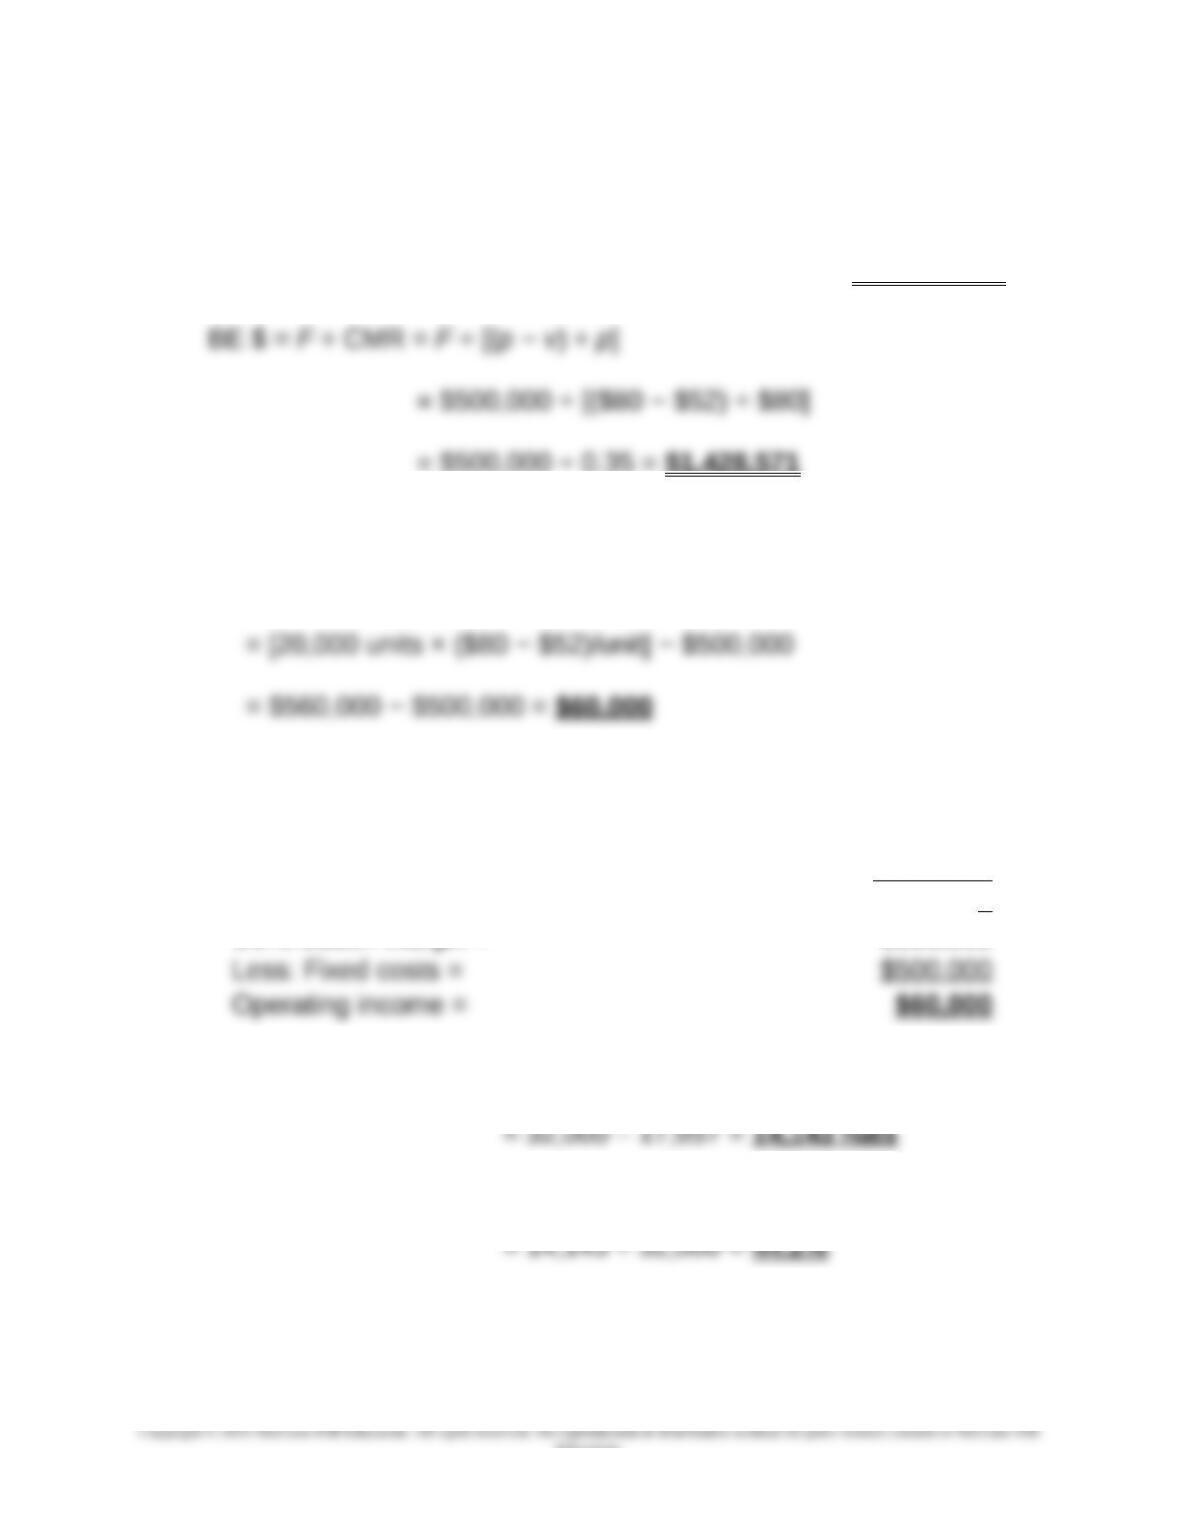
1. BE units = F ÷ (p − v) = $500,000 ÷ ($80 − $52)/unit = 17,857 units
= $500,000 ÷ 0.35 = $1,428,571
2. πB= Sales − variable costs − fixed costs
= [Q × (contribution margin/unit)] − F
Contribution Income Statement:
Sales (20,000 units × $80.00/unit) =
$1,600,00
0
Less: Variable costs (20,000 units × $52.00/unit) =
$1,040,00
0
Contribution Margin = $560,000
3. Margin of safety (MOS) = Budgeted sales volume – Breakeven sales
volume
MOS ratio = MOS ÷ Budgeted sales volume
Both the MOS and the MOS ratio refer to the extent to which sales
could fall before losses are realized. In this sense, they are rough
measures of operating risk and are therefore helpful in addressing
9-28
Education.

Chapter 09 – Short-Term Profit Planning: Cost-Volume-Profit (CVP) Analysis
inherent uncertainty in the profit-planning process.
9-29
Education.