Chapter 08 – Cost Estimation
8-50 (continued -1)
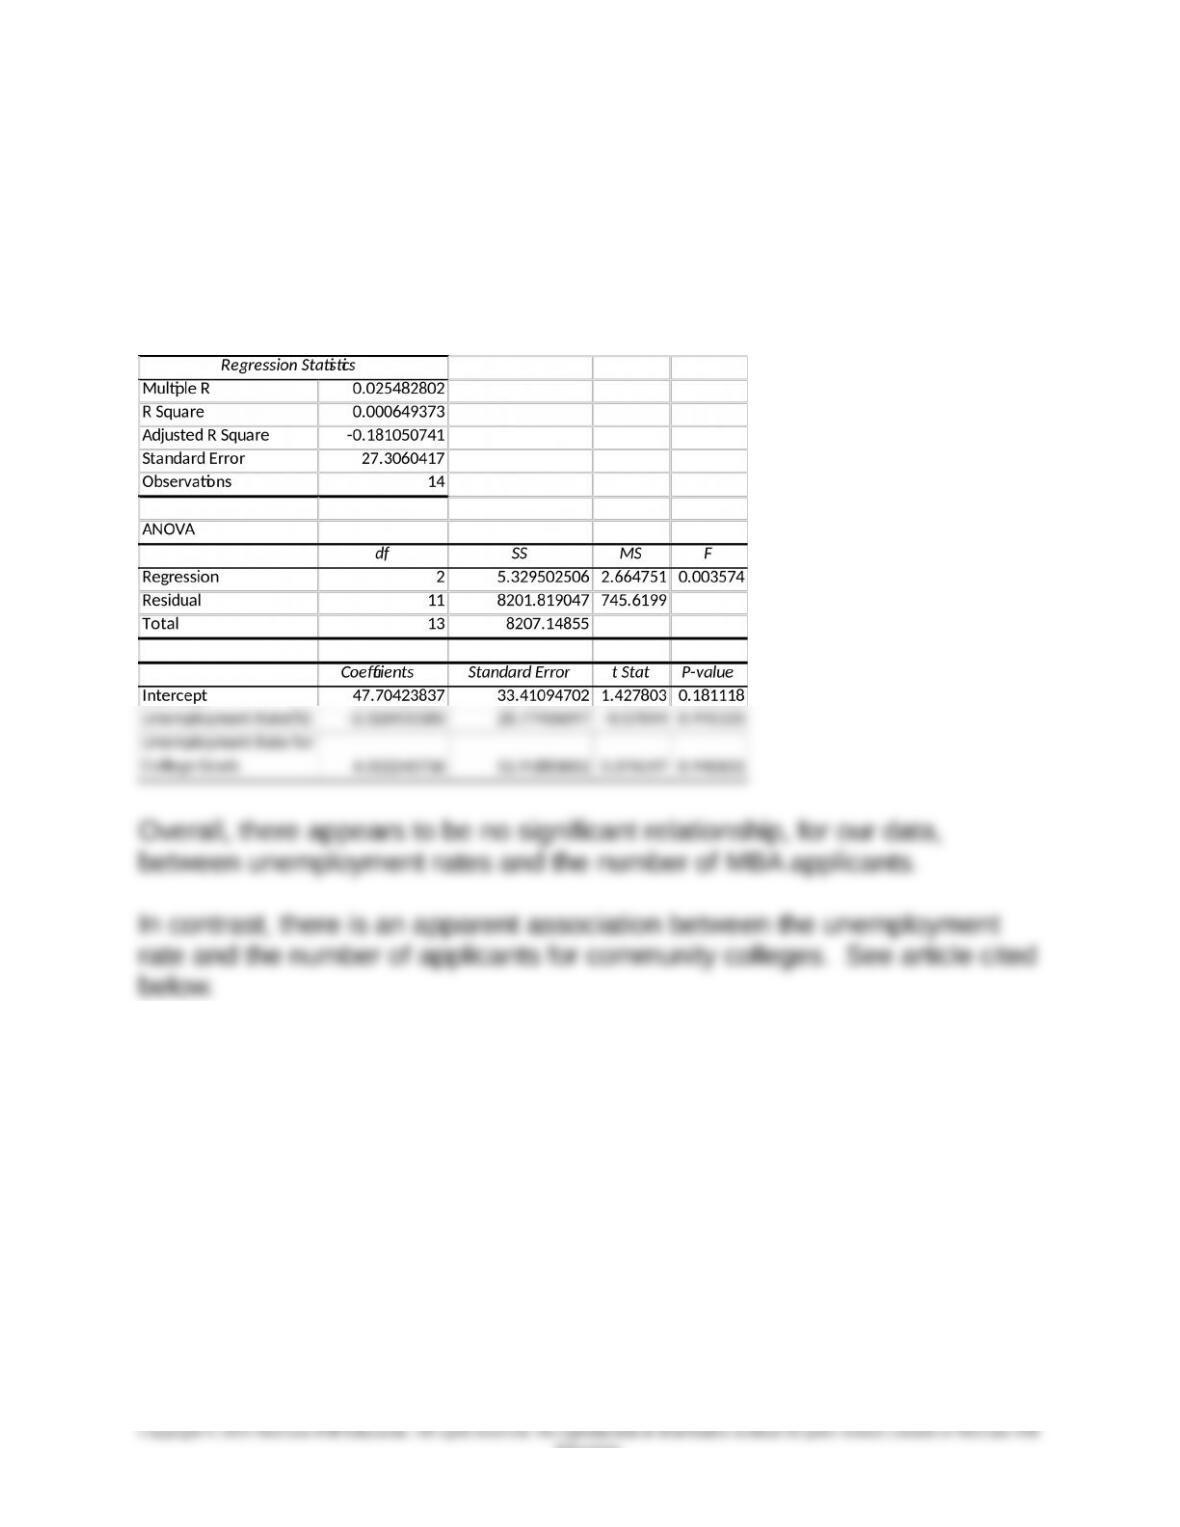
To potentially improve the measurement of the employment rate, the
regression analysis shown below uses the unemployment rate for college
graduates 25 years or older (also from the Bureau of Labor Statistics site).
Again, the results are not significant.
Sara Murray, “Weighing the Two-Year Option,” The Wall Street
Journal, January 28, 2009, p D1.
8-51
Education.
Chapter 08 – Cost Estimation
8-50 (continued -2)
For a more recent update to the above, see “College Grads Gain on
MBAs,” The Wall Street Journal,” October 6, 2011, p. B5. This article
makes the case that, in 2011, the gap is closing between MBAs and
business undergrad students on a number of dimensions of employment.
Also, there is evidence that the relationships among variables affecting
unemployment have changed significantly since the recession of 2007-
2009. See Justin Lahart, “On Jobs, No Celebratory Beveridge,” The Wall
Street Journal, April 11, 2012, p C14. The word Beveridge refers to the
Beveridge Curve, a correlation model which predicts the (inverse)
relationship between the job vacancy rate in the economy and the
8-52
Education.
Chapter 08 – Cost Estimation
8-51 Learning Curves (20 min)
The average production hours per unit obviously decreased as the
output increased. This decrease corresponds very closely to that of a
90% learning curve.
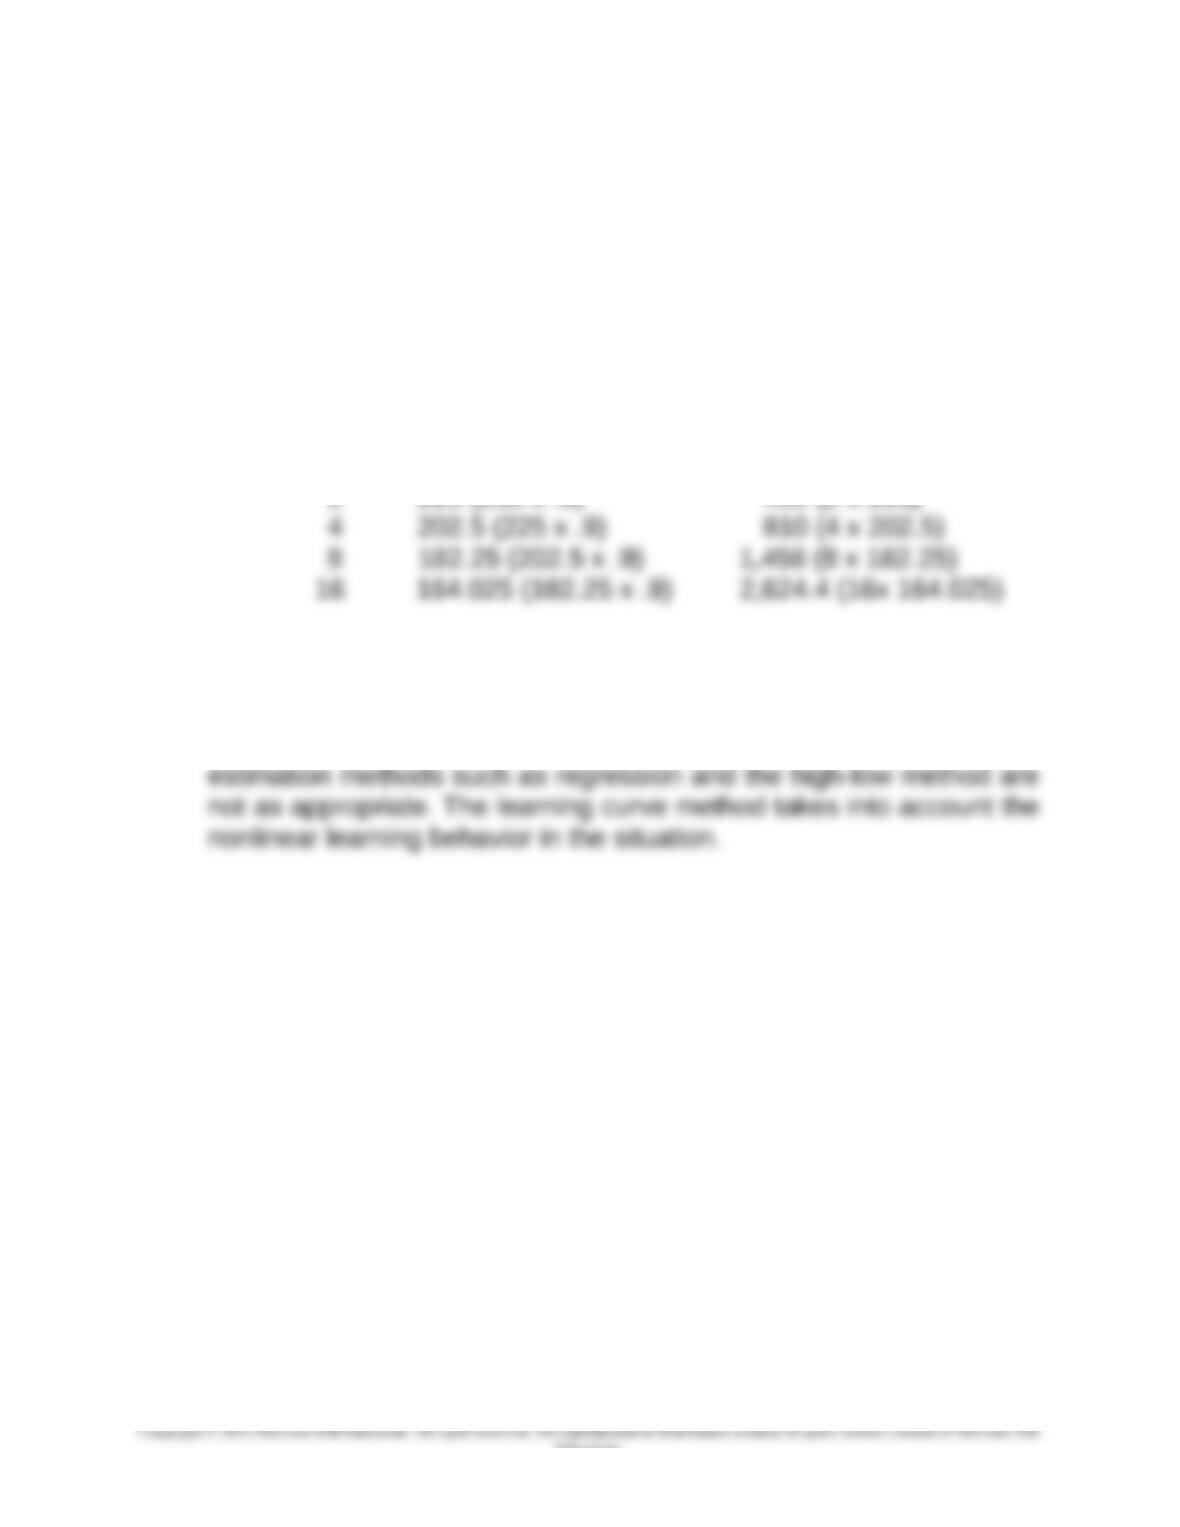
1. An estimate of the hours required to build 16 aircraft is 2,624
hours.
Output Avg. Time Total Time
1 250 250
2 225 (250 x .9) 450 (2 x 225)
2. The role of learning curves is to help predict future costs when
significant learning takes place in the work. When learning is present,
unit costs increase at a nonlinear, decreasing rate, so that linear
8-53
Education.
Chapter 08 – Cost Estimation
8-52 Learning Curves (20 min)
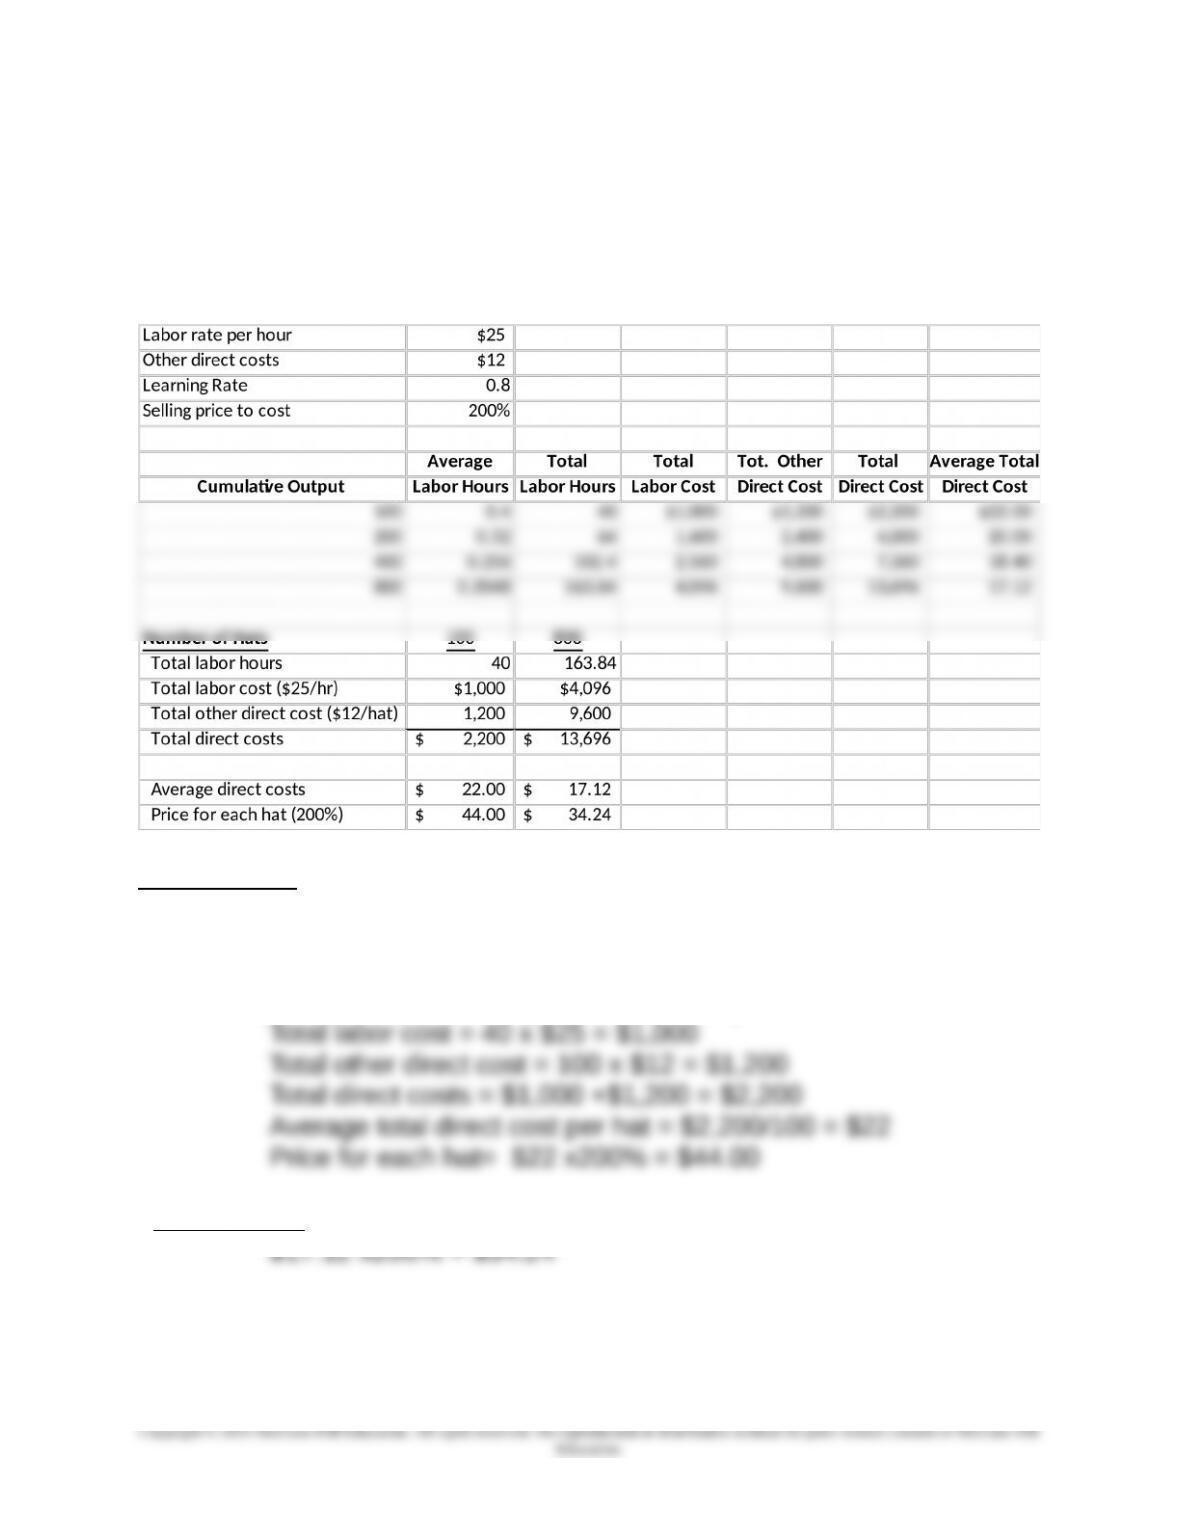
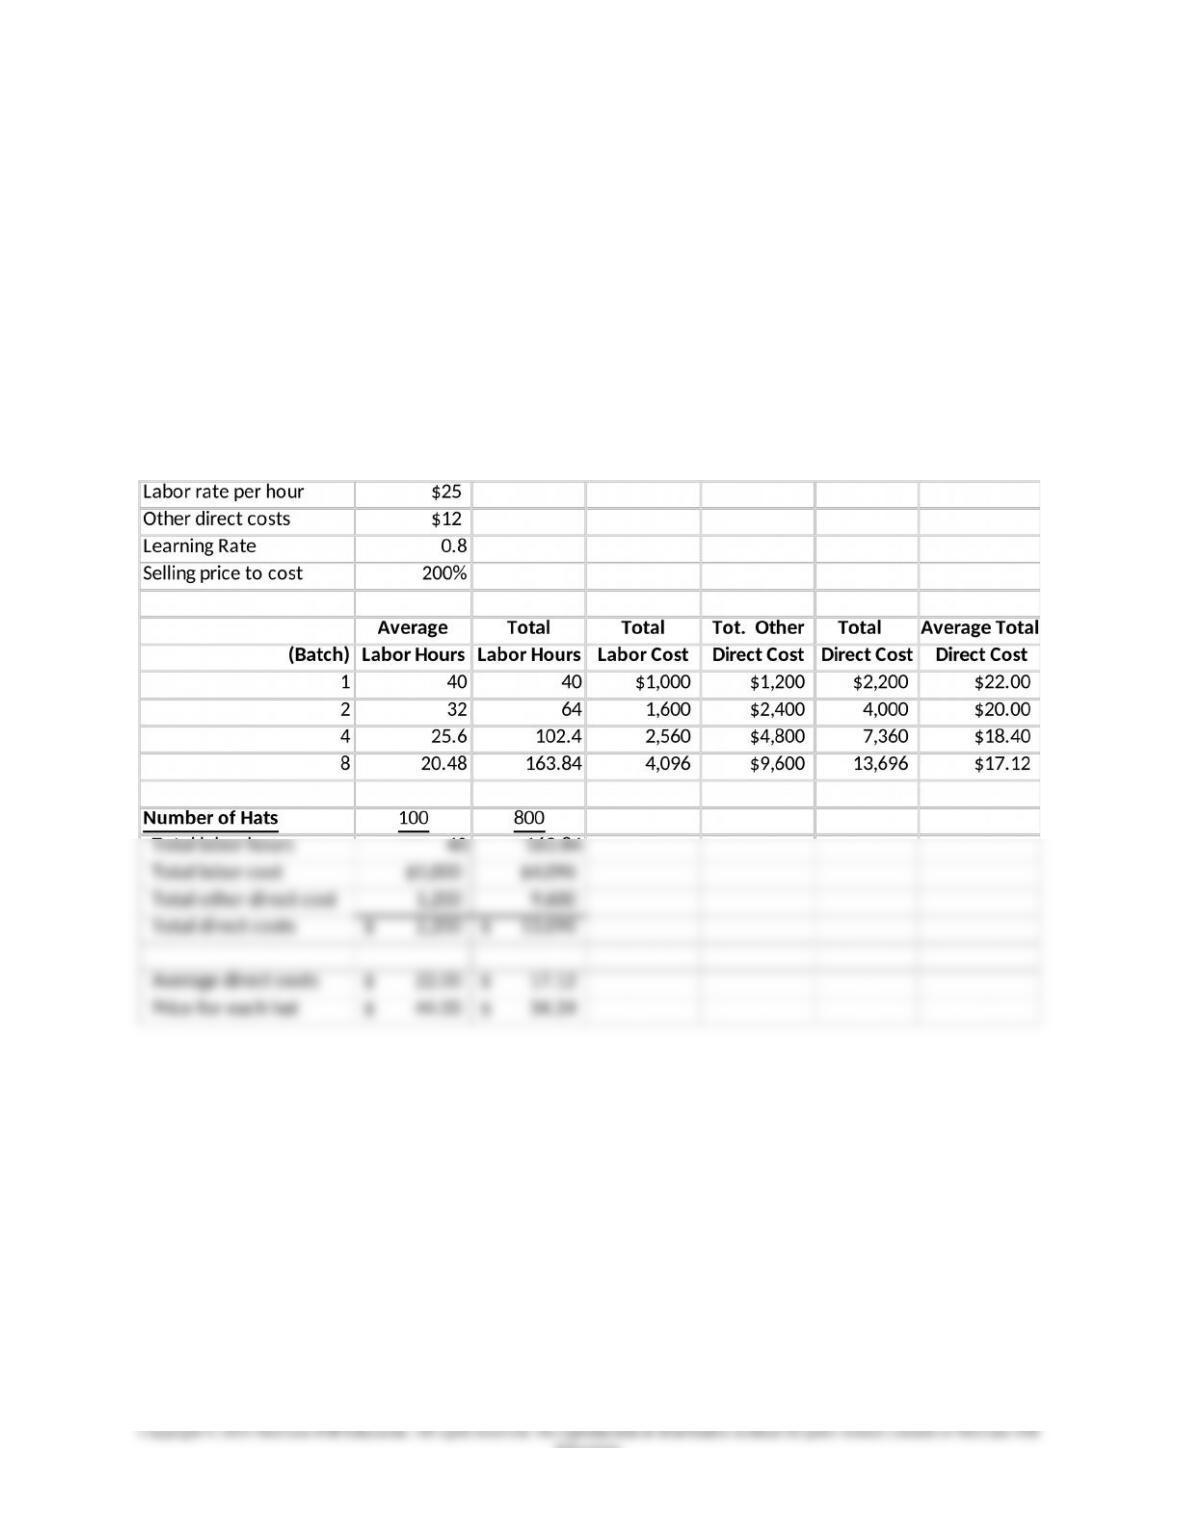
The average labor hours for the first 100 hats is 25/100 = .25 hours per hat.
Labor cost is $25 per hour. The learning rate is 80%.
For 100 hats:
Total labor hours = 40
Average unit labor hours = 40÷100 = .4
[Note: Average unit labor hours for second batch,
reduced by learning = (.8 x .4) = .32 ]
For 800 hats (average total cost of $17.12 from above):
8-54
Chapter 08 – Cost Estimation
8.52 (continued -1)
Note: the learning in this case applies to batches of 100, that is, learning is
applied as the number of batches doubles. Whether the solution is based
on total output or output in batches, as long as learning is applied on the
basis of batches, the solution will be the same. The solution above is based
on units produced, and the equivalent batch-based solution is shown
below.
8-55
Education.
Chapter 08 – Cost Estimation
8-53 Learning Curves (30 min)
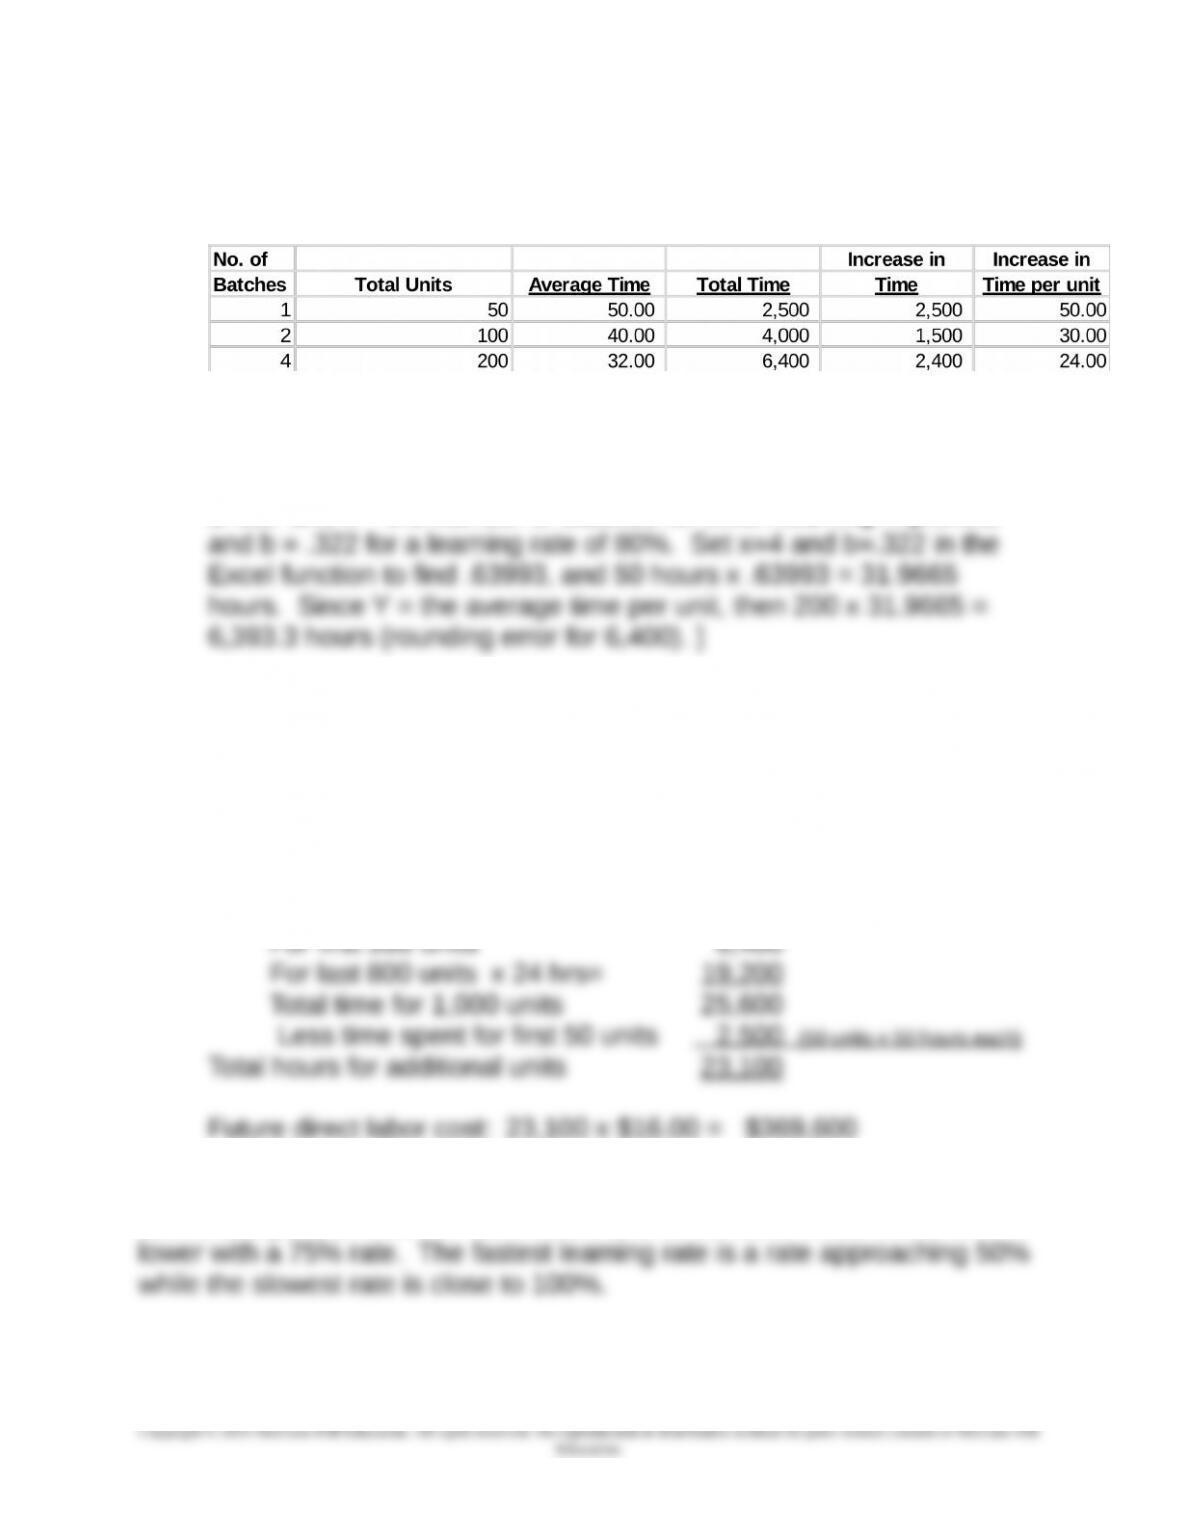
Assuming an 80% learning curve, the production time will likely follow
the schedule below:
[Note to instructor: the total time of 6,400 can also be derived by
using the power function in Excel (one of the “Math and Trig.”
functions). Use the formula Y=ax-b , where Y = average time per unit,
a=50, and x = the number of batches for which learning improves,
The total production of 1,000 units will require 4 batches of 200
total units affected by learning (for a cumulative total time of 6,400
hours) plus an additional 600 units with no learning. The last 600
units will require 24 hours each. Since 50 units have already been
completed, only 950 need to be manufactured. To calculate future
direct labor costs for the additional production of 950 units:
Total time for 950 additional units is:
2. The 75% learning rate is faster than the 80% rate used in the
above analysis, so that the labor hours and direct labor costs would be
8-56
Chapter 08 – Cost Estimation
8-53 (continued -1)
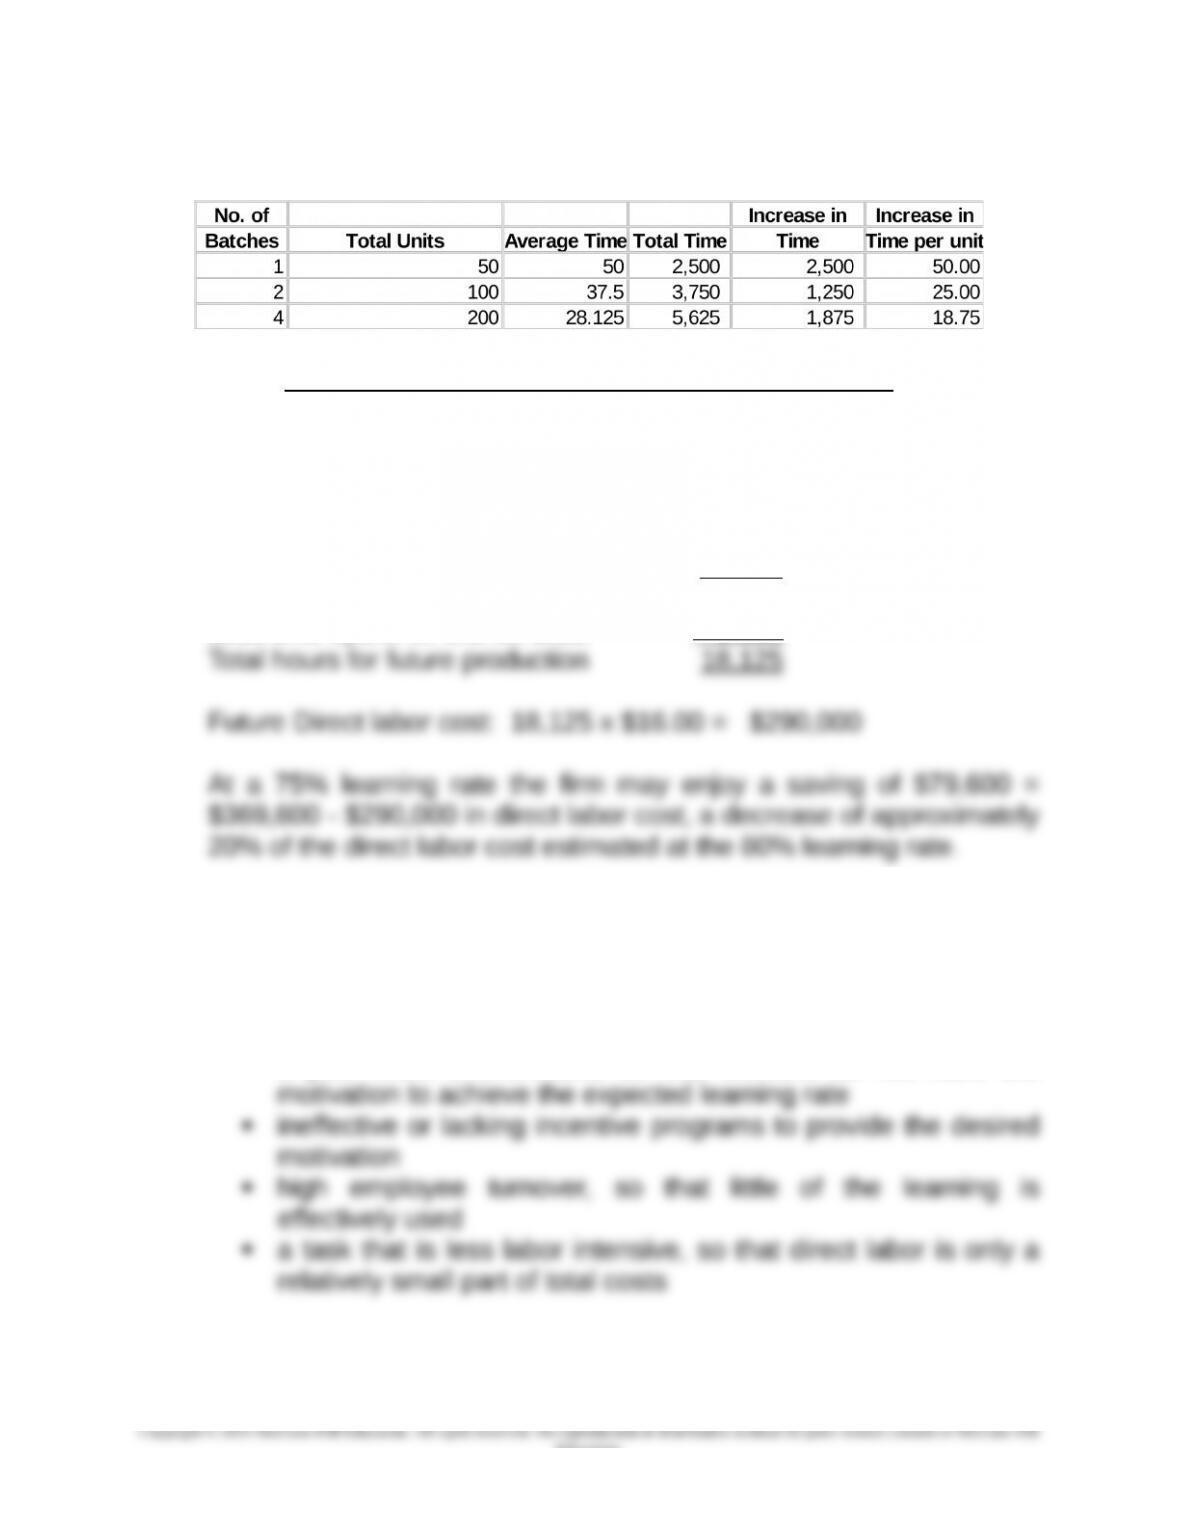
Estimated Production Time at 75% Learning Rate
At a 75% learning rate, the total time for 950 additional units is:
Total time for 950 additional units is:
For first 200 units 5,625
For last 800 units x 18.75 hrs= 15,000
Total time for 1,000 units 20,625
Less time spent for first 50 units 2,500
3. Conditions that might reduce the potential for the benefits from
learning curve analysis include:
a simple task that is quickly learned, so that there is little to be
gained from forecasting the rate of learning over time
a poor work environment, so that workers do not have the
8-57
Education.

Chapter 08 – Cost Estimation
8-53 (continued -2)
Strategically, firms like Ellington that are better able to predict costs
using learning curves and/or other methods will also be in a stronger
competitive position – the firm’s planning will be more focused and
effective. For example, firms that determine whether to manufacture
or outsource parts and components incorporating expected learning
effects into the analysis, as in this case for the Hauser company, will
improve their chances to implement world-class cost efficient
manufacturing.
8-58
Chapter 08 – Cost Estimation
8-54 Cross-Sectional Regression; Analysis of Rankings
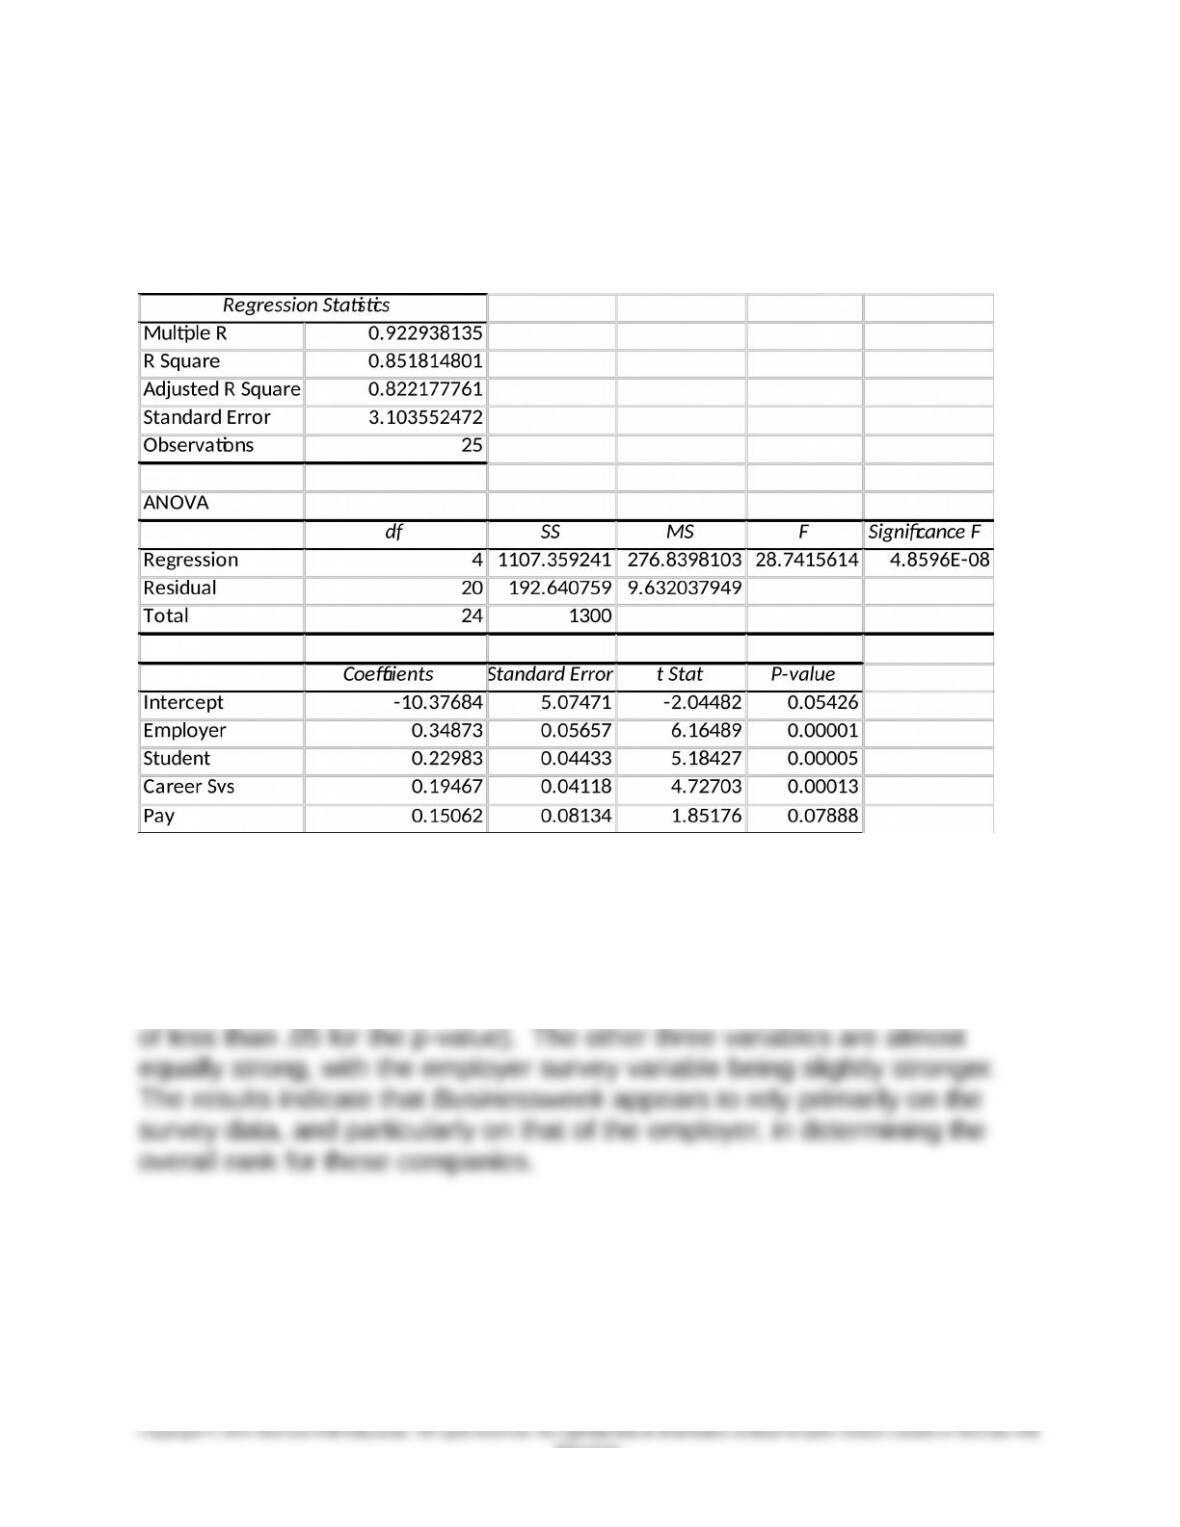
The regression results for the four independent variables with ranking of
the top 25 organizations as the dependent variable is shown below.
The results show that all four independent variable have a positive
relationship with the overall ranking, but that the Average Pay variable is
the weakest, and with a p-value of .078, would not be considered
statistically significant by most analysts (who generally look for a threshold
8-59
Education.
Chapter 08 – Cost Estimation
8-54 (continued -1)
2. The limitations of this regression are somewhat unique since the
independent variables (except for average pay) and the dependent
variable are rankings (ordinal numbers rather than real numbers).
Thus, the issue of nonlinearity arises, but in a different manner than
in most regressions applications. As noted in the text, nonlinearity
often arises because of trend or seasonality in the data when the data
is from a time-series. In this case, the data is cross-sectional, so we
do not have time-series nonlinearity problems. However, the
nonlinearity issues is relevant for the ranking data. The reason is that
8-60
Education.