Chapter 08 – Cost Estimation
8-30 Cost Relationships (10 min)
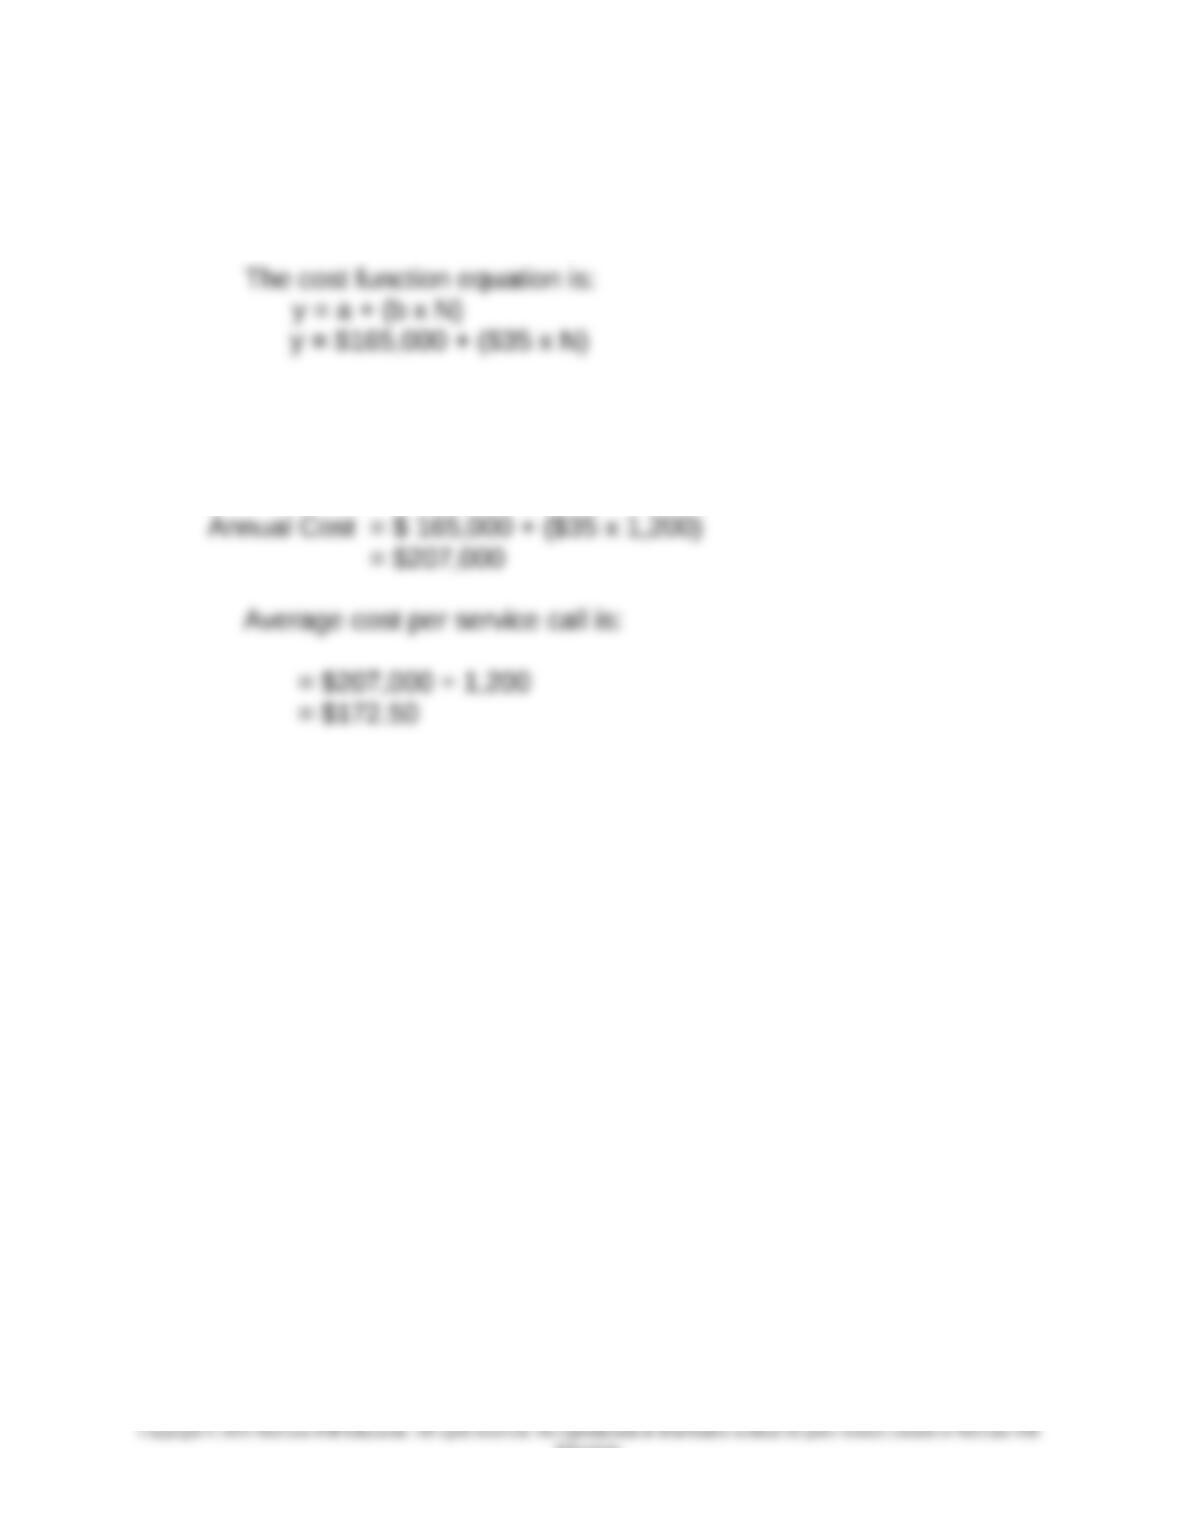
N = Number of Cleaning Services
Total annual cost is:
(Note: 100 service calls per month = 1,200 service calls per year; we
need total annual service since $165,000 is an annual cost)
8-11
Education.
Chapter 08 – Cost Estimation
8-31 Cost Relationships (15min)
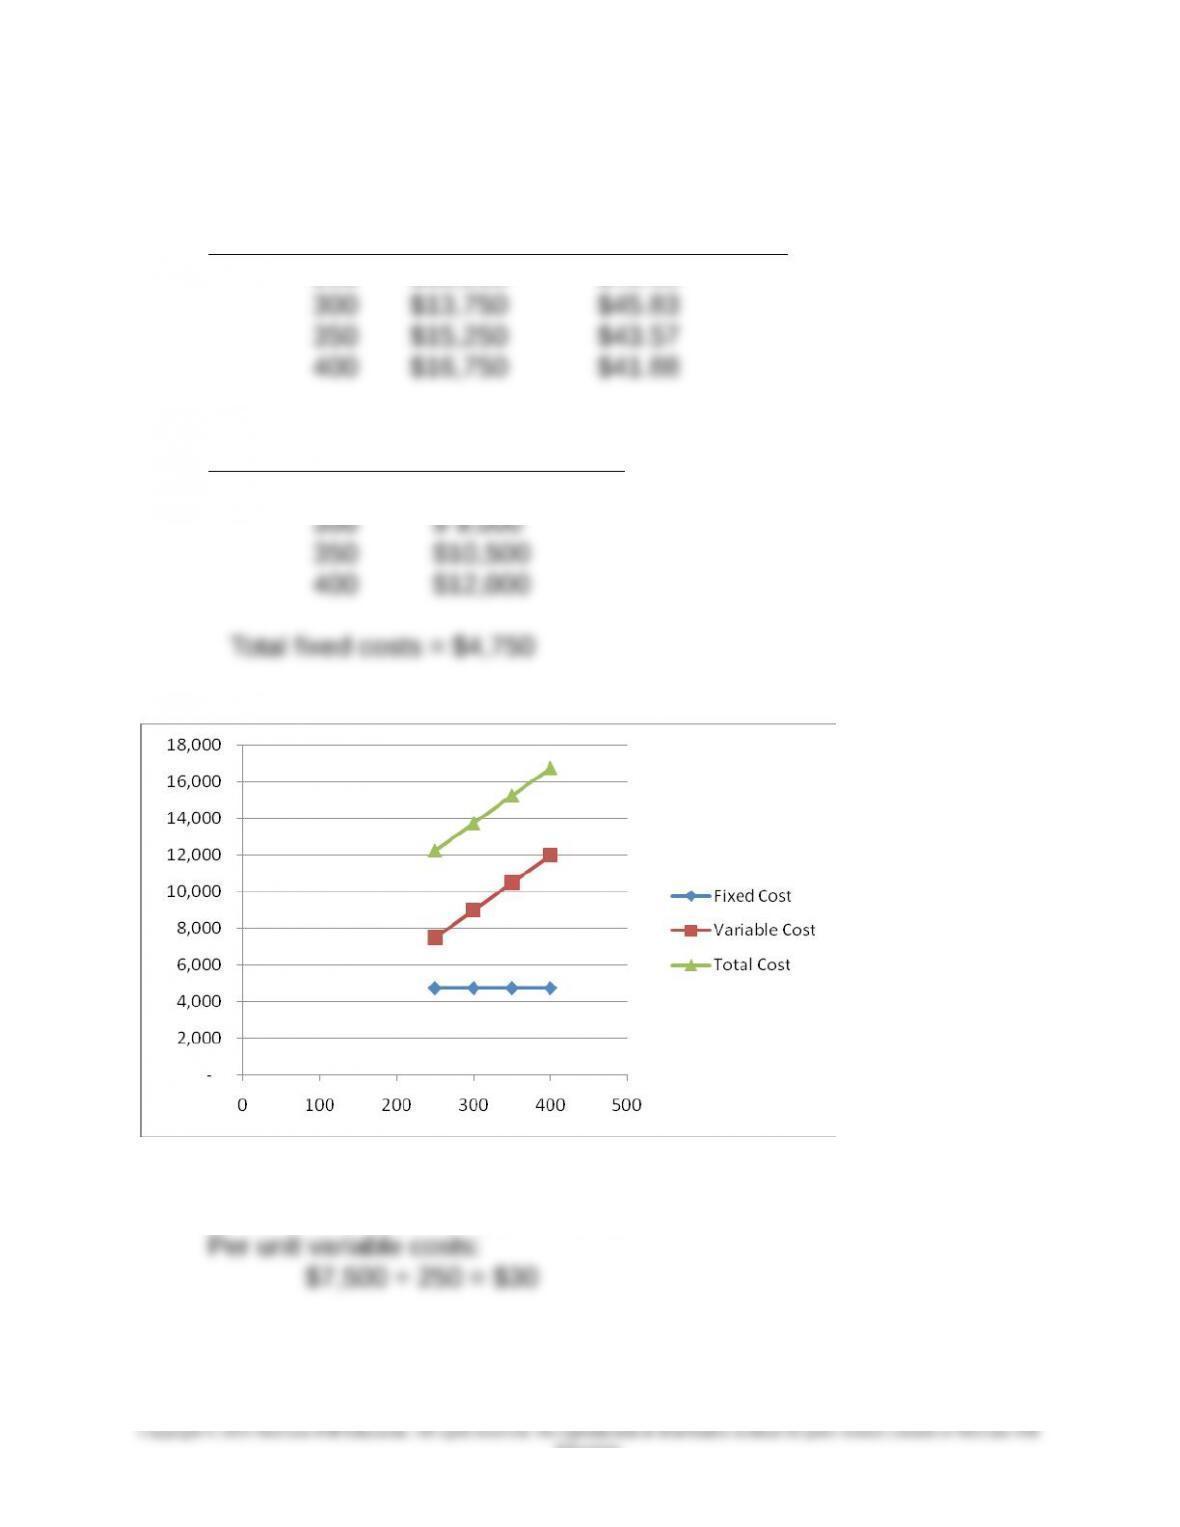
1. Total costs: See Exhibit below
Output Total Costs Total Costs Per Unit
250 $12,250 $49.00
Total variable costs:
Output Total Variable Costs
250 $ 7,500
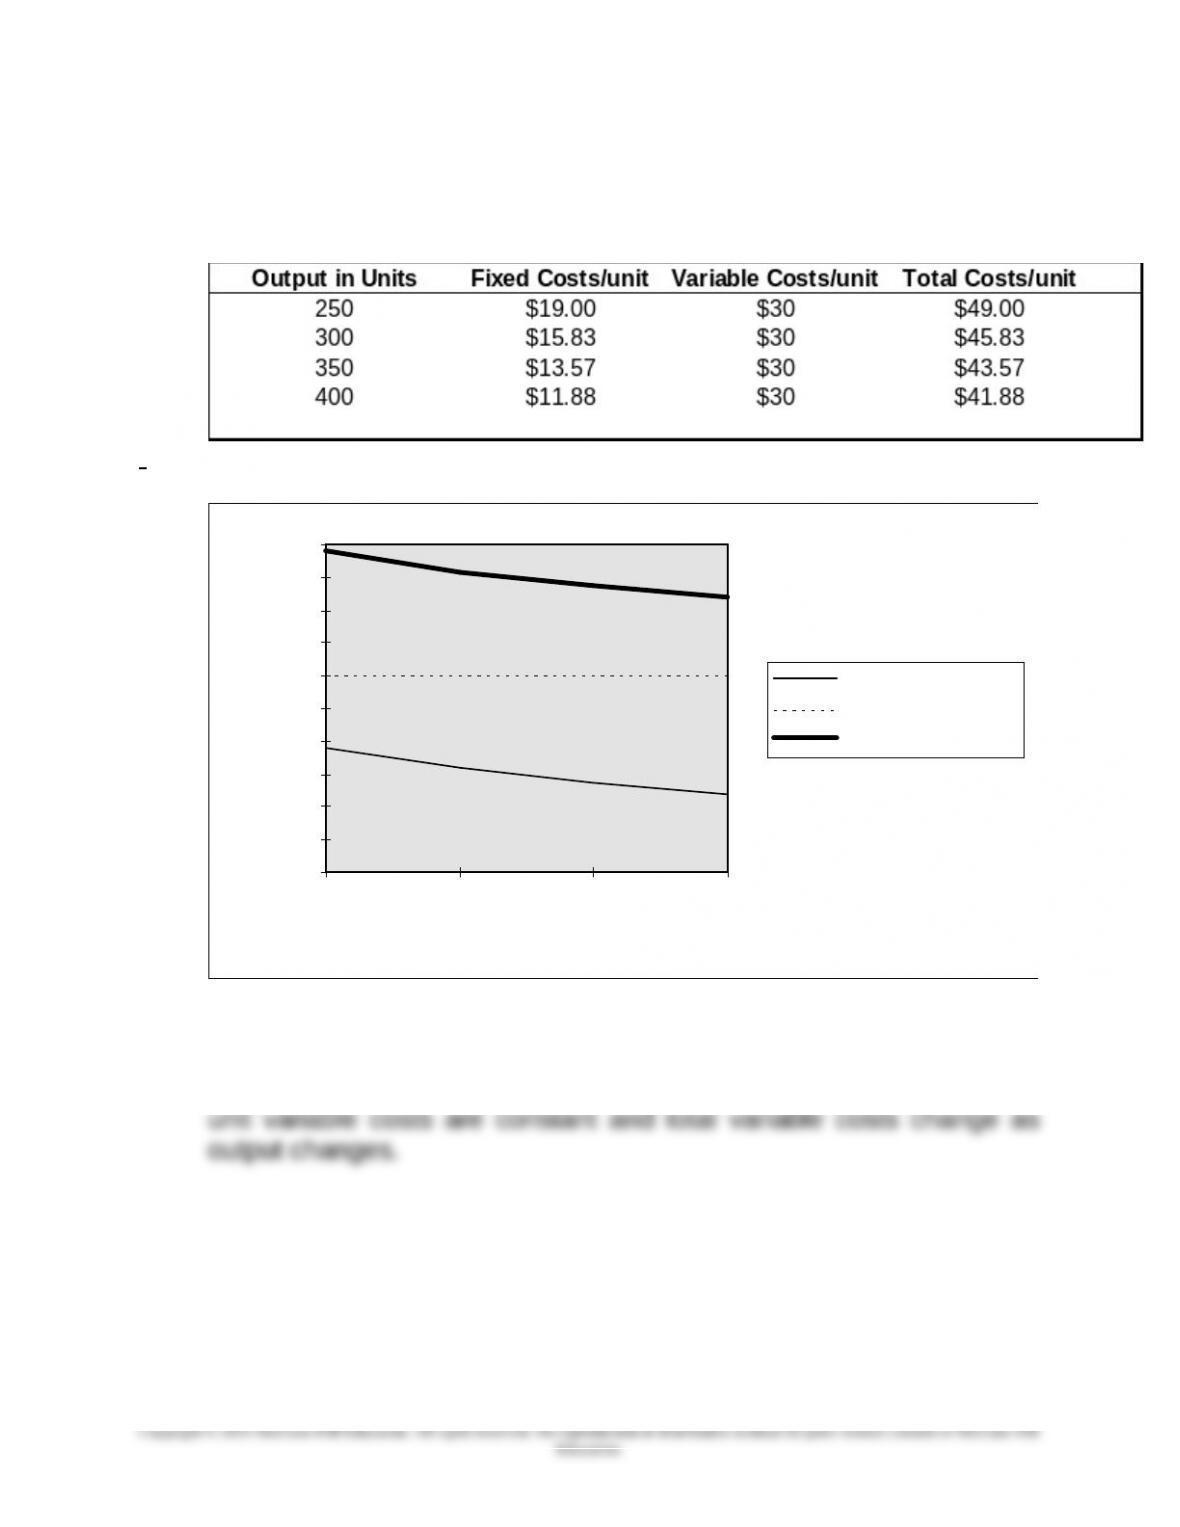
2. Per-unit total cost: See Exhibit below
8-12
Education.
Chapter 08 – Cost Estimation
8-31 (continued -1)
Per-unit costs:
\
0.00
5.00
10.00
15.00
20.00
25.00
30.00
35.00
40.00
45.00
50.00
250 300 350 400
Output
Cost
per Unit Fixed Cost
per Unit Variable Cost
per Unit Total Cost
3. The important point of these graphs is that total fixed costs are
constant while unit fixed costs change as output changes. In contrast,
8-13
Chapter 08 – Cost Estimation
8-32 Cost Estimation; Average Cost (15 min)
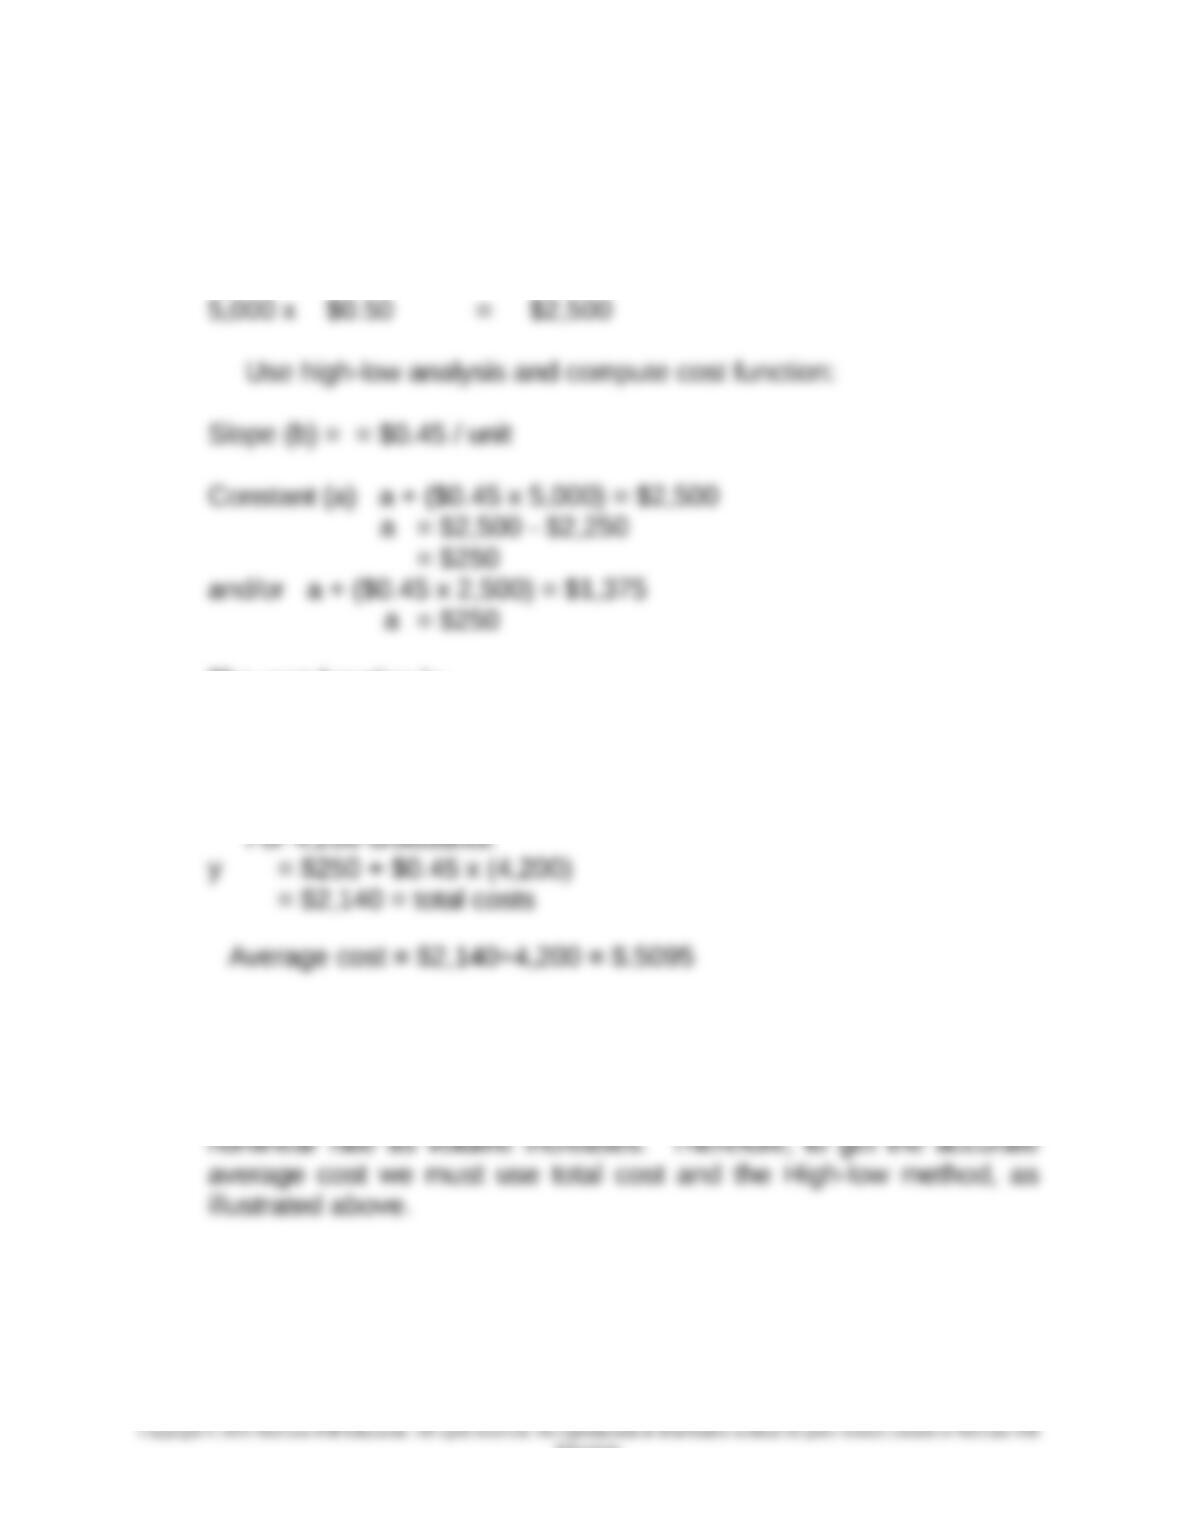
Compute total cost for each batch:
Units x Average Cost = Total Cost
2,500 x $0.55 = $1,375
The cost function is:
y = a + b x Number of croissants produced
y = $250 + [$0.45 x (croissants produced)]
The point of this exercise is that the unit average cost cannot be
determined simply by taking the simple average of $.50 and $.55,
because these average costs include fixed costs which decline at a
8-14
Education.

Chapter 08 – Cost Estimation
8-33 Cost Estimation Using Graphs (15 min)
1.
2.
There seems to be a positive linear relationship for the data between
$2,500 and $4,000 of advertising expense. Sue Lawson’s analysis is
8-15
Education.
Object 5
Chapter 08 – Cost Estimation
8-34 Analysis of Regression Results (10 min)
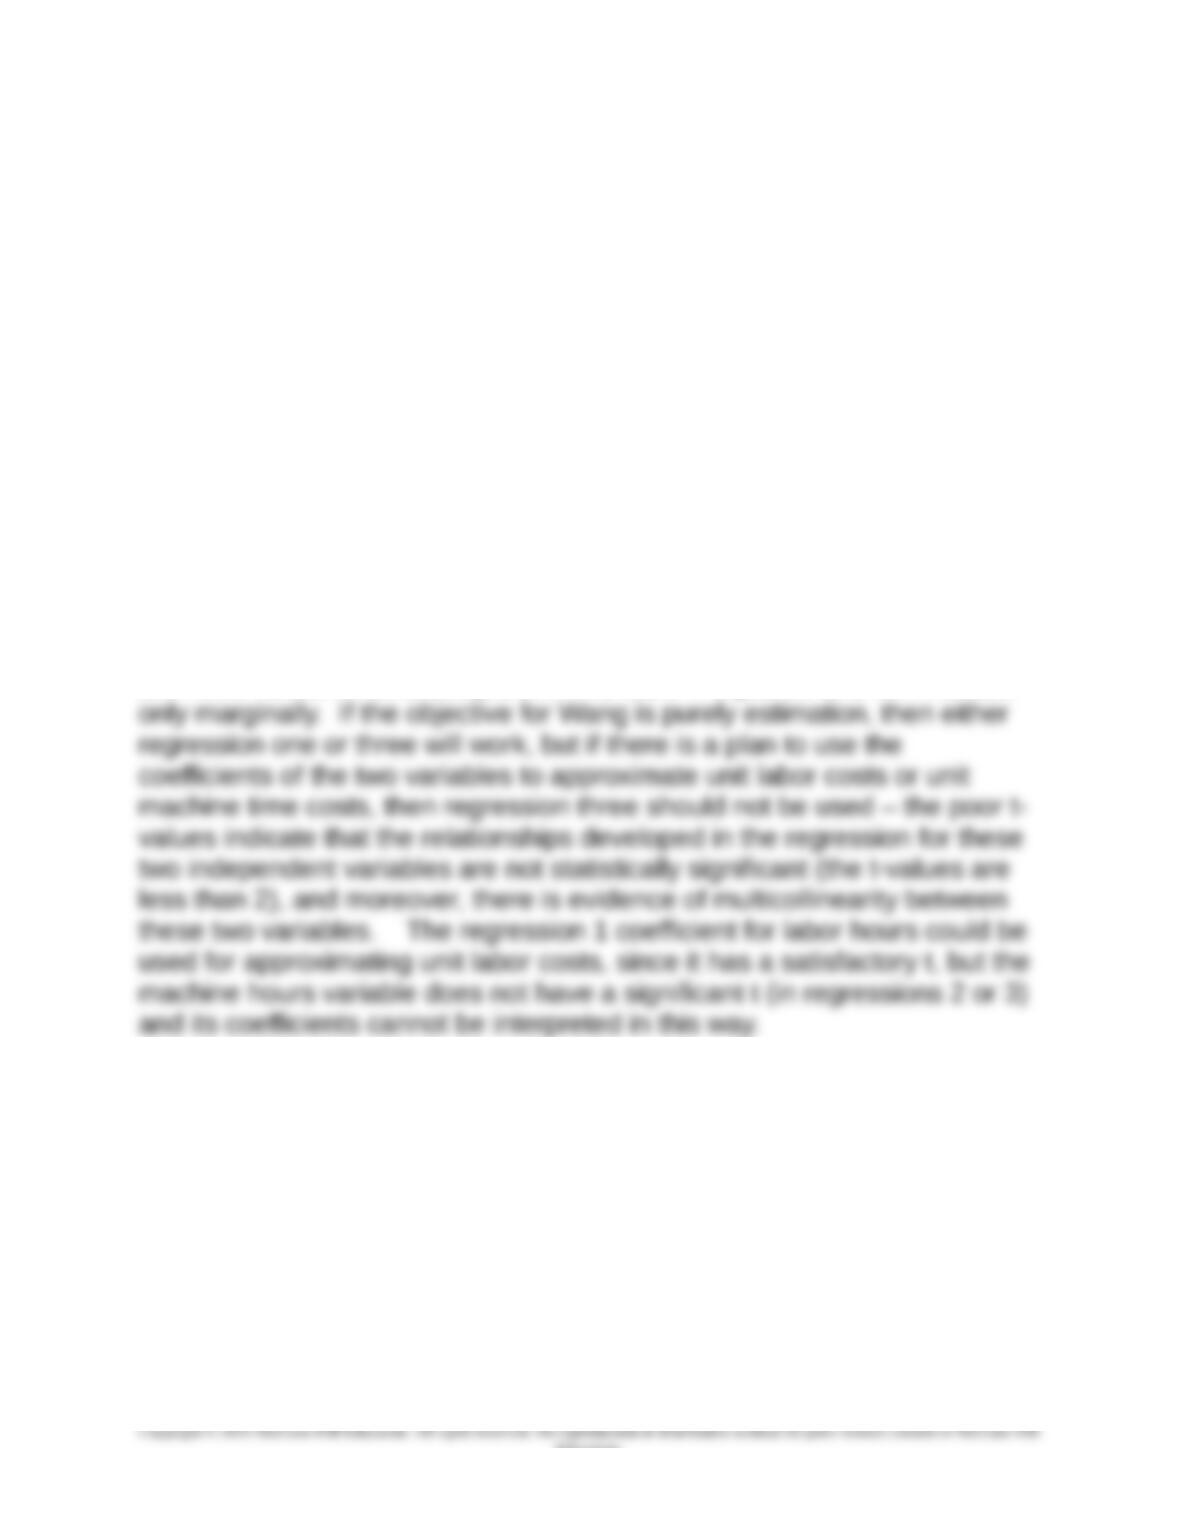
Regression one uses only labor hours, regression two uses only machine
hours, and regression three uses them both.
Regression 2 is clearly inferior as it has the lowest R-squared, the highest
SE, and an unsatisfactory t-value
Regressions 1 and 2 have comparable SE and R-squared values, though
regression 3 is marginally better. Note however, that the t-values show
that, in regression 3, labor hours is marginally satisfactory (not quite 2) and
machine hours still has an unsatisfactory t. This finding for the t-values in
regression three likely indicates that the two variables, labor hours and
machine hours, are highly correlated, and the result of combining them
shows in the decline of the t-values for both. On the other hand, the
addition of another variable to a regression usually improves R-squared
and SE (there is more opportunity to explain total variance, because there
are more variables available), but in this case R-squared and SE increase
Note also that the overall values for R-squared are relatively low, so that
limited confidence should be placed in any of the three.
8-16
Education.
Chapter 08 – Cost Estimation
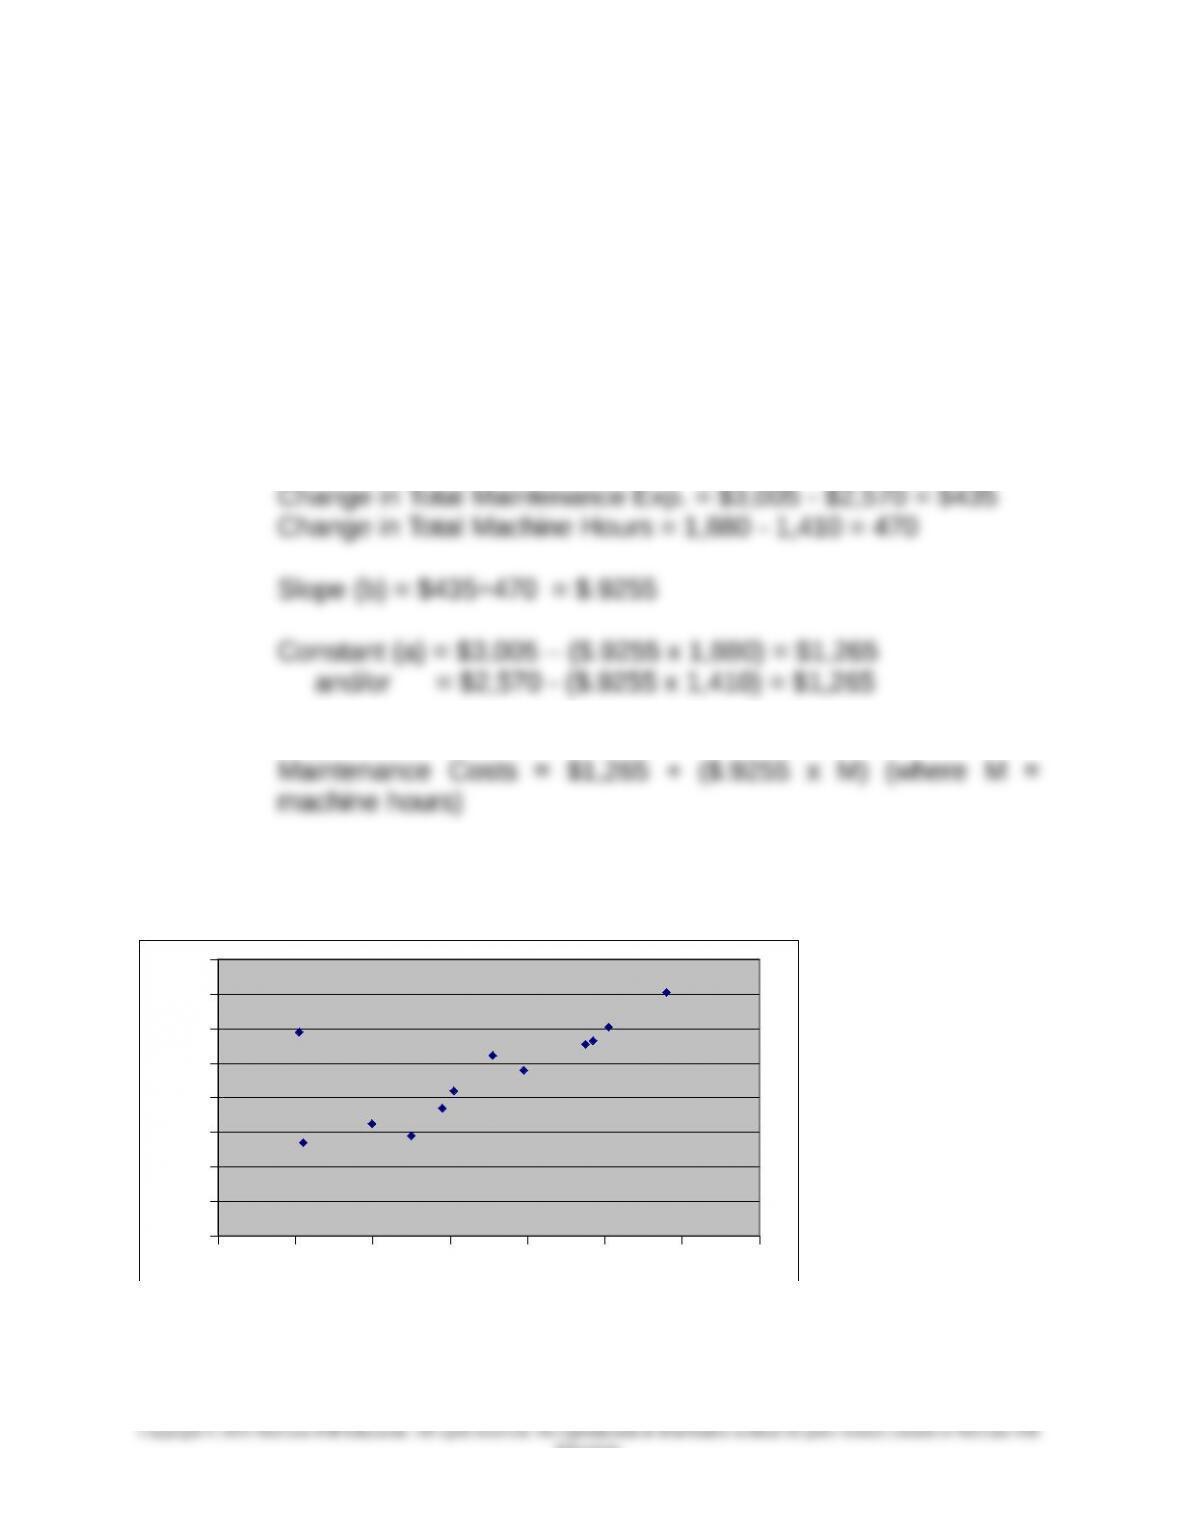
8-35 Cost Estimation: High-Low method (15 min)
1.
Model to fit: Maintenance Expense = a + (b x M) (where M =
machine hours)
The highest and lowest points are months 6 and 10, respectively.
Note that the point for month 12 is an outlier, and should not be used
as the low point; see the graph below.
The high-low method is as follows:
The equation for maintenance cost is:
The graph below shows that the selected high and low points are
representative of the data, but there is one significant outlier, the point for
month 12
1300 1400 1500 1600 1700 1800 1900 2000
2300
2400
2500
2600
2700
2800
2900
3000
3100
8-17
Education.
Chapter 08 – Cost Estimation
8-35 (continued -1)
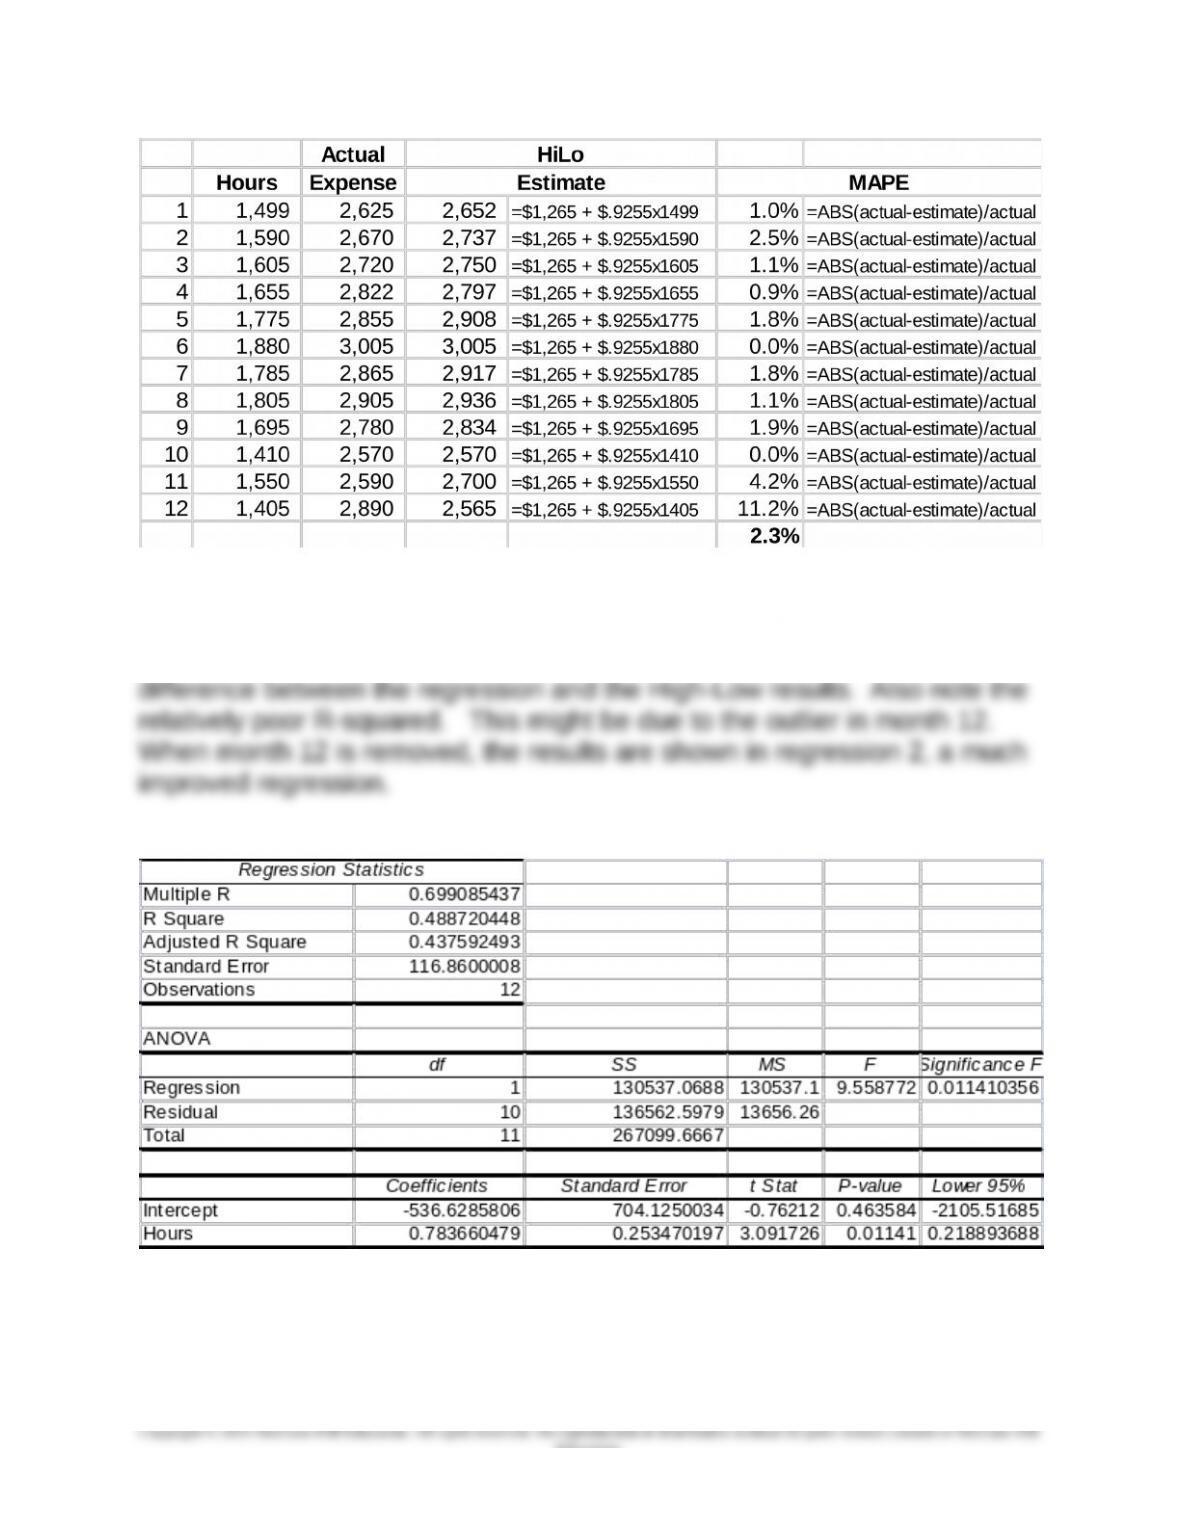
2. The mean absolute percentage error (MAPE) results are shown below.
MAPE is 2.3% for this 12 month period. Note that the outlier, point 12, has
a large MAPE. Overall, the MAPE is relatively low, due to the good fit of
the model to a set of data that is relatively linear.
8-18
Chapter 08 – Cost Estimation
8-35 (continued -2)
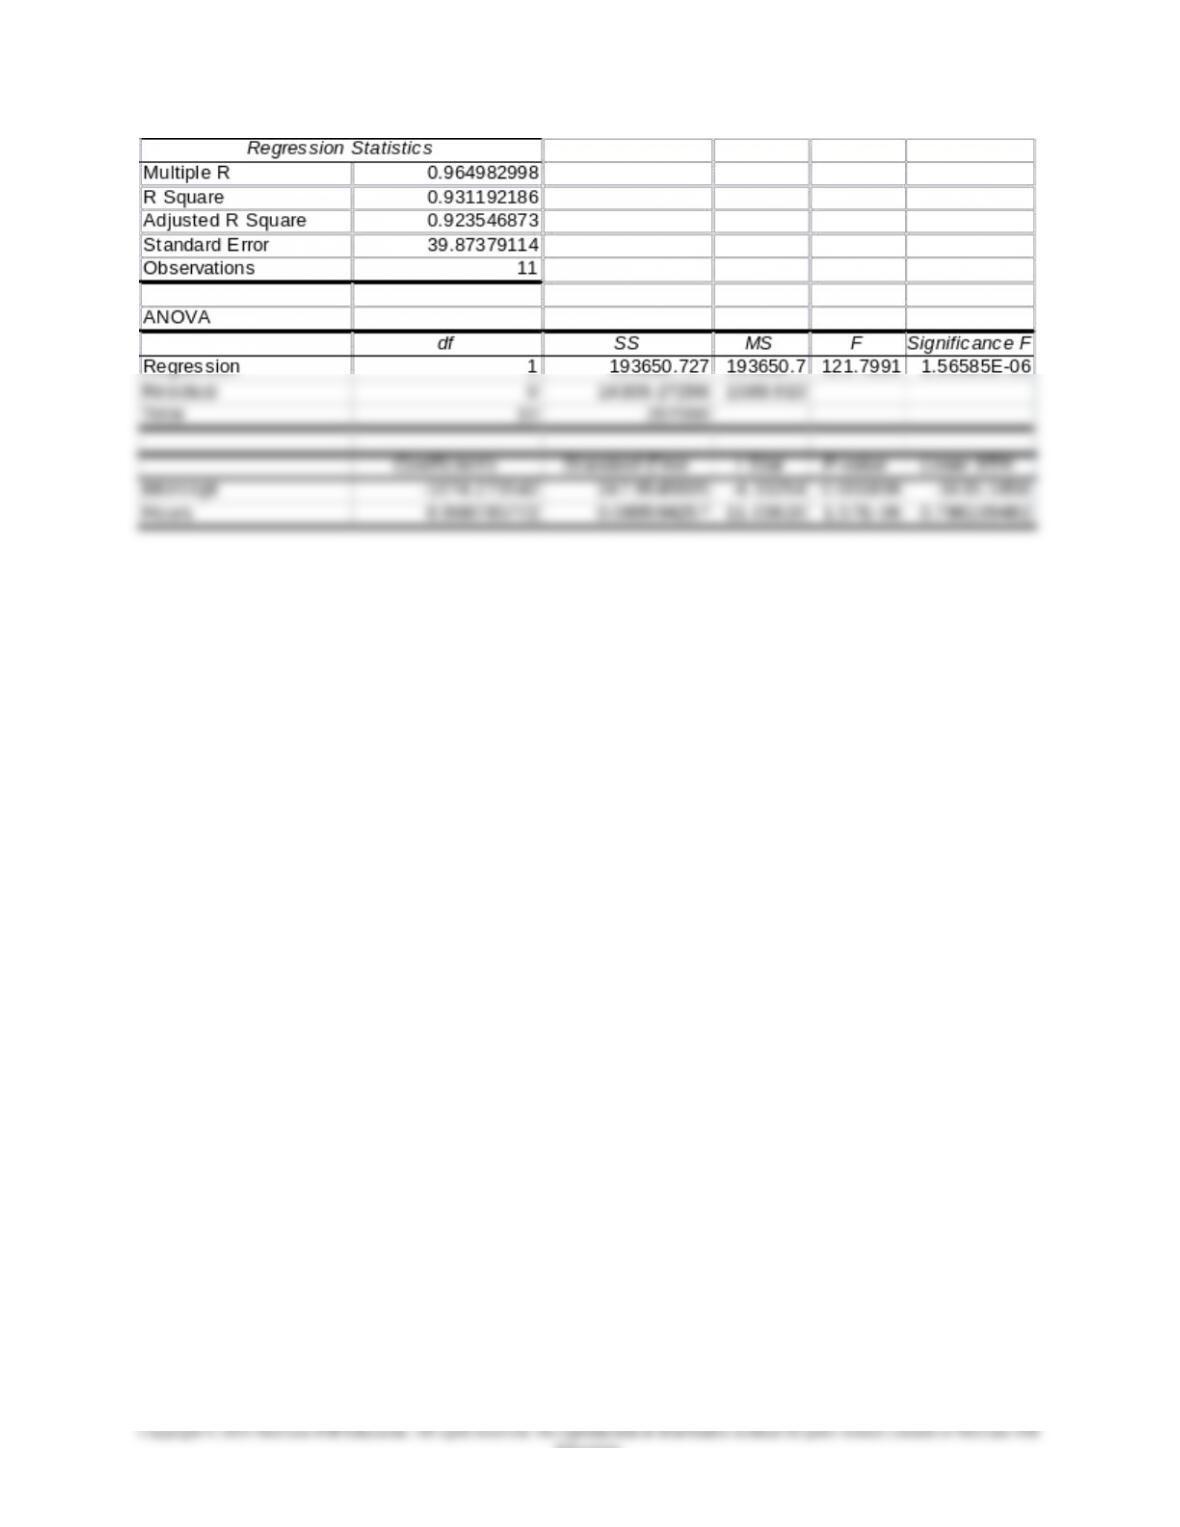
While not required for the exercise, a regression analysis on the data
produces the following results (regression 1). Note the significant
Regression 1
Regression 2
8-19
Education.
Chapter 08 – Cost Estimation
8-20
Education.