Unlock document.
This document is partially blurred.
Unlock all pages and 1 million more documents.
Get Access
Chapter 08 - Cost Estimation
CHAPTER 8: COST ESTIMATION
QUESTIONS
8-1 Cost estimation is the process of developing a well-defined relationship between
a cost object and its cost driver for the purpose of predicting the cost. The cost
predictions are used in each of the management functions:
To predict future Costs
oTo facilitate strategy development and implementation. Cost
estimates are particularly important for firms competing on the basis of
cost leadership. Cost estimates guide management in determining
which management techniques, such as business intelligence, target
selecting the particular design that provides the best value to the
customer while reducing manufacturing and other costs.
oTo facilitate effective performance measurement, evaluation, and
compensation. Cost estimates play a key role in determining costs in
business units, which affect division managers’ financial performance
8-2 The strategic role of cost estimation includes:
8-3 The two methods of cost estimation are:
a. High-Low. Because of the precision in the development of the equation, it
provides a more consistent estimate than the visual fit and is not difficult to use.
8-1
Education.
Chapter 08 - Cost Estimation
8-4 Implementation problems with cost estimation include:
(The following are taken from the section “Cost Estimation Methods,” and
from the section, “Implementation Problems: Nonlinearity.”
a. Cost estimates outside of the relevant range may not be reliable.
b. Sufficient and reliable data may not be available.
c. The length of the time period for each observation may be too long, so that the
be diminished.
g. When there is a shift in the data, as, for example, a new product is introduced
or when there is a work stoppage, the data will be unreliable for future estimates.
8-5 The six steps in cost estimation are as follows:
a. Define the cost to be estimated.
b. Determine the cost drivers.
8-6 The contrast between regression analysis and high-low analysis is as follows:
a. Regression analysis estimates the cost function by using a statistical model
8-7 Cost estimation methods could be used to help identify activity cost drivers in
activity-based costing. For example, if a firm using activity-based costing is
looking for an appropriate cost driver for materials handling, regression can be
used to determine if the best cost driver is number of parts in the product, the
8-2
Education.
Chapter 08 - Cost Estimation
8-8 The dependent variable is the cost object of interest in the cost estimation. An
important issue in selecting a dependent variable is the level of aggregation in
the variable. For example, the company, plant, or department may all be
possible levels of data for the cost object. The choice of aggregation level
8-9 Nonlinear cost relationships are cost relationships that are not adequately
explained by a single linear relationship for the cost driver. In accounting data, a
common type of nonlinear relationship is trend and seasonality. For a trend
example, if sales increase by 8% each year, the plot of the data for sales will not
be linear with the driver, the number of years. Similarly, sales which fluctuate
according to a seasonal pattern will have a nonlinear behavior. A different type of
8-10 The advantages of using regression analysis include that it:
a. Provides an estimation model with best fit (least squared error) to the data
b. Provides measures of goodness of fit and of the reliability of the model which
can be used to assess the usefulness of the specific model, in contrast to the
8-11 A dummy variable is an independent variable assigned the value of 0 or 1 in the
regression analysis. It can improve the accuracy of the regression analysis if it is
8-3
Education.
Chapter 08 - Cost Estimation
8-12 High correlation exists when the changes in the independent variables occur at
the same time as changes in the dependent variable. Correlation is a measure
of the degree of association between the two variables. Because correlation is
8-13 The coefficient of determination (R-squared) measures the degree to which
8-4
Education.
Chapter 08 - Cost Estimation
BRIEF EXERCISES
8-15 R-squared indicates the degree to which changes in the dependent variable can
be predicted by changes in the independent variable. The t-value indicates the
8-16
a = Y - (b x X)
a = $10,000 - ($1 x 7,000)
8-17
Possible independent variables for analysis of financial data include wage rate,
sales, and units produced.
8-18
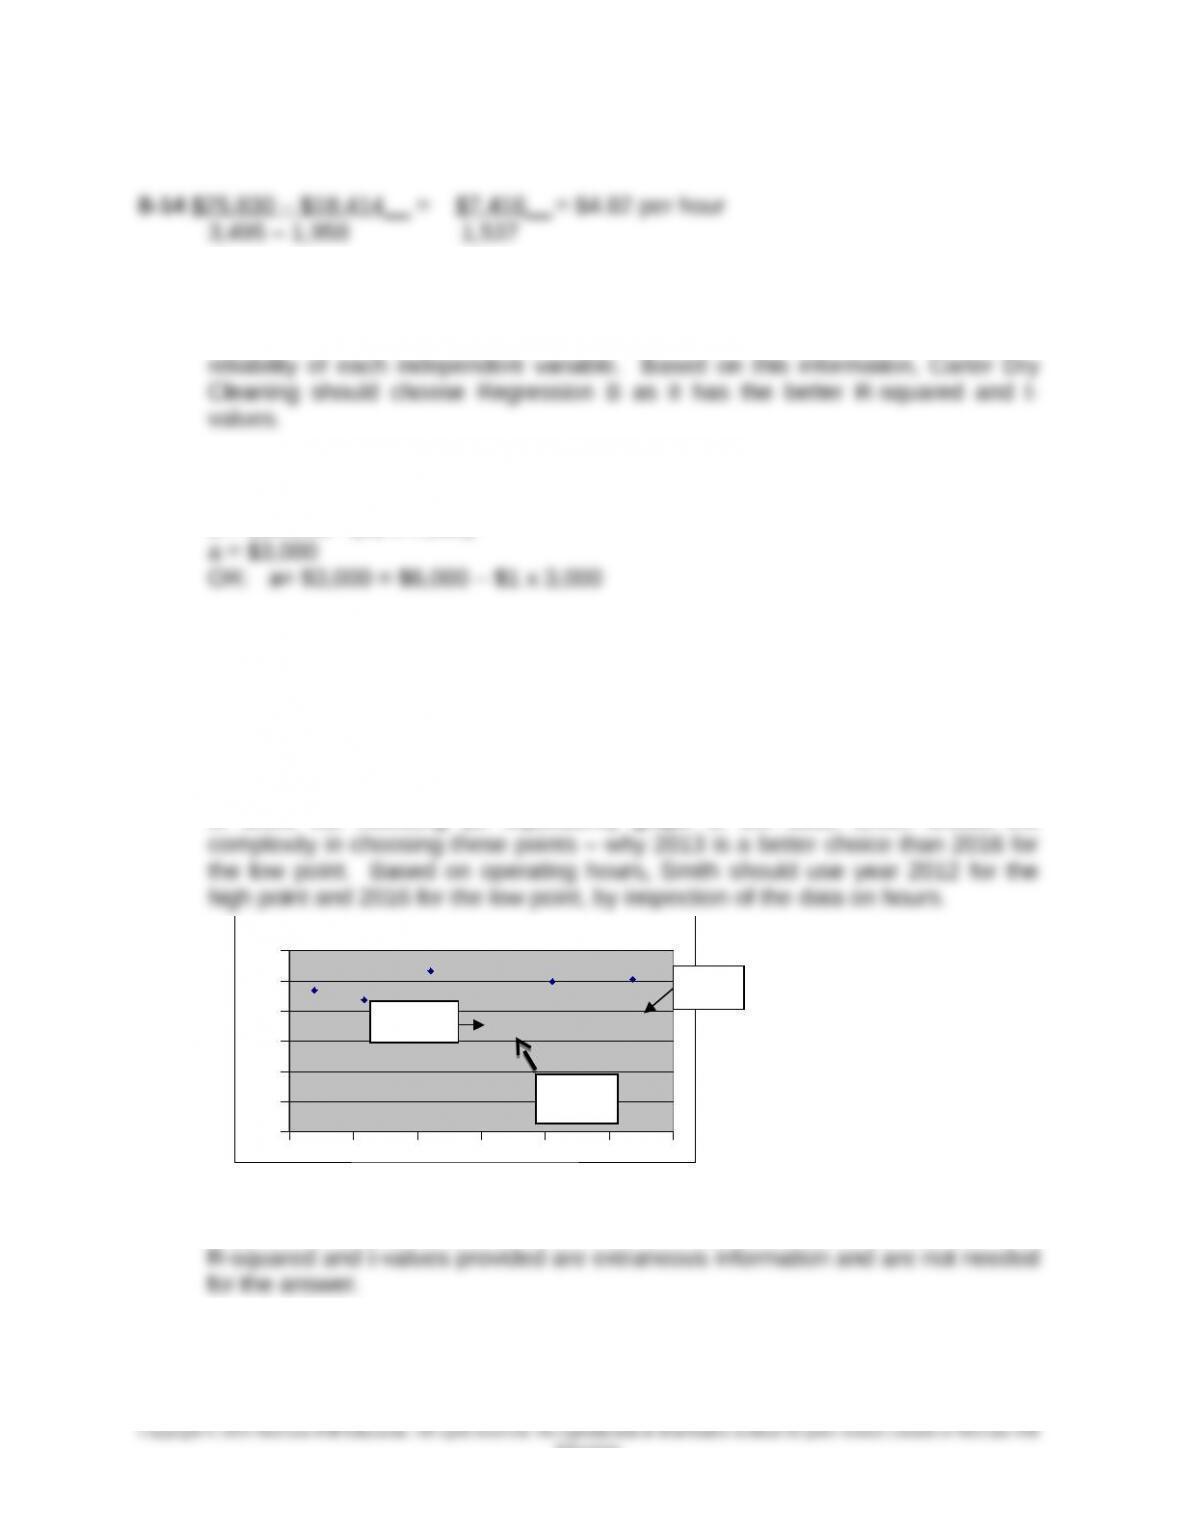
Answers are likely to vary, with 2013 or 2016 likely to chosen as the low points
and 2012 as the high point. A useful extension of this exercise in class would be
to show the following (or equivalent) graph of the data, which shows the
3,000 3,500 4,000 4,500 5,000 5,500 6,000
0
10,000
20,000
30,000
40,000
50,000
60,000
Cost
8-19
$5,000 ± $400 provides the 67% confidence interval of $4,600 to $5,400. The
8-5
Education.
2016
2012
2013
Chapter 08 - Cost Estimation
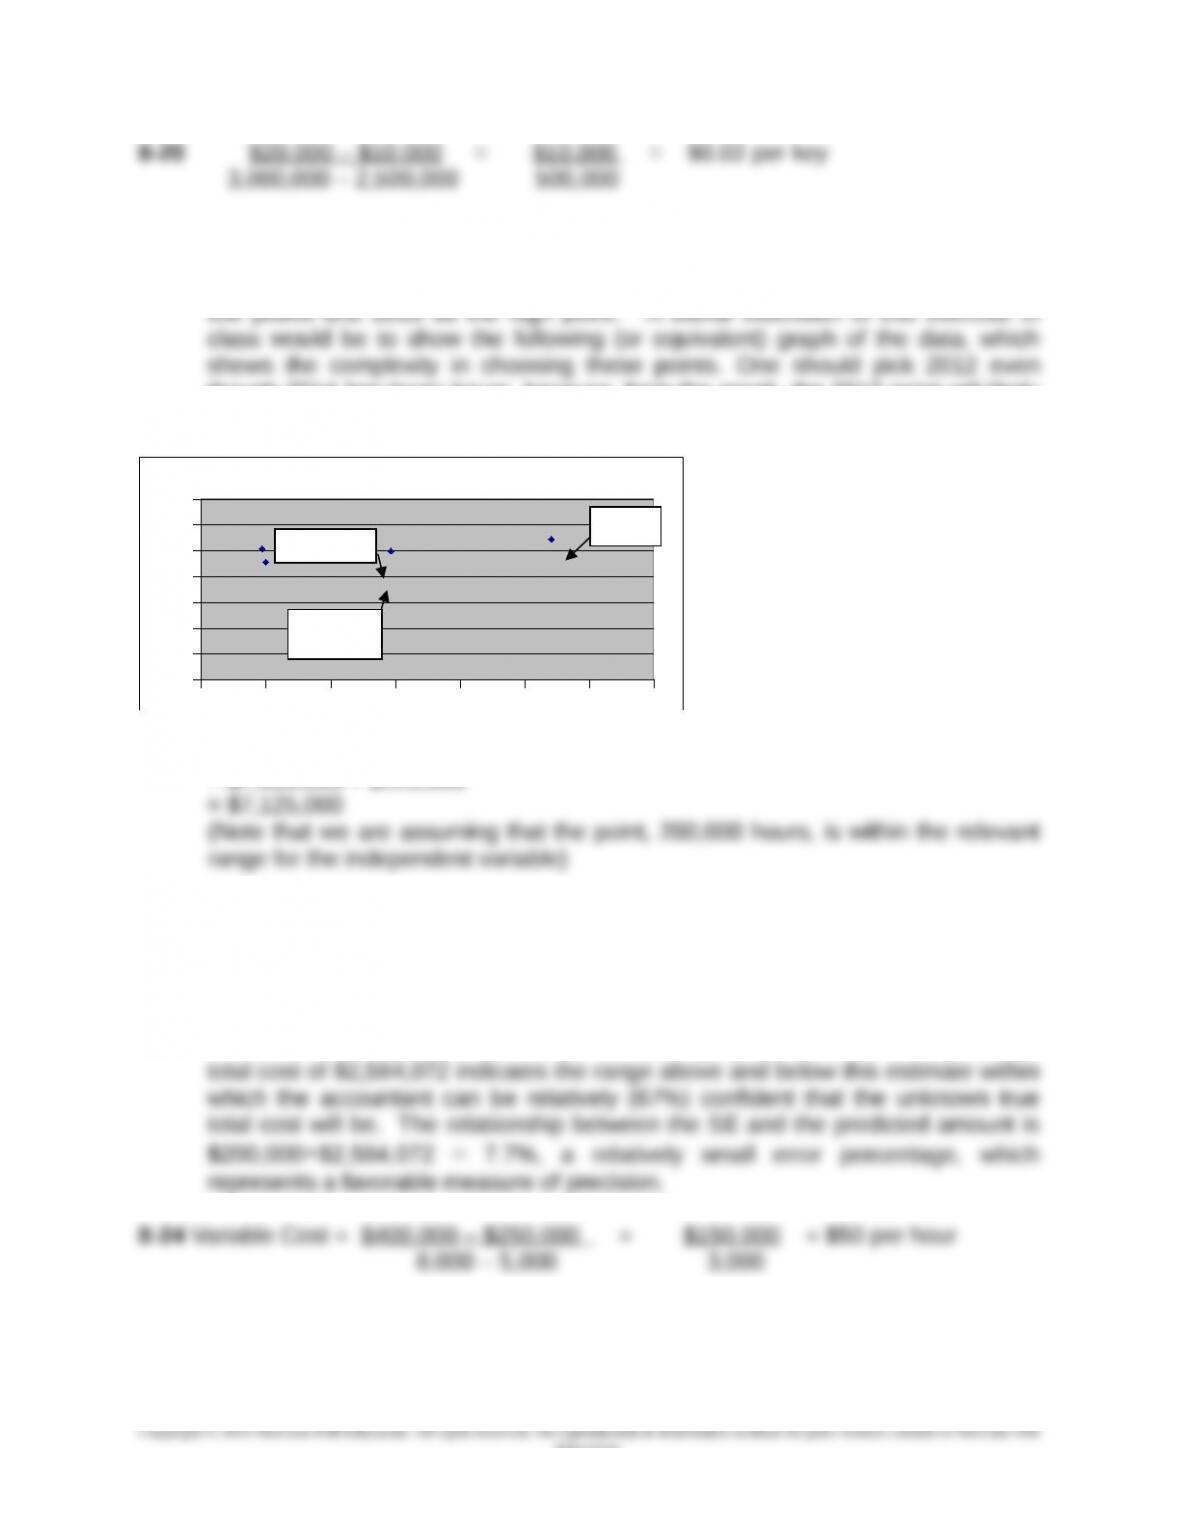
8-21
The clear choice for the high point is 2015, but the low point is more difficult to
determine. Answers are likely to vary, with 2012 or 2014 likely to chosen as the
though 2014 has lower hours, because, from the graph, the 2012 point will likely
produce a more representative estimation line.
80,000 100,000 120,000 140,000 160,000 180,000 200,000 220,000
0
100,000
200,000
300,000
400,000
500,000
600,000
700,000
Handling Cost ($)
8-22 Total Cost= 200,000 x $35 + $125,000
= $7,000,000 + $125,000
8-23
The R-squared value of .6 tells you that changes in the independent variable do
not predict changes in the dependent variable very well; usually we would expect
the R-squared to be above approximately 80%. The t-value of 2.3 indicates there
is a reasonably reliable relationship between the independent and dependent
variables. The standard error of the estimate (SE) of $200,000 on a predicted
8-6
Education.
2012
2014
2015
12
Chapter 08 - Cost Estimation
8-25 a = $80,000 - (30,000 x $2)
= $80,000 - $60,000
8-26 Total cost for bandwidth of 9 GB would be the minimum charge of $45
8-7
Education.
Chapter 08 - Cost Estimation
EXERCISES
8-27 Estimating Costs in an Uncertain Environment (10 min)
Southwest Airlines updates its cost estimates as follows:
1. Labor Costs : Southwest Airlines (SW) updates its estimates of
labor costs twice a month
2. Fuel costs: SW updates these estimates weekly
Fuel costs are updated most frequently because of the volatility in aircraft
gasoline costs; the fluctuations in these costs mirrors the wide fluctuations
in the costs of gasoline and home heating oil that affect consumers broadly.
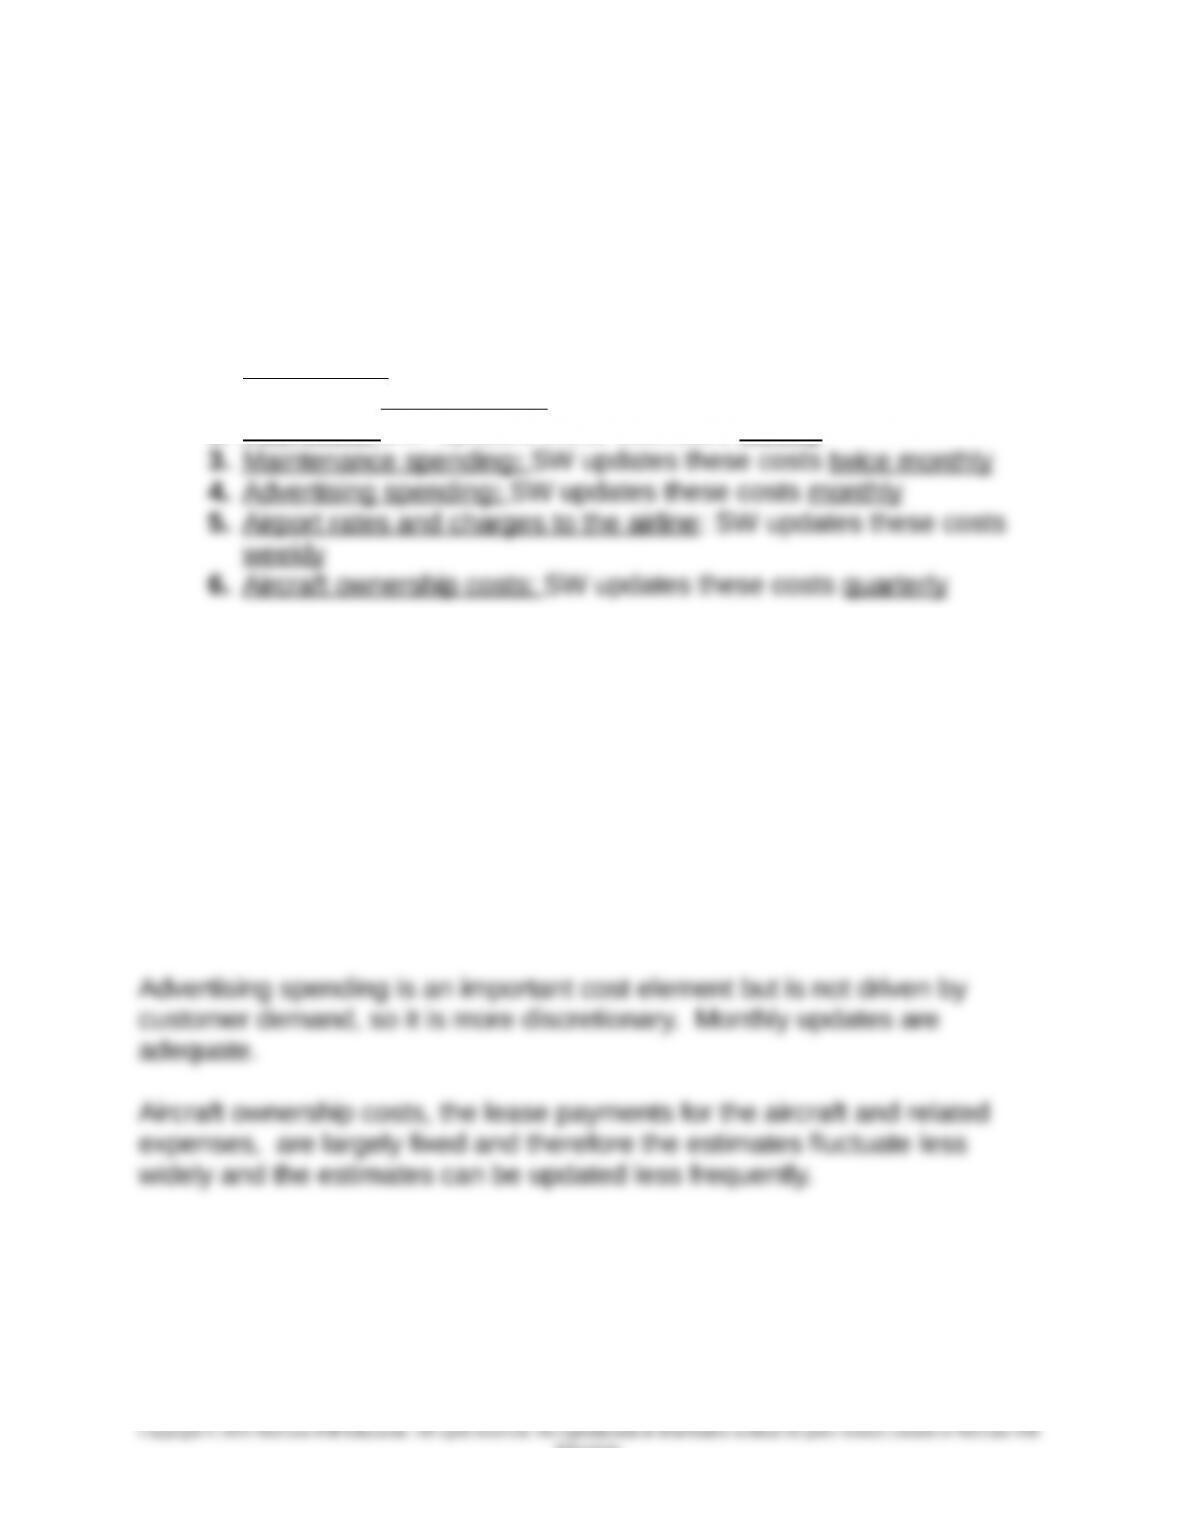
Labor costs, maintenance spending, and airport fees are managed by the
airline by careful scheduling of employees and aircraft maintenance as
flight demand fluctuates, and by carefully scheduling the use of airport
gates and services. Fuel and labor costs are also the two largest cost
elements for SW, so that more careful and more frequent cost estimates
are used for these two cost elements.
Source: Matthew G. Lamoreaux, “Planning for Uncertainty,” Journal of
Accountancy, October 2011, pp 32-37.
8-8
Education.
Chapter 08 - Cost Estimation
8-28 Regression Analysis and the Insurance Industry (15 min)
1. As noted in the question, data mining is used in certain industries to
help companies in selecting the most profitable products and
services, setting prices, and increasing consumer demand for their
2. The potential ethical issue is privacy. When customers use their
loyalty card, they may not be aware that the company is using this
data to target products and services to them. Additionally, as noted
in an article by Thomas H. Davenport and Jeanne G. Harris,
companies sometimes sell or share this data in a way that could be
medical claims.
Source: Thomas H. Davenport and Jeanne G. Harris, “The Dark Side of
Customer Analytics,” Harvard Business Review, May 2007, pp 37-41; see
also, Charles Duhigg, “How Companies Learn Your Secrets,” The New
York Times Magazine, February 19, 2012, pp. 32-55; and General
Electric’s $1 billion investment in predictive analytics, Tim Catts, “GE
Heads West With $1 Billion to Spend,” Bloomberg Businessweek, April
30, 2012, pp. 38-39.
8-9
Education.
Chapter 08 - Cost Estimation
8-29 Cost Classification (15 min)
8-10


