Unlock document.
This document is partially blurred.
Unlock all pages and 1 million more documents.
Get Access

Chapter 08 - Cost Estimation
Chapter 8
Cost Estimation
Learning Objectives
1. Explain the strategic role of cost estimation.
2. Apply the six steps of cost estimation.
3. Use each of the cost estimation methods: the high-low method and regression analysis.
4. Explain the implementation issues of the cost estimation methods.
5. Use learning curves in cost estimation when learning is present (appendix).
New in this Edition
One new Real World Focus item on predictive analytics and learning curves; completely
revised and updated Real World Focus item on application of predictive analytics and
regression analysis, and update of surveys of cost estimation practice
Additional coverage to explain the relative advantages of the high-low method and the
regression method
Three new problems and 9 revised exercises and problems include a focus on application
of regression analysis to practical current business issues
Teaching Suggestions
The chapter can be covered in one to three days, depending on the depth of desired coverage.
Coverage in one day would be sufficient for the chapter material excluding the appendix and the online
regression analysis supplement, but including an introduction to all the cost estimation methods and a
good introduction to regression analysis. In two or three days, the coverage can be extended to include a
more thorough development of regression analysis, to include all the statistical modeling problems such
as non-homogeneity, non-normality, non-linearity that are included in the online regression analysis
supplement. Also, careful coverage of learning curves should require the better part of or an entire class
meeting (Appendix). I’ve done it all three ways with very good results each time.
When the coverage is a single day I focus on the high-low method and regression analysis. In the
high-low method I stress the importance of carefully picking the high and low points. I suggest it is a very
good idea to use a graph and visually inspect the high and low points they are choosing to see if the line
between them is representative of the data. I use an example of a high or low point which is an outlier for
the data to illustrate the importance of this idea. I also suggest that studying the graph is important for
regression analysis as well, for the purpose of identifying outliers and potential non-linearity. I put all my
examples into EXCEL and show the graphs and regression results in EXCEL. When the coverage is a
single day I confine the coverage of regression to what is in the chapter and exclude the online regression
analysis supplement. My focus is on having the student understand and use the four key concepts: R-
squared, t-value, p-value, and standard error of the estimate. I show that these values are given in the
EXCEL regression results and are thus readily available. I go through a few problems to show how to
choose the best of a set of regressions by reference to these three statistical values. I emphasize that the t-
value can be positive or negative, but that the value of the t-value should be greater than 2. Without this
emphasis, I find that many students will interpret a negative t-value as a sign of a poor regression.
The strategic role of cost estimation is presented early in the chapter. The point is that projections
of future costs and other information play a key role in strategic management planning.
8-1
Chapter 08 - Cost Estimation
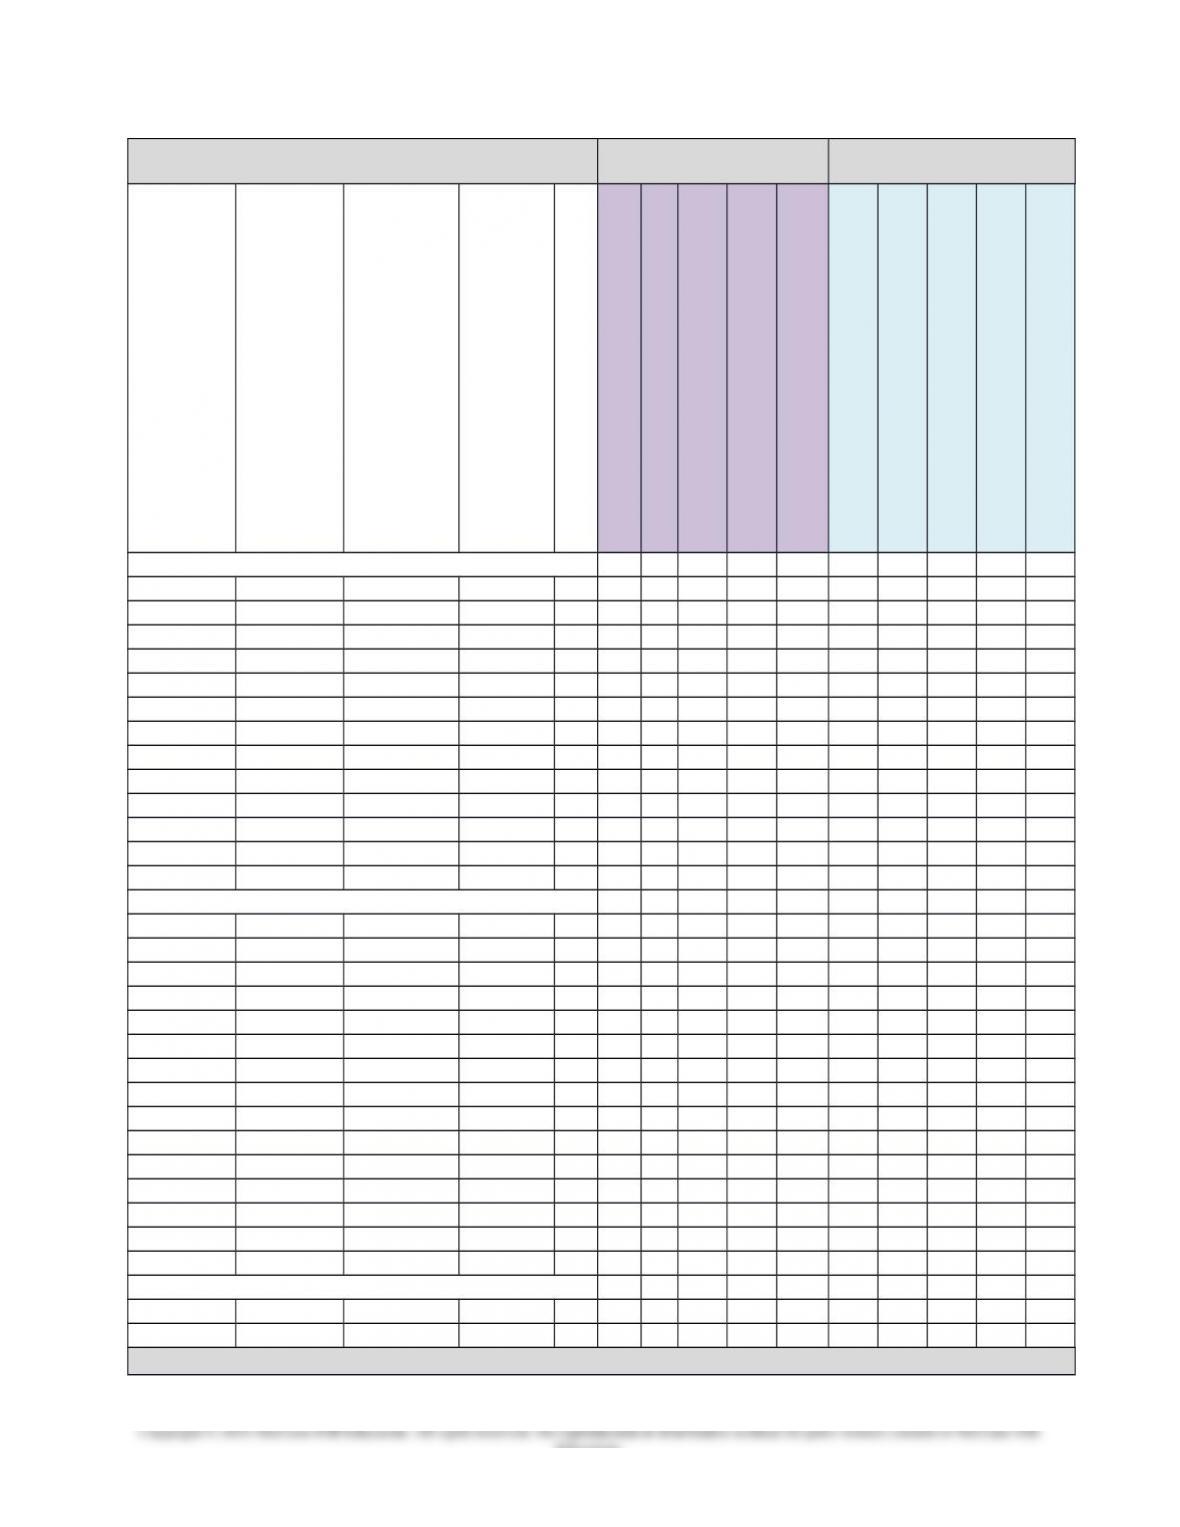
Assignment Matrix Chapter 8
Exercises and Problems
Learning Objectives Text Features
7e
6e
Transition
6e to 7e
Time
Connect
1.
Strategic role of cost estimation
2.
Applying the steps of cost estimation
3.
Using methods of cost estimation
4.
Implementation problems - nonlinearity
5.
Use learning curves
Strategy
Service
International
Ethics
Sustainability
Brief Exercises
8-14 8-14 5 min. X X
8-15 8-15 5 min. X
8-16 8-16 5 min. X X
8-17 8-17 5 min. X X
8-18 8-18 5 min. X
8-19 8-19 5 min. X X
8-20 8-20 5 min. X X
8-21 8-21 5 min. X
8-22 8-22 5 min. X X
8-23 8-23 5 min. X X
8-24 8-24 5 min. X X
8-25 8-25 5 min. X X
8-26 8-26 5 min. X X
Exercises
8-27 8-27 10 min. X X
8-28 8-28 15.min. X X
8-29 8-29 15 min. X X
8-30 8-30 10 min. X X X
8-31 8-31 15 min. X
8-32 8-32 15 min. X X
8-33 8-33 15 min. X X
8-34 8-34 10 min. X
8-35 8-35 15 min. X X
8-36 8-36 30 min. X X
8-37 8-37 20 min. X
8-38 8-38 20 min. X X X
8-39 8-39 10 min. X X X
8-40 8-40 10 min. X X X
8-41 8-41 15 min. X X
Problems
8-42 8-42 Revised 30 min. X X X X
8-43 8-43 Revised 25 min. X X X
Continued on next page…
8-2
Education.
Chapter 08 - Cost Estimation
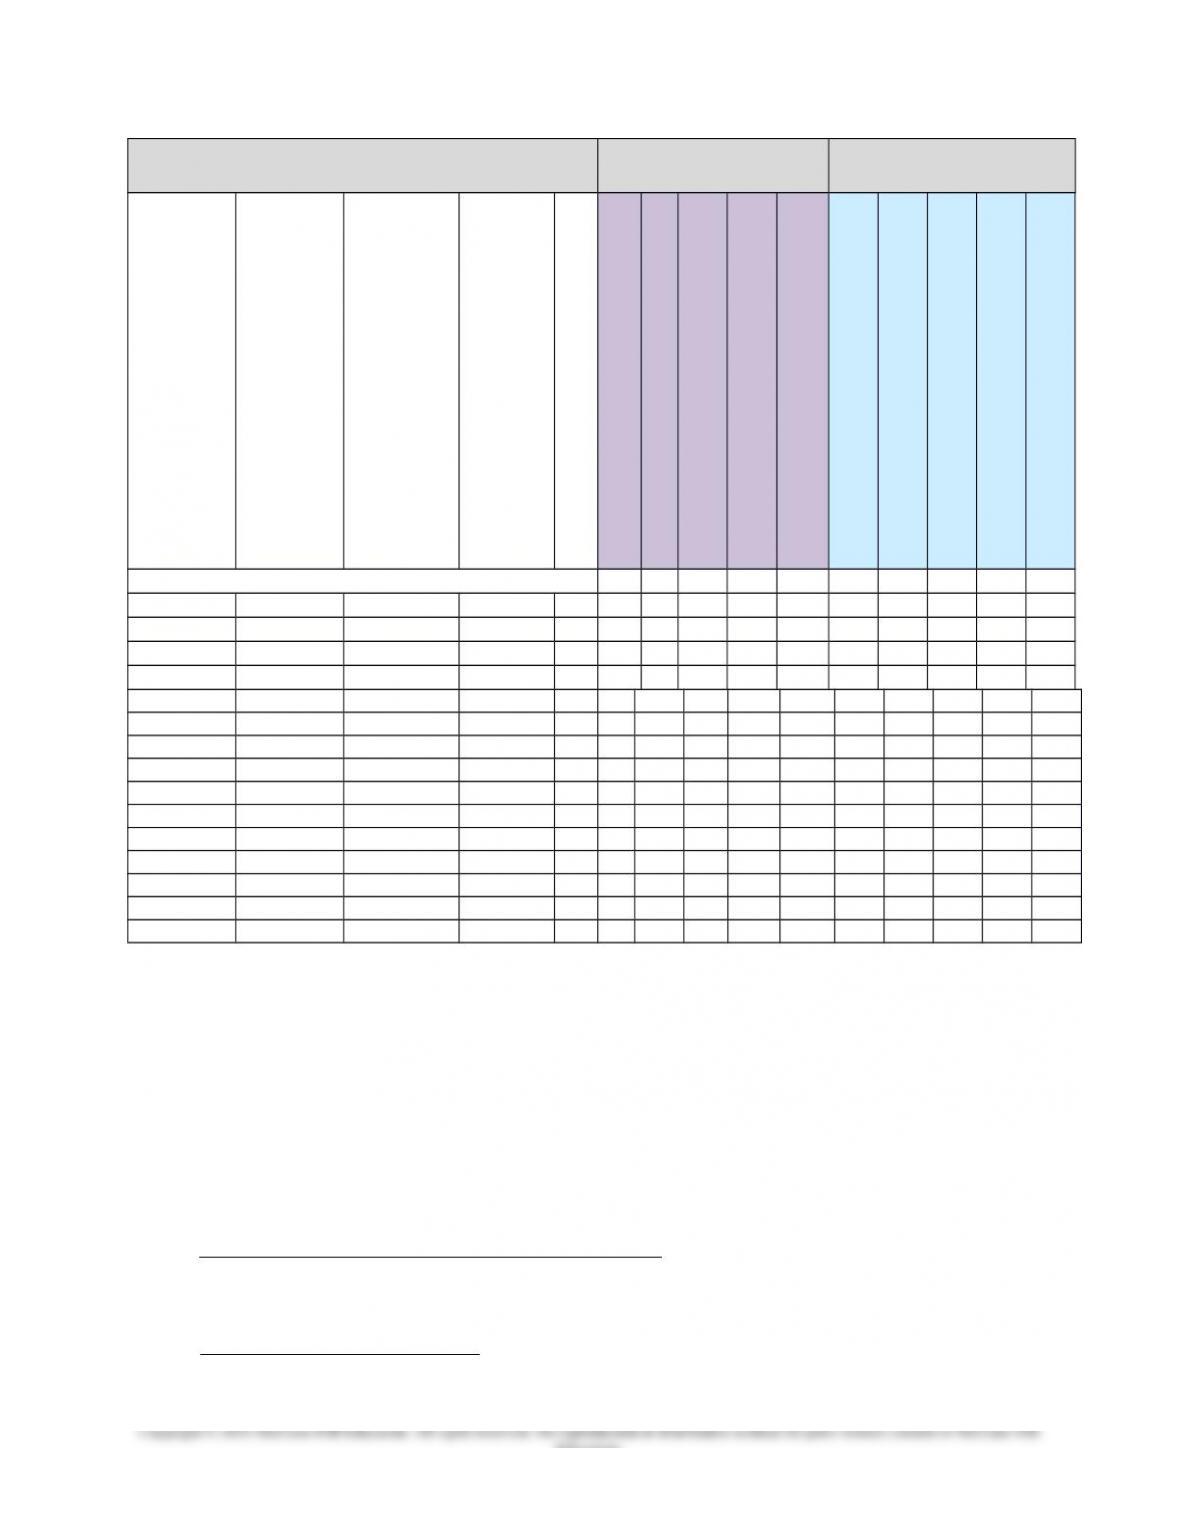
Assignment Matrix Chapter 8
(continued)
Learning Objectives Text Features
7e 6e
Transition
6e to 7e
Time
Connect1.
Strategic role of cost estimation
2.
Applying the steps of cost estimation
3.
Using methods of cost estimation
4.
Implementation problems - nonlinearity
5.
Use learning curves
Strategy
Service
International
Ethics
Sustainability
Problems (continued)
8-44 8-44 Revised 25 min. X
8-45 8-45 20 min. X X X X
8-46 8-46 Revised 20 min. X X
8-47 8-47 Revised 15 min. X X
8-48 8-48 20 min. X X
8-49 8-49 30 min. X X
8-50 8-50 Revised 50 min. X
8-51 8-51 20 min. X X
8-52 8-52 Revised 20 min. X X
8-53 8-53 Revised 30 min. X X X
8-54 8-54 50 min. X X
8-55 New in 7e 35 min. X X
8-56 8-55 50 min. X
8-57 8-56 30 min. X X X
8-58 8-57 Revised 20 min. X
Lecture Notes
A. Strategic Role of Cost Estimation. Cost estimation is the development of a well-defined
relationship between a cost object and its cost drivers for the purpose of predicting the cost. Cost
estimation facilitates strategic management by predicting future costs using previously identified cost
drivers and by identifying the key cost drivers for a cost object and which of these cost drivers are the
most useful in predicting cost.
1. Using Cost Estimation to Predict Future Costs.
a. To facilitate strategy development and implementation. Cost estimations are particularly important
for firms with a cost leadership strategy. Also, cost estimation guides management is determining
which contemporary management techniques to employ in the organization.
b. To facilitate value-chain analysis. Cost estimation helps the firm identify potential opportunities
for cost reduction by reconfiguring the value chain.
8-3
Education.

Chapter 08 - Cost Estimation
c. To facilitate target costing and pricing. Management uses cost estimations of different product
designs as part of the process of selecting the particular design that provides the best trade-off of
customer value versus manufacturing costs. Also, cost estimates are used in strategic and cost-plus
pricing.
d. To facilitate effective performance measurement, evaluation and compensation. Cost estimates
play a key role in determining costs in business units, which affect division managers’ financial
performance and opportunity for promotion and compensation, and the ability to attract capital
investment to their division. Accurate cost estimates play a crucial role in performance measurement
which is covered in chapters 18 through 20.
8-4
Education.

Chapter 08 - Cost Estimation
2. Cost Estimation for Different Types of Cost Drivers. The relationships between costs and activity-
based or volume-based cost drivers often are the best fit by linear cost estimation methods, since these
relationships are approximately linear within the relevant range of the firm’s operations. Structural cost
drivers involve plans and decisions that have a long-term, strategic impact on the firm. Technology and
complexity issues often lead management to use activity-based cost drivers and linear estimation
methods. In contrast, executional and structural cost drivers often require nonlinear methods.
3. Using Cost Estimation to Identify Cost Drivers. Often times the most practical way to identify cost
drivers is to rely on the judgment of product designers, engineers, and manufacturing personnel. Cost
estimation sometimes plays a discovery role and at other times a collaborative role to validate and
confirm the judgments of the designers and engineers.
B. Six Steps of Cost Estimation.
1. Define the Cost Object to Be Estimated. Defining the particular cost to be estimated depends on the
goal the cost estimation is designed for.
2. Determine the Cost Drivers. Identifying cost drivers is the most important step in developing the
cost estimation. A number of relevant drivers may exist, and some might not be immediately obvious.
3. Collect Consistent and Accurate Data. Once the cost drivers have been selected, the management
accountant collects consistent and accurate data on the cost object and drivers. Consistent means the each
period of data is calculated on the same accounting basis and all transactions are properly recorded in the
period in which they occurred. The accuracy of the data depends on the nature of the source. The choice
of cost driver requires trade-offs between the relevance of the drivers and the accuracy of the data.
4. Graph the Data. The objective of graphing data is to identify unusual patterns. Any shift or
nonlinearity in the data must be given special attention in developing the estimate.
5. Select and Employ the Estimation Method. The three estimation methods presented in this chapter
differ in their ability to provide superior accuracy in cost estimation relative to the cost of the expertise
and resources required. The management accountant chases the method with the best precision/cost
trade-off for the estimation objectives.
6. Assess the Accuracy of the Cost Estimation. A critical final step is to consider the potential for error
when the estimate is prepared. This involves considering the completeness, precision, and accuracy of all
the previous steps.
C. Cost Estimation Methods. The wo methods are the high-low method and regression analysis. The
methods are listed from least to most accurate. However, the cost and effort in employing the methods
are inverse to this sequence; the high-low method is the easiest and least costly, and the regression
analysis is both the most accurate and most costly.
8-5
Education.

1. High-Low Method. The high-low method uses algebra to determine a unique estimation line between
representative high and low points in the data. The high-low method adds a degree of quantitative
precision to the estimation, which is based on a unique cost line rather than a rough estimate based on a
view of the graph. Also, it allows for future additional information to be added. To use the method, first
enter the data into a graph, next select two points from the data, one representative of the lower point and
the other representative of the higher points. Often, these can be the lowest and highest points in the data.
However, both points must always be representative of the data around them. The high estimate is
represented as follows:
Y = a + b × H
where: Y = the value of the estimated cost
H = the cost driver
a = a fixed quantity that represents the value of Y when H = zero
b = the slope of the line
To obtain the points, draw a freehand line through the data graph. Then, choose a high and a low point
reasonably close to the line. The key advantage of the high-low method is to provide a precise
mathematical cost equation. However, the high-low method is limited, it can represent only the best
possible line for the selected points, and the selection of points requires judgment. The other two
methods are more accurate because they use statistical estimation, which provides greater mathematical
precision. The accuracy of the high-low method can be evaluated only subjectively.
2. Regression Analysis. Regression analysis is a statistical method for obtaining the unique cost-
estimating equation the best fits a set of data points. Regression analysis fits the data by minimizing the
sum of the squares of estimation error. Each error is the distance measured from the regression line to
one of the data points. Because it minimizes the estimation errors in this way, regression analysis is also
called least squares regression. A regression analysis has two types of variables. The dependent variable
is the cost to be estimated. The independent variable is the cost driver used to estimate the amount of the
dependent variable. Simple regression uses only one independent variable, while multiple regression uses
two or more cost drivers. Similar to the high-low method, the regression equation has both an intercept
and a slope. In addition, the amount of the estimations error is considered as well:
Y = a + bX + e
where: Y = the amount of the dependent variable, the cost to be estimated.
a = a fixed quantity, also called the intercept or constant term, which represents the amount
of Y when X = 0.
X = the value for the independent variable, the cost driver for the cost to be estimated; there
may be one or more cost drivers.
b = the unit variable cost, also called the coefficient of the independent variable, that is, the
increase in Y (cost) for each unit increase in X (cost driver).
e = the regression error, which is the distance between the regression line and the data point.
Regression analysis gives management accountants an objective, statistically precise method to estimate
costs. Its principal advantage is a unique estimate that produces the least estimate error for the data.
However, since the errors are squared to find the best fitting line, the regression analysis can be
influenced strongly by unusual data points called outliers, with the result that the estimation line is mot
representative of most of the data. To prevent this distortion, management accountants often prepare a
graph of the data prior to using regression and determine whether any outliers are present.
8-6

Chapter 08 - Cost Estimation
a. Choosing the dependent variable. Development of a regression analysis begins with the choice of
the cost object, the dependent variable. The choice of aggregation level of the variable depends on
the objectives for the cost estimation. When a key objective is accuracy, a detailed level of analysis
often is preferred.
b. Choosing the independent variables (cost drivers). To identify the independent variables,
management accountants consider all financial, operating, and other economic data that might be
relevant for estimating the dependent variable. The goal is to choose variables that are relevant and
that do not duplicate other independent variables. Another type of variable, called a dummy variable,
represents the presence or absence of a condition.
c. Evaluating a regression analysis. In addition to a cost estimate, regression analysis also provides
quantitative measures of its precision and reliability. Precision refers to the accuracy of the estimates
from the regression, and reliability indicates whether the regression reflects actual relationships
among the variables. Three key measures are explained here: R-squared (also called the coefficient of
determination), the t-value, and the standard error of the estimate (SE).
R-squared is a number between 1 and 0 often described as a measure of the explanatory power of the
regression; that is, the degree to which changes in the dependent variable can be predicted by changes
in the independent variables. A more reliable regression is one that has an R-squared close to 1.
The t-value is a measure of the reliability of each independent variable. Reliability is the degree to
which an independent variable has a valid, stable, long-term relationship with the dependent variable.
A relatively small t-value (generally, the t-value should be more than 2) indicates little or no
relationship between the independent and dependent variables. When two or more independent
variables exist, the presence of a low t-value for one or more is a possible signal of what is called
multicollinearity, which means that two or more independent variables are highly correlated with each
other. The effect of multicollinearity is that the regression is less reliable and estimate is less
accurate.
The p-value measures the risk that a particular independent variable has only a chance relationship to
the dependent variable. Generally, management accountants look for p-values (the level of risk) to be
less than approximately 5%.
The standard error of the estimate (SE) is a measure of the accuracy of the regression’s estimates. It
is a range of the regression estimate in which one can be reasonably sure that the unknown actual
value will fall. Because it is used to measure a confidence range, the SE must be interpreted by its
relationship to the average size of the dependent variable. If the SE is small relative to the dependent
variable, the precision of the regression can be assessed as relatively good. How small the SE value
must be for a favorable precision evaluation is a matter of judgment, but a threshold of approximately
5 to 10 percent of the average of the dependent variable can be used.
8-7
Education.

Chapter 08 - Cost Estimation
D. Implementation Problems: Nonlinearity.
1. Trend and/or seasonality. A common characteristic of accounting data is a significant trend that results
from changing prices and/or seasonality that can affect the precision and reliability of the estimate. When
trend or seasonality is present, a linear regression is not a good fit to the data, and the management
accountant should use a method to deseasonalize or to detrend a variable. The most common methods to
do this are:
Use of a price index to adjust the values of each variable to some common time period.
Use of a decomposition technique that extracts the seasonal, cyclical, and trend components
of the data series.
Use of a trend variable, which takes on values of 1,2,3… for each period in sequence.
Replacement of the original values of each of the variables with the first differences. First
differences for each variable is the difference between each value and the succeeding value in
the time series.
2. Outliers. Because outliers can significantly decrease the precision and reliability of the estimate, they
should be corrected or adjusted, if it is clear that they are unusual or nonrecurring.
3. Data Shift. On contrast to the outlier, if the unusual business condition is long lasting, the average
direction of the data has a distinct shift that should be included in the estimate.
E. Learning Curve Analysis
One prominent example of nonlinear cost behavior is a cost influenced by learning. When an
activity has a certain labor component and repetition of the same activity or operation makes
the labor more proficient, the task is completed more quickly with the same or a higher level
of quality. Learning can occur in a wide variety of ways, from the individual level as new
employees gain experience, to the aggregate level in which a group of employees experiences
improvement in productivity. An example of a learning curve and how the learning rate applies is
illustrated below, for a case involving a learning rate of 80%; the average cumulative operating time falls
by 80% as output doubles.
8-8
Education.


