Chapter 5 – Activity-Based Costing and Customer Profitability Analysis
5-38 (continued)
3. The total value chain cost provides the firm a long-term perspective of
the product cost, in addition to the short term manufacturing cost.
Different industries have different cost structures. For example, firms in
5-39 Resource and Activity-Based Cost Drivers (25 min)
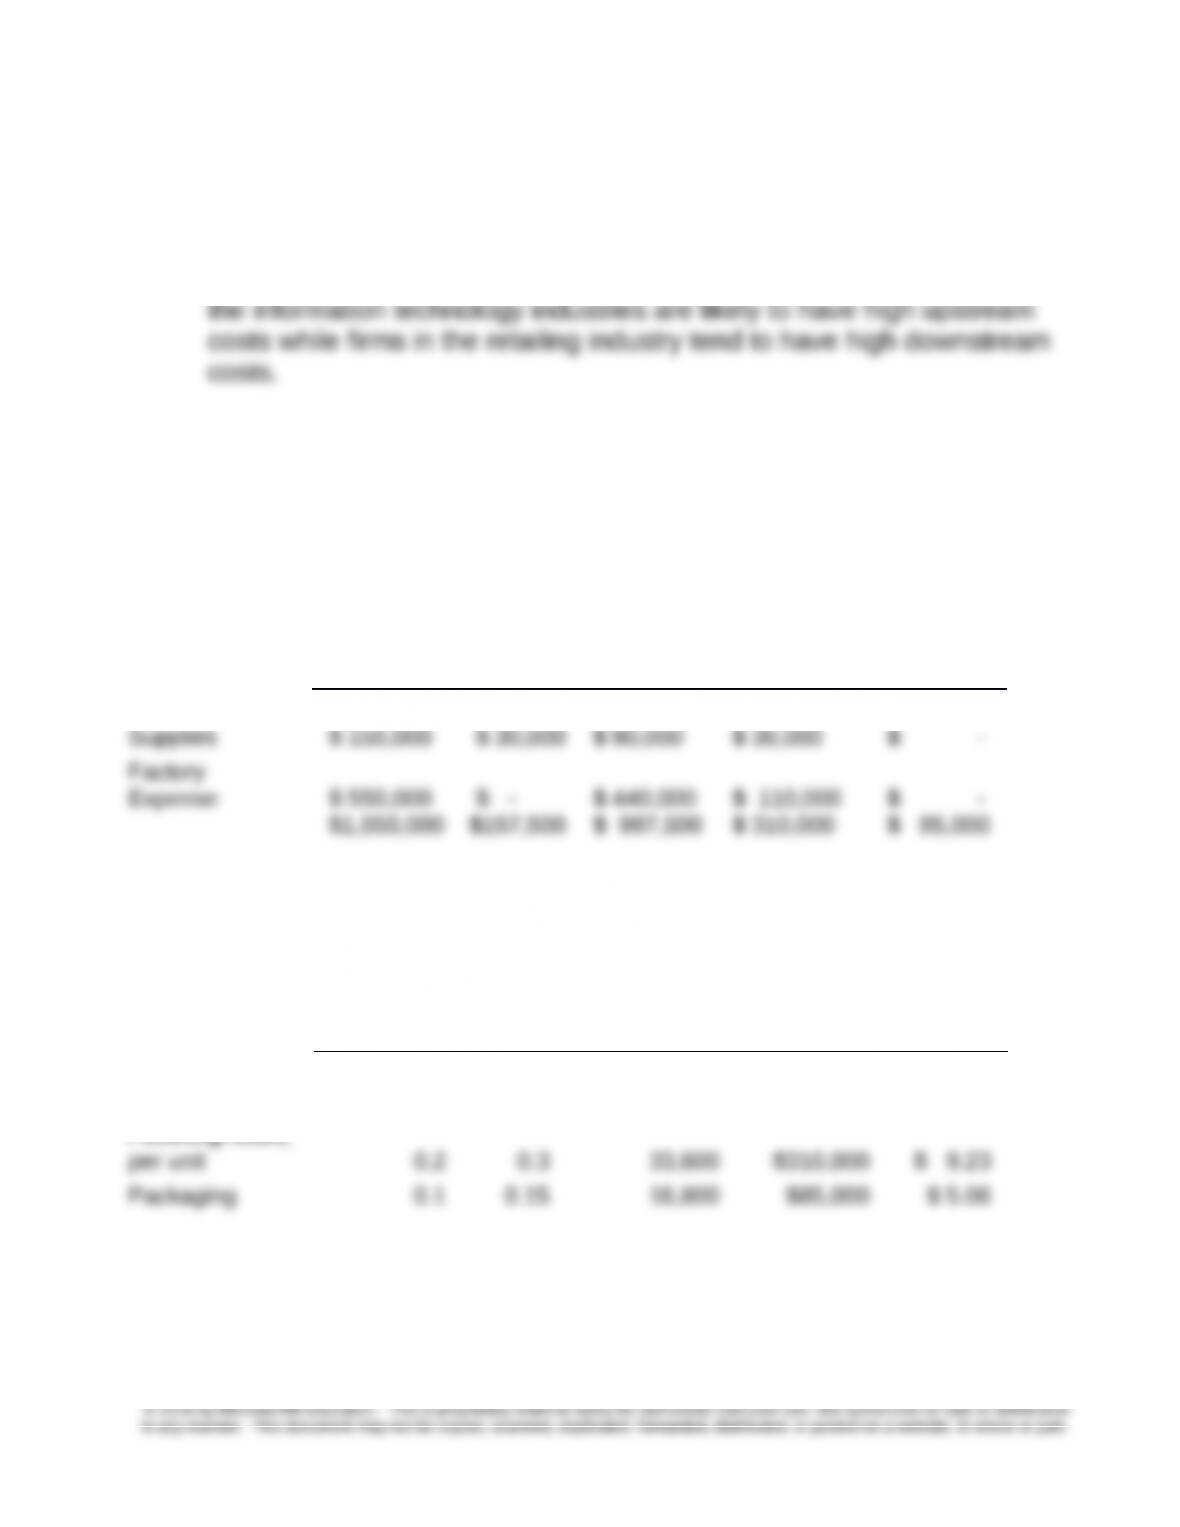
1. The activity based cost pools are determined from the percent-of-use
information; for example, total setup cost = $157,500 = (.15 × $850,000)
+ (.2 × $150,000).
Factory
Costs Setup Assembly
Inspect
&Finishing
Packagin
g
Salaries $ 850,000 $127,500 $ 467,500 $ 170,000 $ 85,000
2. The activity rates are determined as follows:
Safe-V Safe-T
Total Activity
Consumption
Activity
Costs
Activity-
based
Rates
Batches 250 600 850 $157,500 $185.29
Units 60,000 72,000 132,000 $997,500 $ 7.56
5-21
3. The per unit activity-based costs are $14.18 for Safe-V and $18.63 for the
Safe-T
Activity Requirements
Activity-Based
Costs/Unit
Safe-V Safe-T Safe-V Safe-T
Setup 250 600 $ 0.77 $ 1.54
Assembly 60,000 72,000 $ 7.56 $ 7.56
Inspect and Finish 0.2 0.3 $ 1.85 $ 2.77
Packaging 0.1 0.15 $ 0.51 $ 0.76
Materials per unit $3.50 $6.00 $ 3.50 $ 6.00
Total Cost per Unit $ 14.180 $ 18.628
5-39 (continued)
4. The activity-based information can be used by EEI to set prices and
assess the profitability of its two product lines.
5. The collection of more accurate cost driver data can only be justified when
the cost of data collection and analysis is less than the expected benefit.
Management would have to decide whether they think their decisions would
change based on the more accurate data. If not, then the extra effort and cost
associated with collecting the new data would not be justified. In this situation,
for example, an employee might not be assigned to a single job function. If
5-22
Chapter 5 – Activity-Based Costing and Customer Profitability Analysis
5-40 Activity-Based Costing; Customer Group Cost Analysis (40 min)
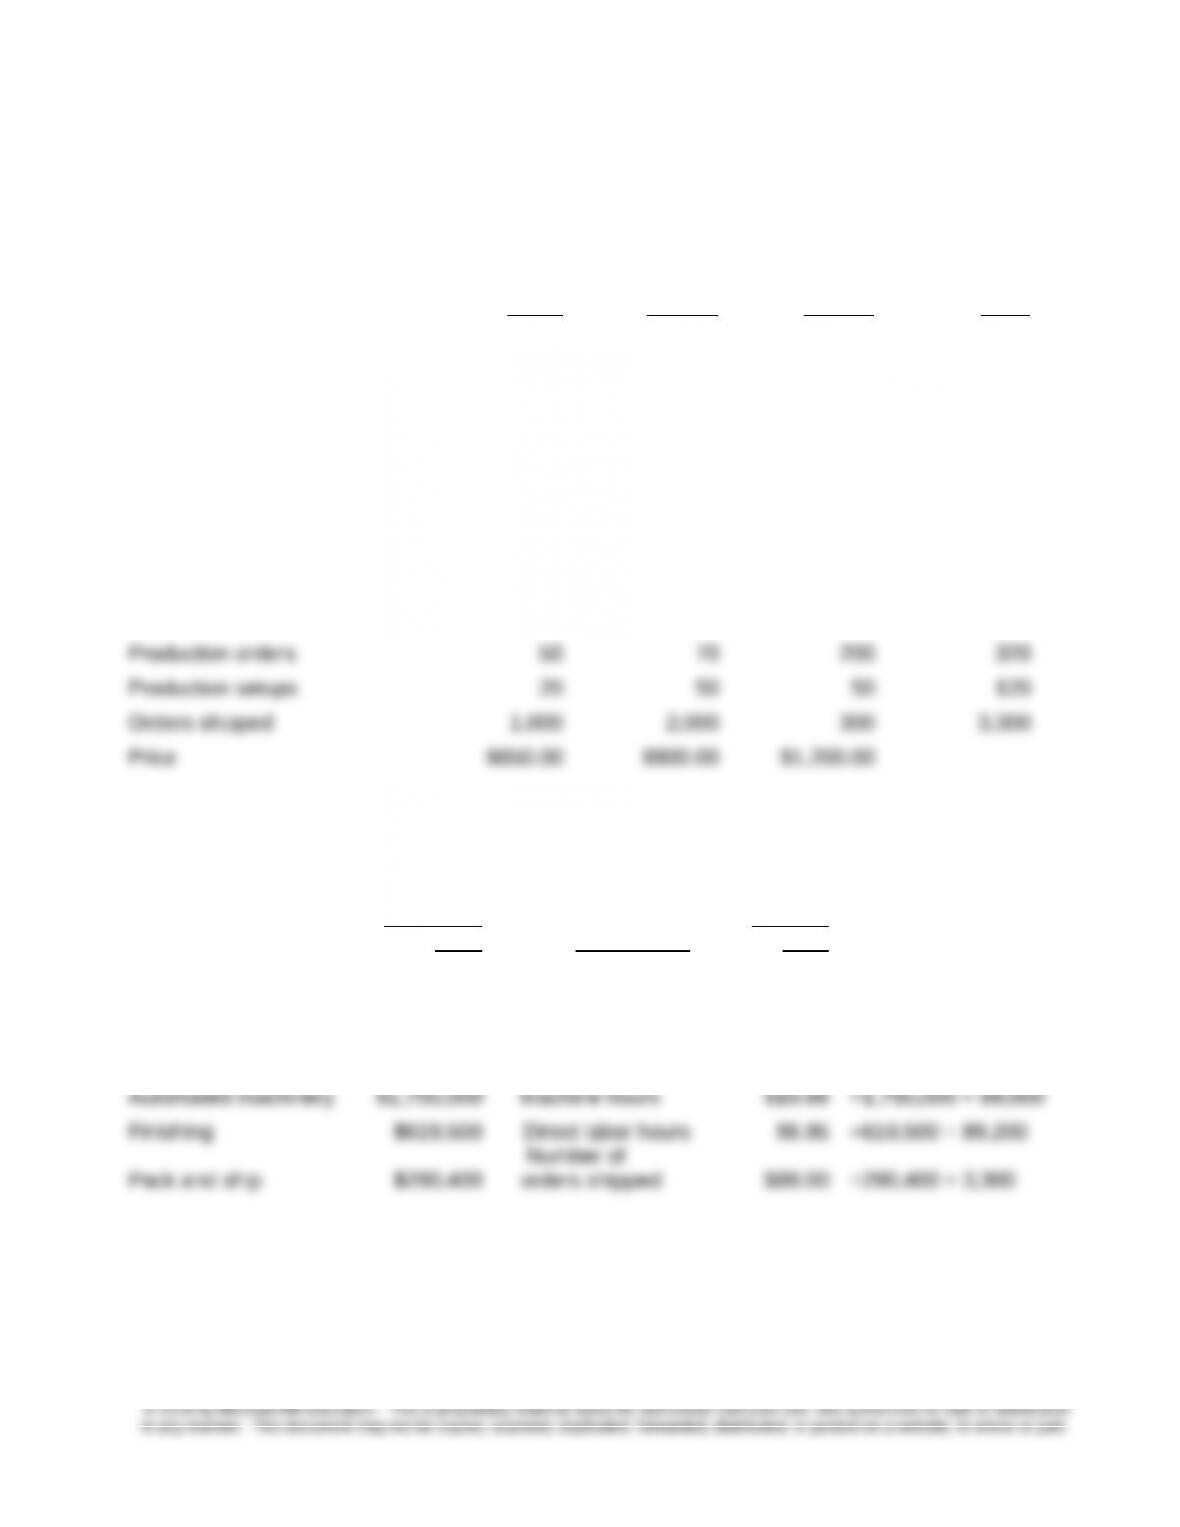
1. First, obtain the total levels for activity cost drivers:
Product Lines Value Quality Luxury Total
Units produced 15,000 5,000 600 20,600
Direct materials cost per unit $80 $50 $110
Total direct materials cost $ 1,516,000
Number of parts per unit 30 50 120
Total parts 772,000
Direct labor hours per unit 4 5 7
Total labor hours 89,200
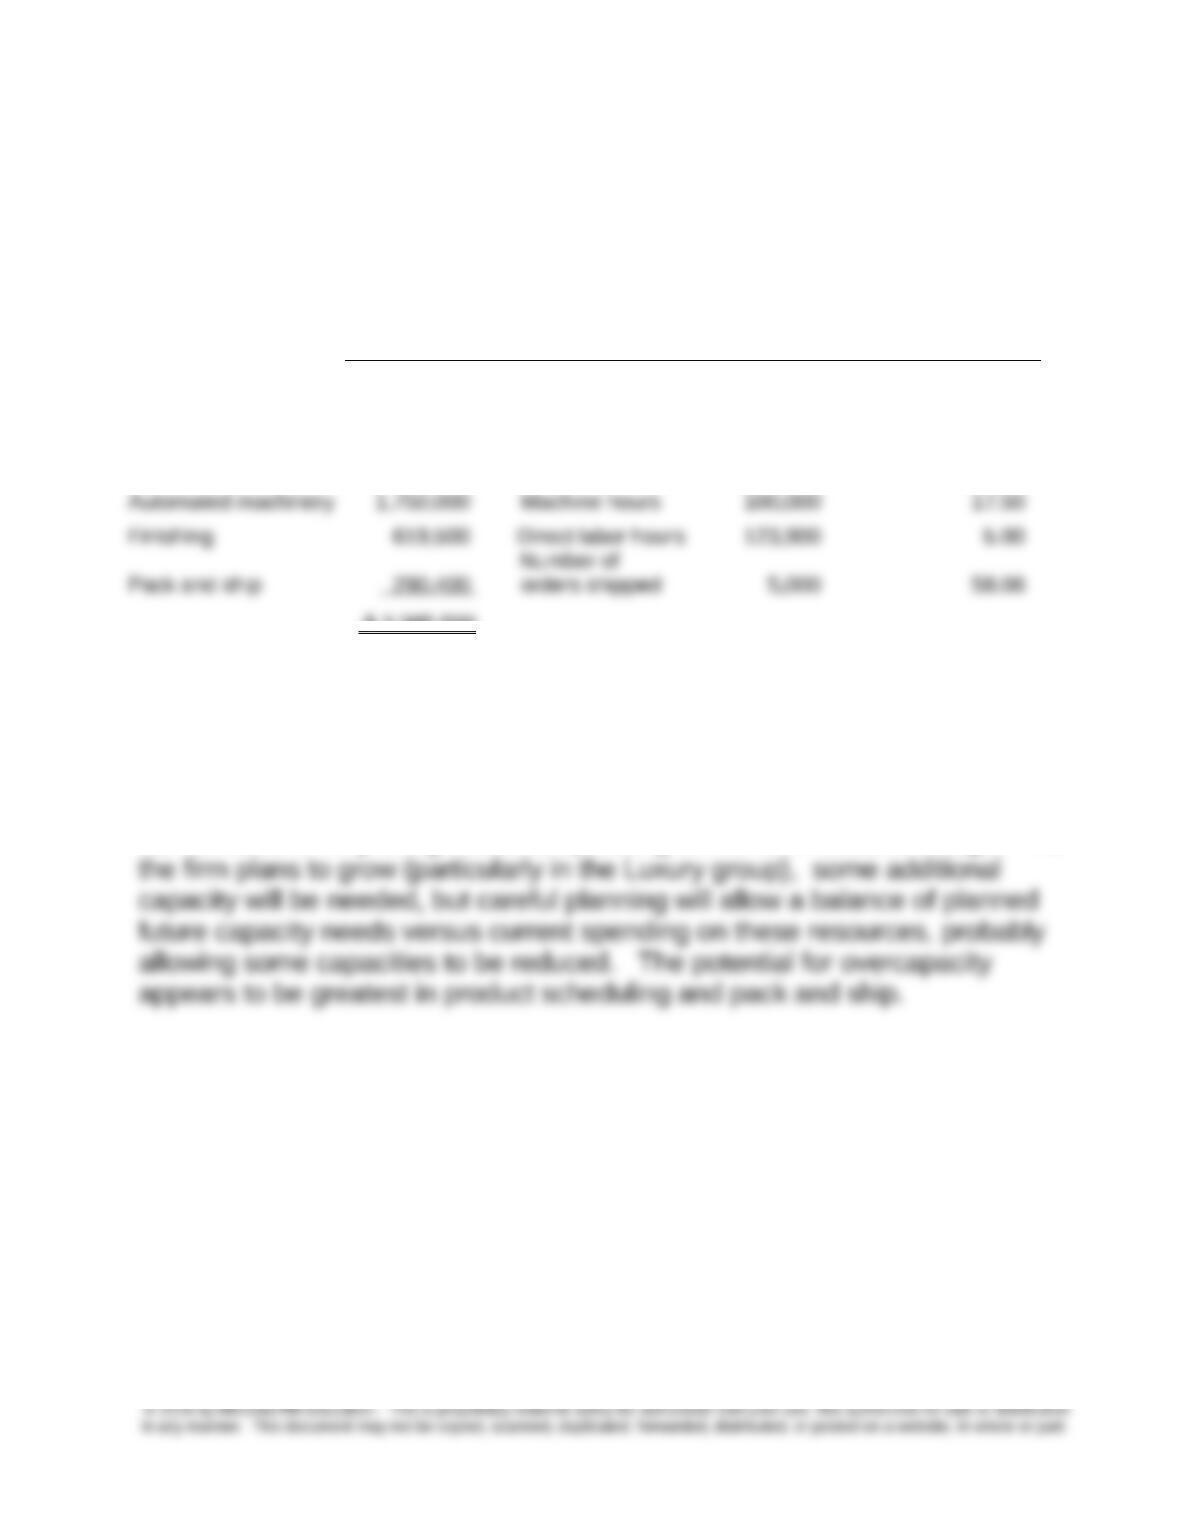
Machine hours per unit 3 7 15
Total machine hours 89,000
Then, obtain the activity rates:
Budgeted
Cost Cost Driver
Activity
Rate
Materials handling $349,600 Number of parts $0.45 =$349,600 ÷ 772,000
Product scheduling $160,000
Number of
production orders $500.00 =160,000 ÷ 320
Setup labor $216,000 Number of setups $1,800.00 =216,000 ÷ 120
5-23
Chapter 5 – Activity-Based Costing and Customer Profitability Analysis
5-40 (continued -1)
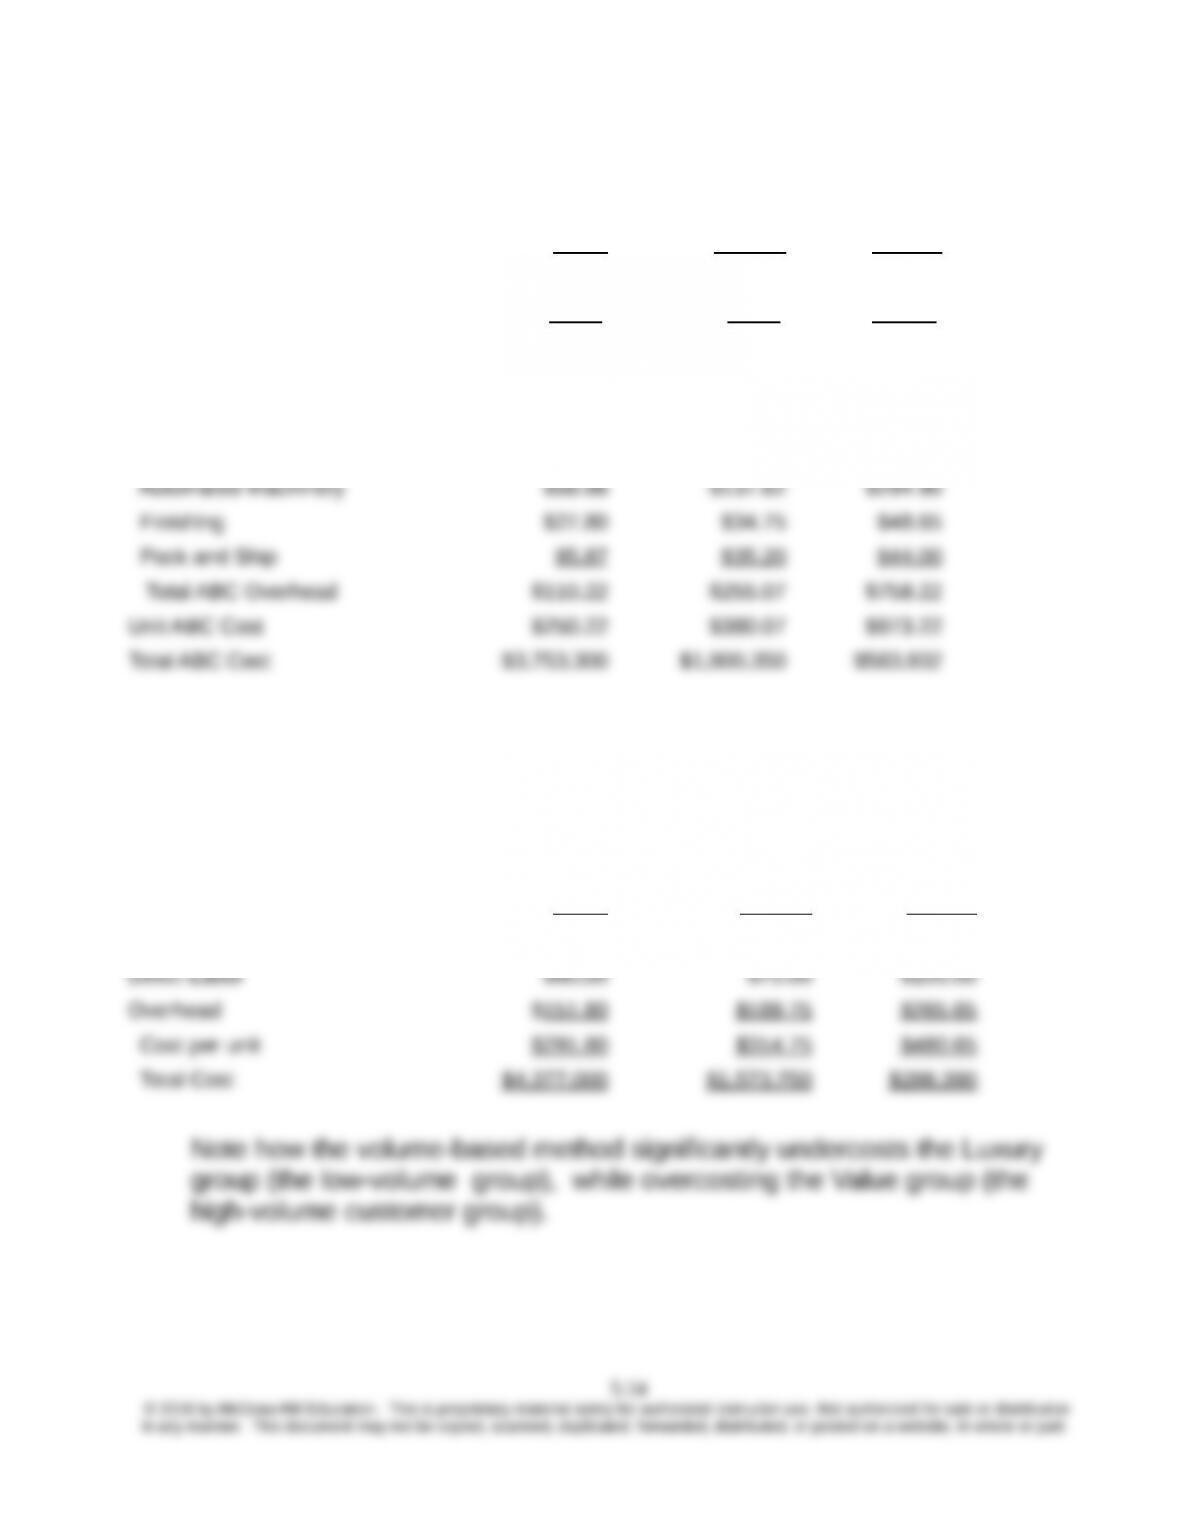
Finally, determine unit and total costs ,as follows:
Value Quality Luxury
Direct Materials $80.00 $50.00 $110.00
Direct Labor $60.00 $75.00 $105.00
Overhead:
Materials handling $13.50 $22.50 $54.00
Product Scheduling $1.67 $7.00 $166.67
Setup Labor $2.40 $18.00 $150.00
2. Volume-based results $3,385,500 ÷ 89,200 DLH = $37.95 per DLH (rounded to 2
decimal places)
Value Quality Luxury
Direct Materials $80.00 $50.00 $110.00
Chapter 5 – Activity-Based Costing and Customer Profitability Analysis
5-40 (continued -2)
3. The new activity rates based on practical capacity are as follows.
Budgeted
Cost
Cost Driver
Practical
Capacity
Practical
Capacity-Based
Rates
Materials handling $ 349,600 Number of parts 990,000 $ 0.35
Product scheduling 160,000
Number of
production orders 800 200.00
Setup labor 216,000 Number of setups 200 1,080.00
$ 3,385,500
Note that the rates have changed significantly from the calculations in part 1
above, because there is a significant level of unused capacity in many of the
activities. This information could be used by management to calculate unit
ABC-based costs using the practical capacity rates, and thereby identify the
cost of unused capacity. Moreover, the information about capacity utilization
can be used to help bring resource spending in line with resource usage. As
5-25
Chapter 5 – Activity-Based Costing and Customer Profitability Analysis
5-40 (continued – 3)
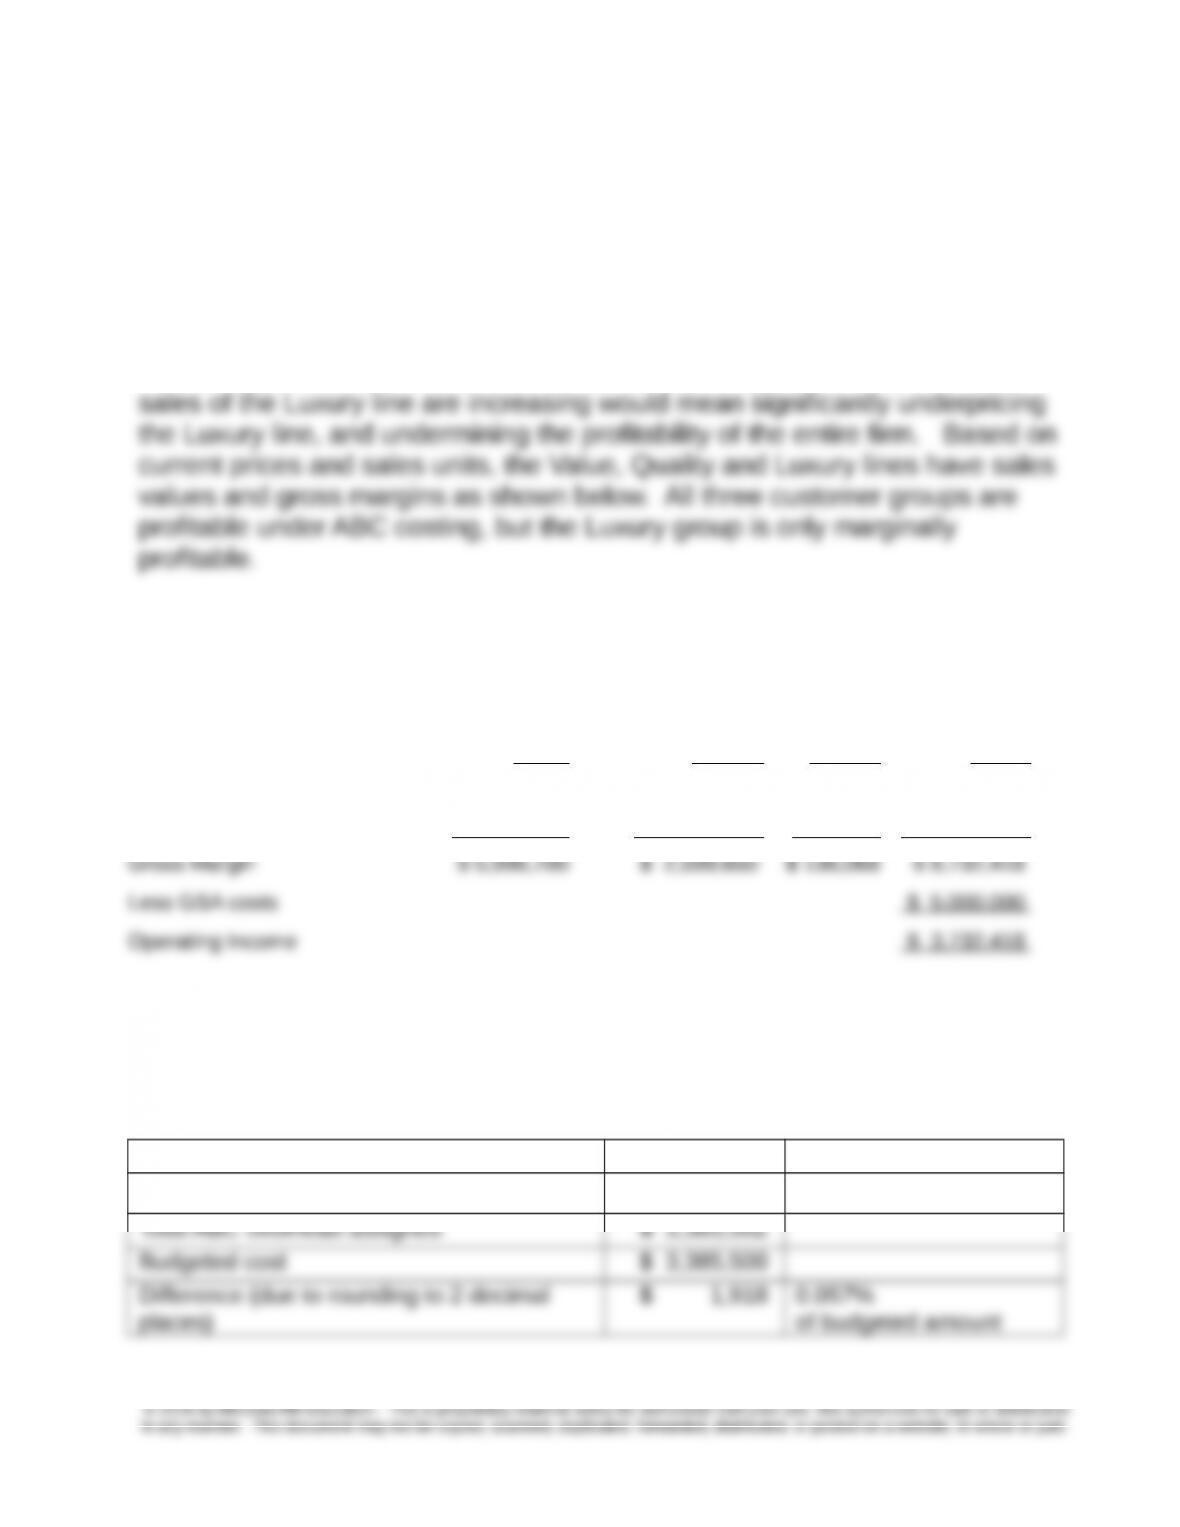
4. The ABC costing shows clearly how expensive the Luxury group is to
produce. The volume-based approach fails to account for the activity usage
of the Luxury line, and undercosts it significantly. ABC allows FFI to better
understand how its costs will increase with the expected increased production
of the Luxury line, and how it will have to adapt its pricing practices
accordingly. Continued use of the volume-based approach at a time when
Profitability by Customer Group
Profitability by Customer Group
Value Quality Luxury Total
Sales Value of each product $ 9,750,000 $ 4,500,000 $720,000 $ 14,970,000
Less ABC Manufacturing cost $ 3,753,300 $ 1,900,350 583,932 $ 6,237,582
Note that due to rounding the total ABC manufacturing costs assigned are
$1,918 more than the actual total costs. This is an insignificant difference that
is not likely to change any management actions.
Total ABC costs $ 6,237,582
Less: direct labor and direct materials $ 2,854,000
5-26
Chapter 5 – Activity-Based Costing and Customer Profitability Analysis
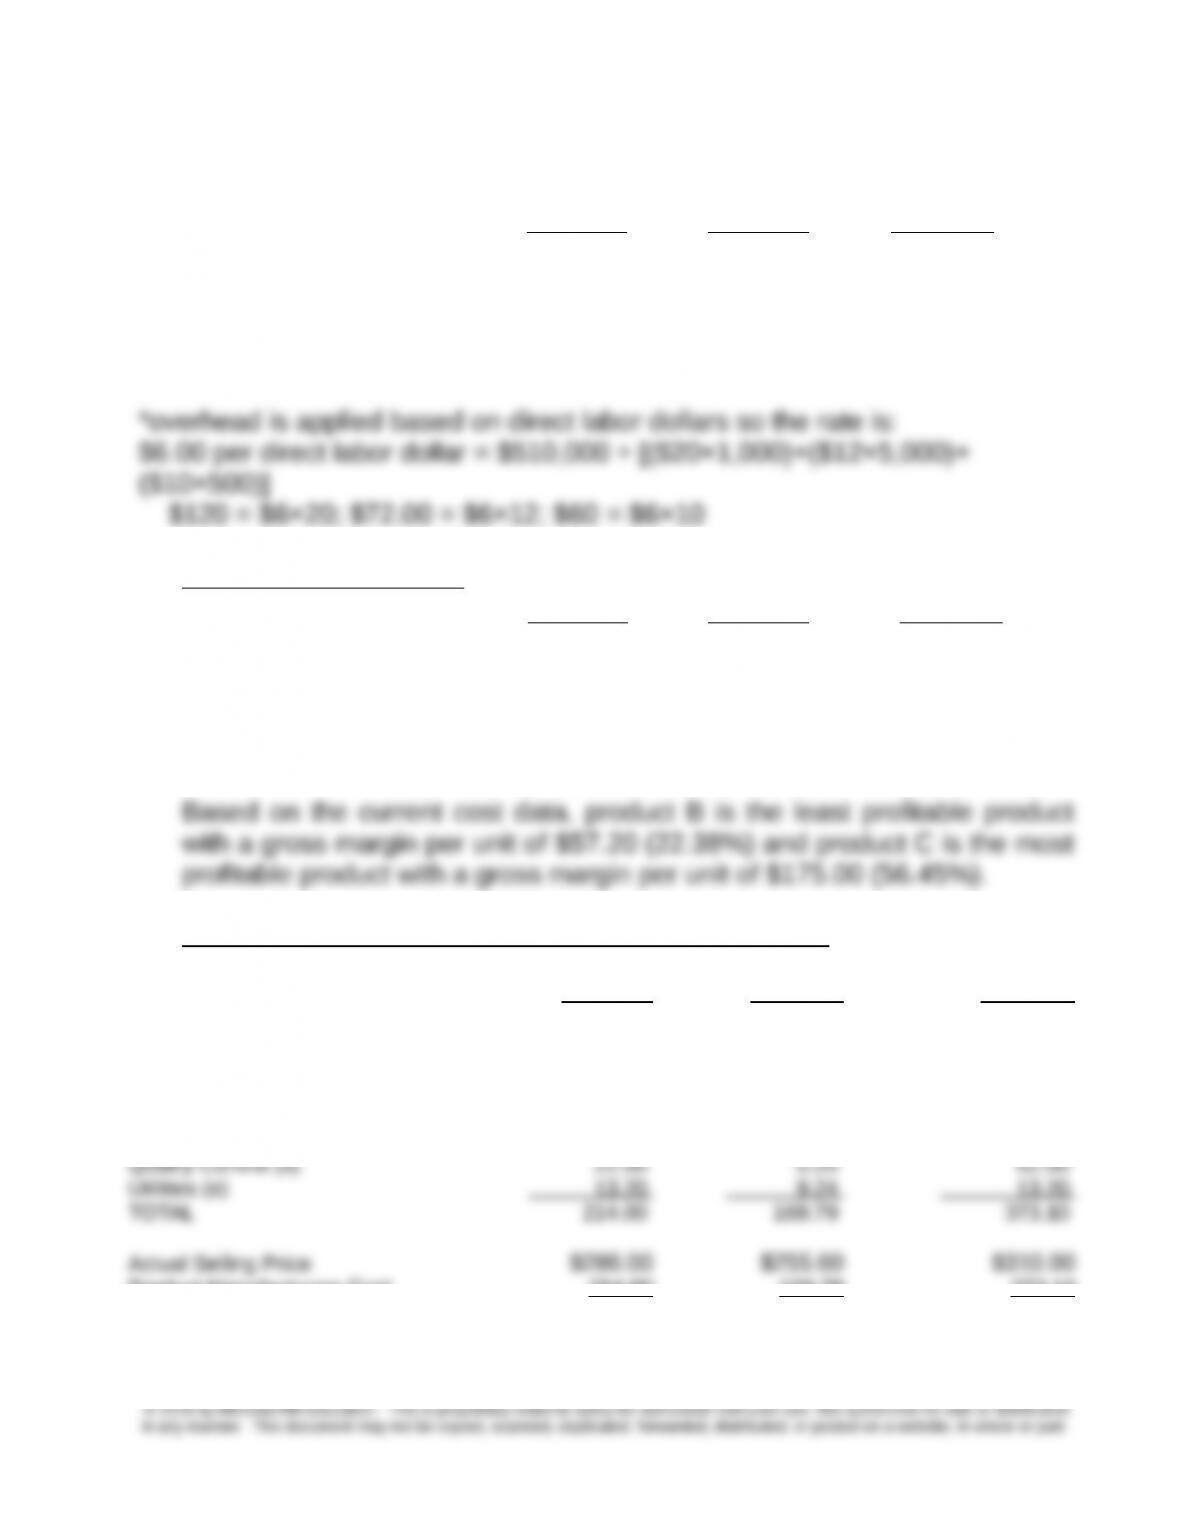
5-41 Volume-based Costing Versus ABC (35 min)
Product A Product B Product C
Materials $50.00 $114.40 $65.00
Labor $20.00 $12.00 $10.00
Overhead* $120.00 $72.00 $60.00
Total Cost $190.00 $198.40 $135.00
1. Current Costing system
Product A Product B Product C
Actual Selling Price $286.00 $255.60 $310.00
Product Manufacturing Cost $190.00 $198.40 $135.00
Gross Margin $96.00 $57.20 $175.00
Gross Margin Ratio 33.57% 22.38% 56.45%
Product costs based on the activity-based costing system
(calculate on per unit basis) Product A Product B Product C
Direct Materials 50.00 114.40 65.00
Direct Labor 20.00 12.00 10.00
Factory Overhead:
Setups (a) 1.80 0.90 5.40
Materials Handling (b) 44.00 5.50 77.00
Hazardous Control (c) 62.50 22.50 150.00
Product Manufacturing Cost 214.00 169.79 373.10
Gross Margin $72.00 $85.81 ($63.10)
Gross Margin Percentage 25.17% 33.57% -20.35%
5-27
Chapter 5 – Activity-Based Costing and Customer Profitability Analysis
5-41 (continued -1)
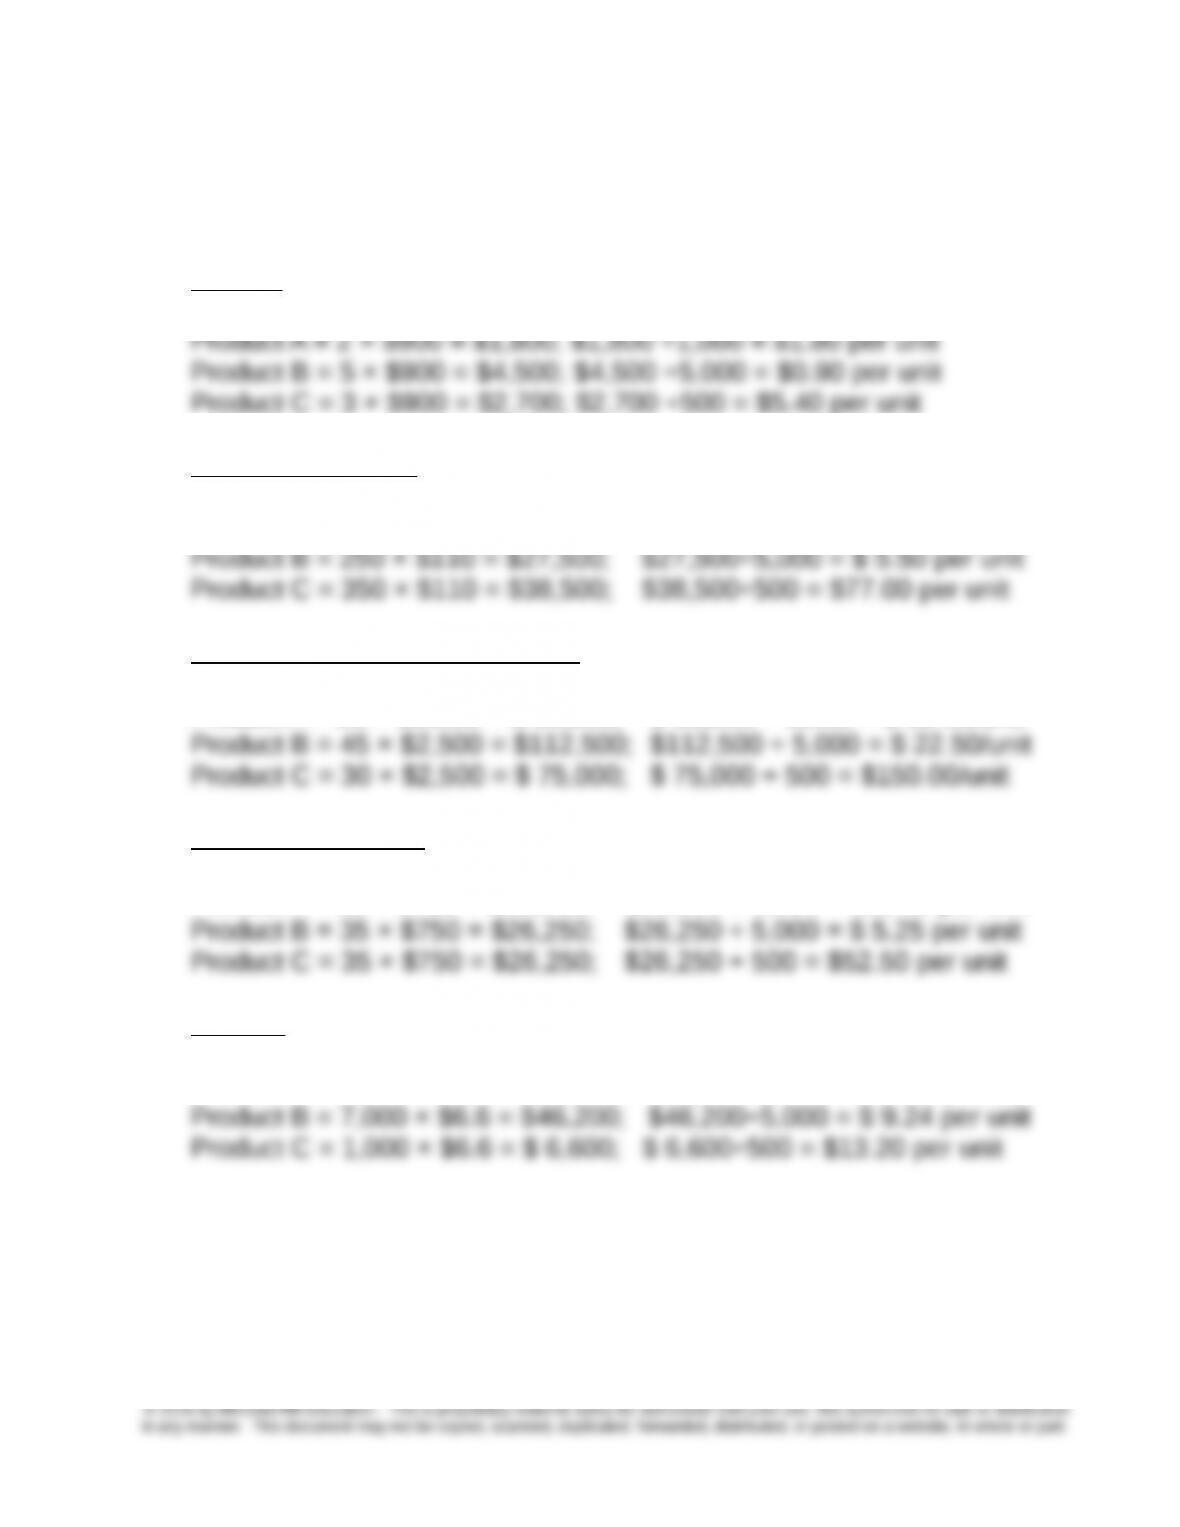
Notes:
(a) Setups:
Cost per setup: $9,000 ÷ (2 + 5 + 3) = $900 per setup
(b) Materials handling:
Cost per pound = $110,000 ÷ (400 + 250 + 350) = $110 per pound
Product A = 400 × $110 = $44,000; $44,000÷1,000 = $44.00 per unit
(c) Waste and hazardous disposals:
Cost per disposal: $250,000 ÷ (25 + 45 + 30) = $2,500 per disposal
Product A = 25 × $2,500 = $ 62,500; $ 62,500 ÷ 1,000 = $ 62.50/unit
(d) Quality inspections:
Cost per inspection = $75,000 ÷ (30 + 35 + 35) = $750 per inspection
Product A = 30 × $750 = $22,500; $22,500 ÷ 1,000 = $22.50 per unit
(e) Utilities:
Cost per MH = $66,000 ÷ (2,000 + 7,000 + 1,000) = $6.60 per MH
Product A = 2,000 × $6.6 = $13,200; $13,200÷1,000 = $13.20 per unit
5-28
Chapter 5 – Activity-Based Costing and Customer Profitability Analysis
5-41 (continued-2)
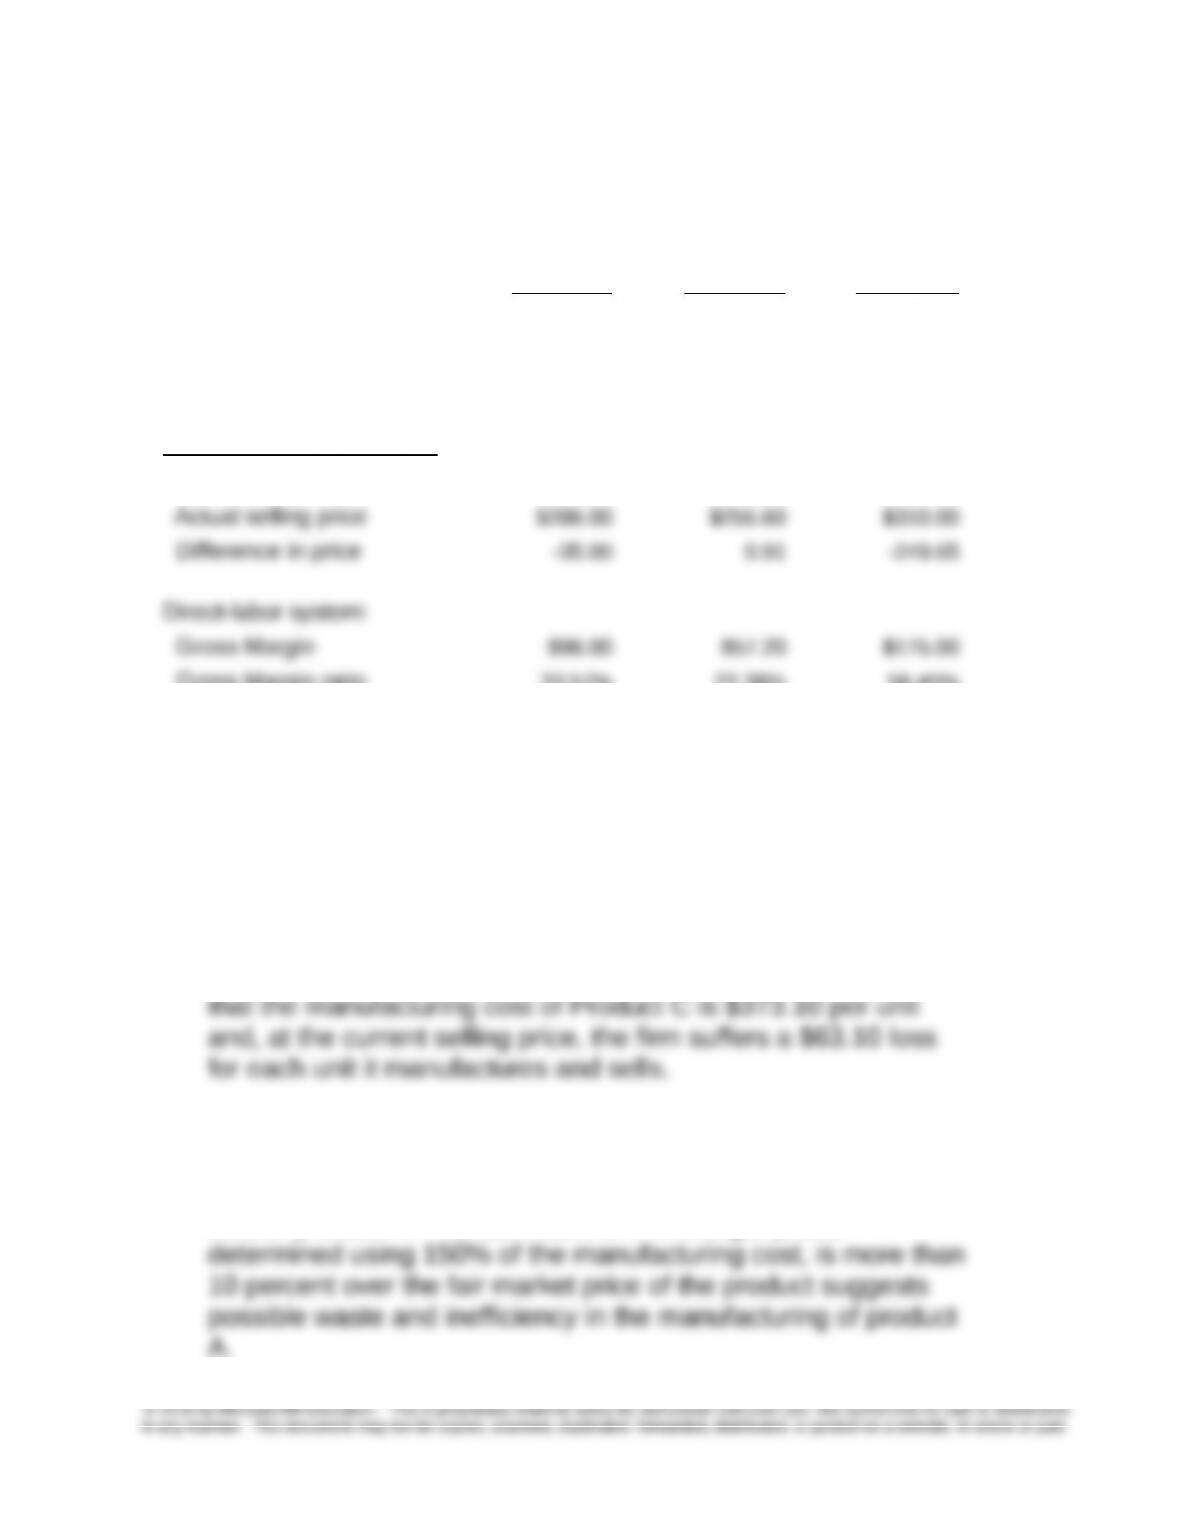
2. Comparison of reported product costs, new target price, actual selling price,
and gross margin (loss):
Product A Product B Product C
Product Costs:
Direct-labor system $190.00 $198.40 $135.00
Activity system $214.00 $169.79 $373.10
ABC- based product costs:
Target price $321.00 $254.69 $559.65
Gross Margin ratio 33.57% 22.38% 56.45%
ABC system:
Gross Margin $72.00 $85.81 -$63.10
Gross Margin ratio 25.17% 33.57% -20.35%
3. Strategic and Compeiive Analysis
a. Emphasizing Product C as suggested by the current direct-
labor-cost based overhead costing system is likely to lead to
the demise of the firm. The activity-based costing system shows
b. If the actual selling prices of products A & B are fair market
prices for these products and a markup of 150% is a common
industry practice, the firm needs to examine the manufacturing
cost of product A. The fact that the firm’s target price,
5-29
Chapter 5 – Activity-Based Costing and Customer Profitability Analysis
5-42 Volume-based Costing Versus ABC (40 min)
1. a. Predetermined factory overhead rate = $3,000,000 ÷ $600,000
= $5 per direct-labor dollar
b. Product costs and selling prices
Product Costs Mona Loa Malaysian
Direct costs:
Direct materials $4.20 $3.20
Direct labor .30 .30
$4.50 $3.50
Indirect costs:
Budgeted selling prices per pound $7.80 $6.50
2. The cost per driver unit is:
Activity Cost Driver
Budgeted
Activity
Budgeted
Cost
Cost per
Unit
Purchasing Purchase orders 1,158 $579,000 $500
Materials handling Setups 1,800 $720,000 $400
Quality control Batches 720 $144,000 $200
Roasting Roasting-hours 96,100 $961,000 $10
Blending Blending-hours 33,600 $336,000 $10
Packaging Packaging-hours 26,000 $260,000 $10
5-30