
Chapter 5 – Activity-Based Costing and Customer Profitability Analysis
5-31 Applications of ABC Costing in Government (20 min)
1,2.
Some of the examples are noted in the text, including the U.S. Postal Service,
the U.S. Patent Office, and the U.S. Army. Others include the U.S. Coast
Guard, the US. National Security Agency (ABC used to better understand the
cost of its mission support services), the U.S. Mint (pressure from top
management to better understand the organization’s cost structure and cost
behavior), and the U.S. National Institute of Health (ABC is used to determine
more accurately the cost of providing its services including building and space
acquisition, property management, and research program support).
A variety of examples are possible here. For additional examples: Gary
Cokins, Activity-Based Cost Management in Government, Management
Concepts, Inc., 2001. Also, see case studies of governmental agencies in
Cost & Effect, by Robert S. Kaplan and Robin Cooper, Harvard Business
School Press, 1998, pp 245-250. Kaplan and Cooper explain application at
the U.S. Veterans Affairs Department, the U.S. Immigration and Naturalization
Service, theU.S. Internal Revenue Service, and the City of Indianapolis.
5-11
Chapter 5 – Activity-Based Costing and Customer Profitability Analysis
5-32 Product-line Profitability, ABC (25 min)
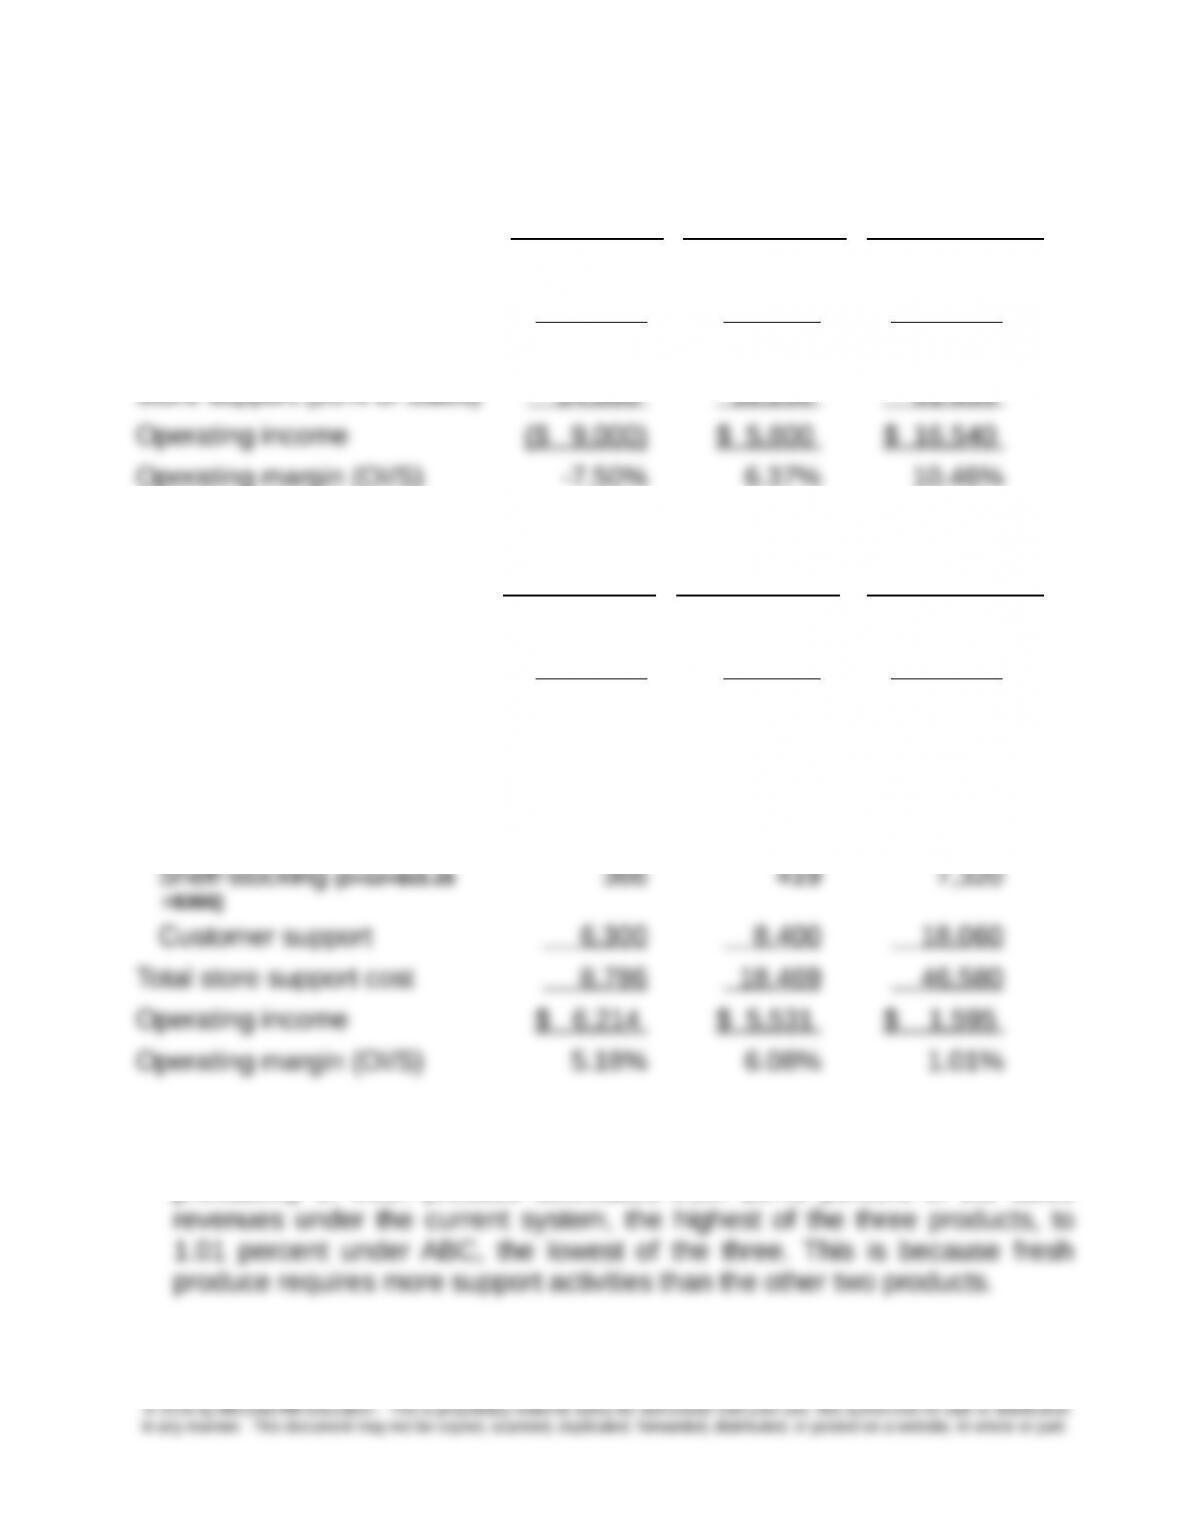
1. Product-line profitability under the current costing system
Frozen Food Baked Goods Fresh Produce
Sales $120,000 $91,000 $158,175
Cost of goods sold 105,000 67,000 110,000
Gross margin $ 15,000 $24,000 $ 48,175
2. Product-line profitability under ABC
Frozen Food Baked Goods Fresh Produce
Sales $120,000 $91,000 $158,175
Cost of goods sold 105,000 67,000 110,000
Gross margin $ 15,000 $24,000 $ 48,175
Store support:
Order processing 800 $3,600 $8,000
Receiving 1,320 6,050 13,200
3. Both baked goods and fresh produces drop in profitability when ABC is
used. The decrease in profitability of fresh produce is most noticeable. The
profitability of fresh produce decreases from 10.46 percent of the sales
5-12
Chapter 5 – Activity-Based Costing and Customer Profitability Analysis
5.32 (coninued)
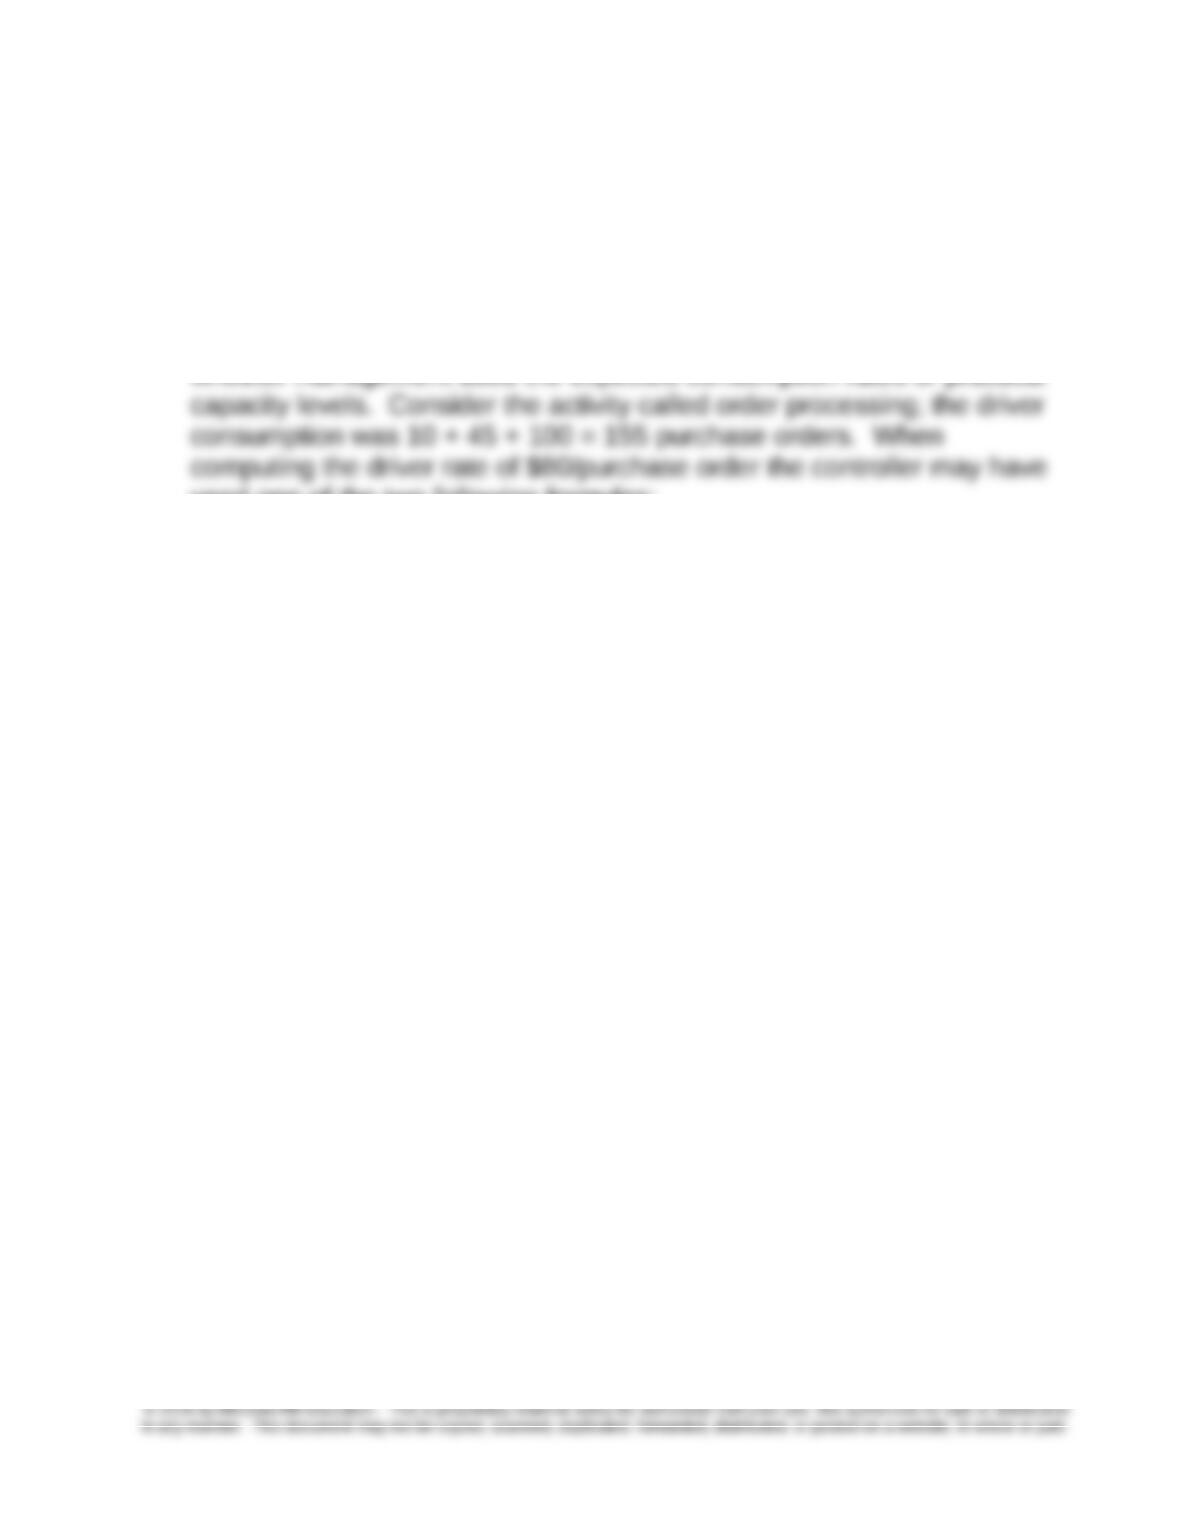
4. The rates come from dividing the total dollar amount in a cost pool by the
activity driver quantity for each cost pool. The issue that management
faces is deciding whether to use the expected consumption quantity of the
activity driver or the practical capacity level of the activity driver,
regardless of consumption. It is not clear from the information provided
whether management used the expected consumption rates or practical
used one of the two following formulas:
Cost of order processing ÷ 155
Or
Cost of order processing ÷ practical capacity
Since practical capacity will be greater than or equal to expected
consumption, the driver rate would be lowest when using practical
capacity. Also, the rates would vary as expected consumption changed,
but practical capacity is likely to remain fairly stable, making the driver
rates more stable.
5-13
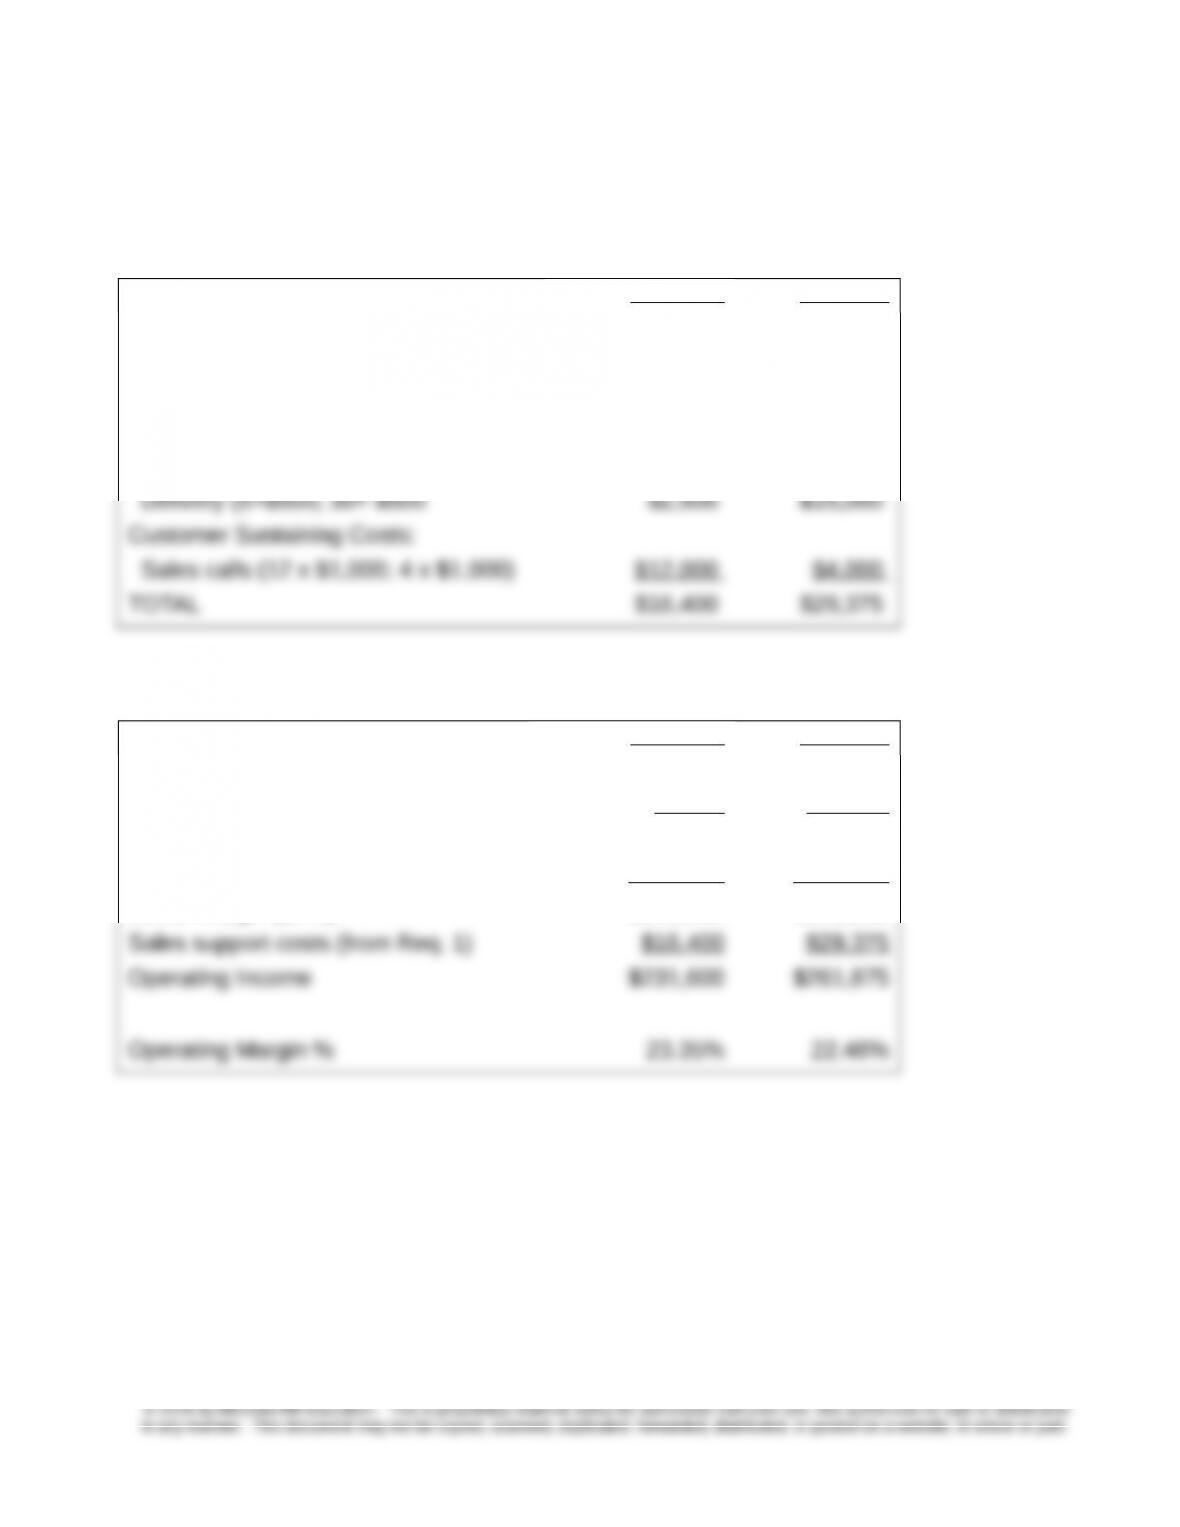
5-33 Product Line Profitability Analysis
1.2.,
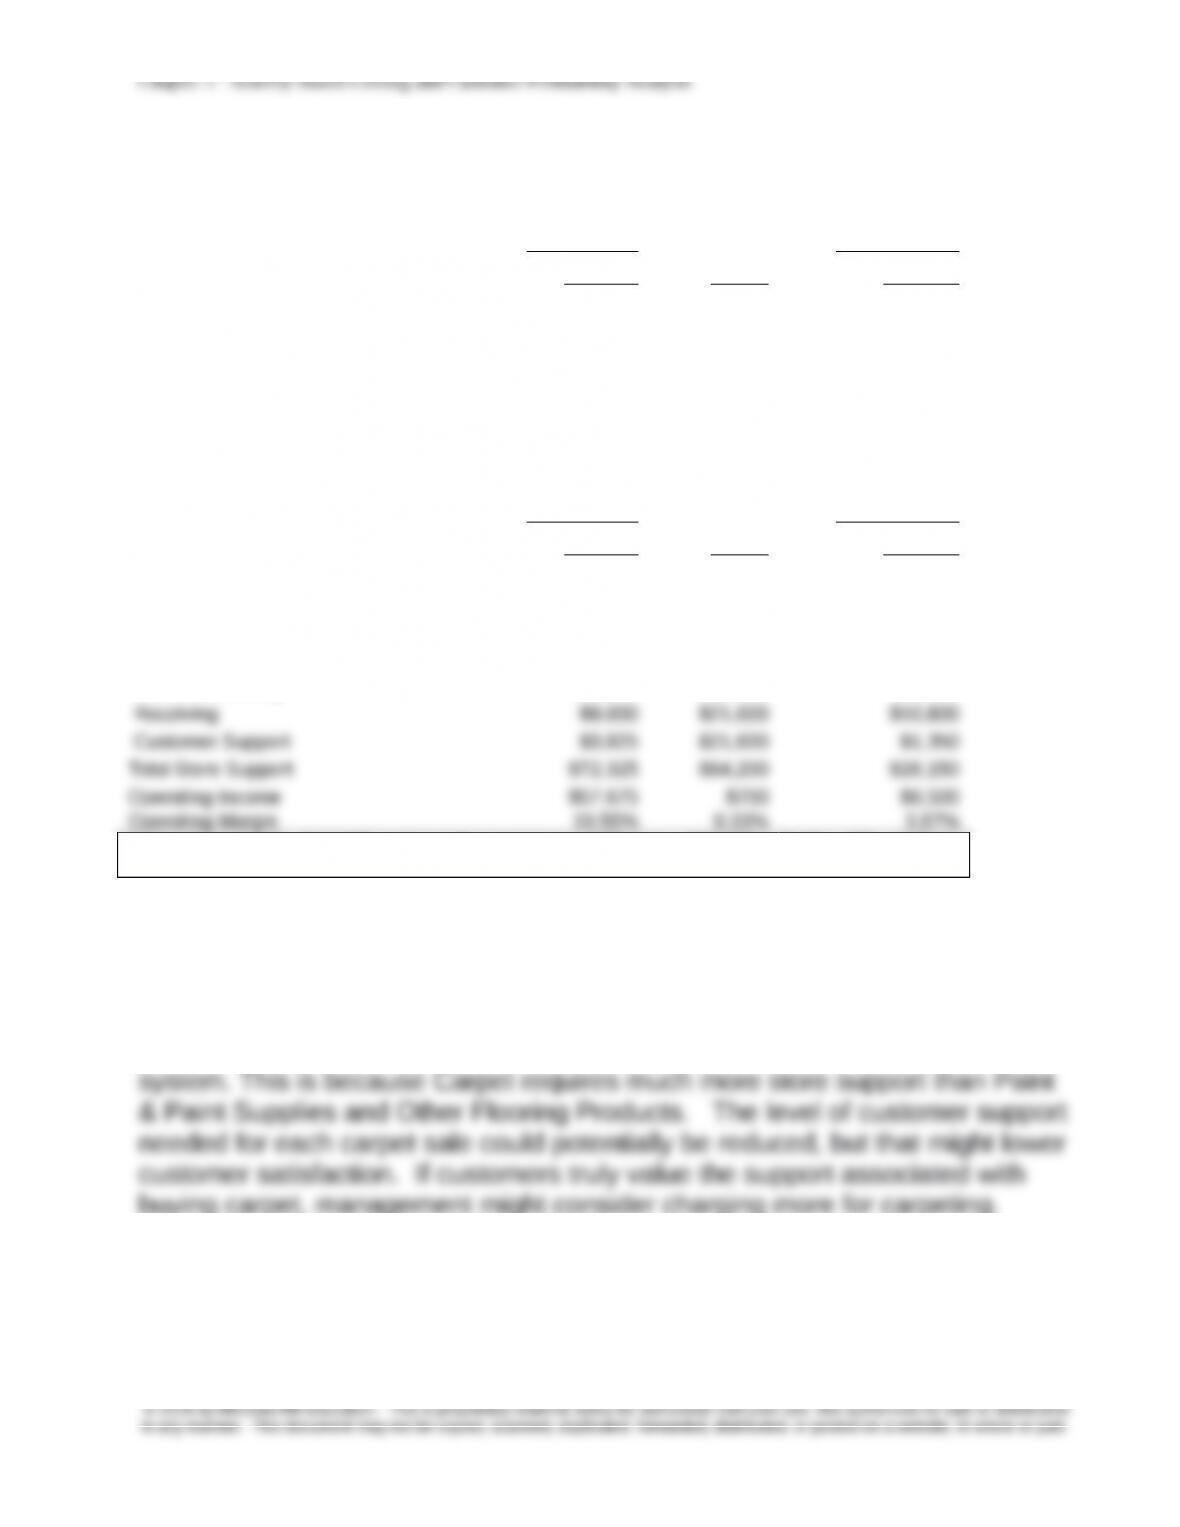
Paint & Paint
Supplies Carpet
Other Flooring
Products
Sales $295,000 $214,900 $167,900
Cost of goods sold $165,000 $150,000 $135,250
Gross Margin $130,000 $64,900 $32,650
Store Support (24% of revenue) $70,800 $51,576 $40,296
Operating Income $59,200 $13,324 ($7,646)
Operating Margin 20.07% 6.20% -4.55%
Product line profitability under ABC.
Paint & Paint
Supplies Carpet
Other Flooring
Products
Sales $295,000 $214,900 $167,900
Cost of goods sold $165,000 $150,000 $135,250
Gross Margin $130,000 $64,900 $32,650
Store Support:
Order Processing $59,500 $21,000 $14,000
Note: for example, Paint&Supplies order processing ABC cost = $59,500 = $140 × 425; similarly
for other activities
3. Paint & Paint supplies have little change in operating profit. Carpet and
Other Flooring Products, however, have significant changes. This is
important because it indicates that the current costing system does not
provide an accurate reflection of store support. It is also interesting that the
Other Flooring Products are more profitable than Carpet under the ABC
buying carpet, management might consider charging more for carpeting.
5-34 Customer Profitability Analysis: Luxury Hotel Industry (15 min)
1. The information-gathering programs are a logical fit for the luxury type
hotels described here. These firms compete on their ability to attract high-
5-14
Chapter 5 – Activity-Based Costing and Customer Profitability Analysis
paying customers to their luxury hotels. These additional services can give
the hotel a competitive edge. It is much more common now to see hotels with
loyalty programs, where membership in the program triggers room upgrades,
free coffee, and other benefits. Hilton and Hyatt are among those that have
these programs; they are called Hilton HHonors, and Hyatt Gold Passport,
respectively.
2. There is a good application for activity-based costing here. The program
should be analyzed by activity (the different types of premium services
offered), and then the cost drivers of these activities should then be identified,
and traced to the cost object, which in this case is the individual customer. It
3. Some will argue there is no ethical issue with the information gathering.
Others might argue that the guest should be informed that the information is
being obtained and used throughout the hotel chain’s system. For example,
Marriott has guests fill out a form to participate, so the program is entirely
optional. Other ethical issues arise, for example, if the hotel chain chooses to
5-15
Chapter 5 – Activity-Based Costing and Customer Profitability Analysis
5-35 Customer Profitability Analysis (25 minutes)
1.
Jerry Inc. Kate Co.
Customer Unit Level Costs:
Sales return(40×$5;175×$5) $200 $875
Customer Batch Level Costs:
Order processing (5×$300; 30×$300) $1,500 $9,000
Sales return (2×$100; 5×$100) $200 $500
2.
Jerry Inc. Kate Co.
Sales $1,000,000 $1,200,000
Sales Return (40×$200; 175×$200) $8,000 $35,000
Net Sales $992,000 $1,165,000
Cost of goods sold $744,000 $873,750
Gross margin (25%) $248,000 $291,250
5-16
Chapter 5 – Activity-Based Costing and Customer Profitability Analysis
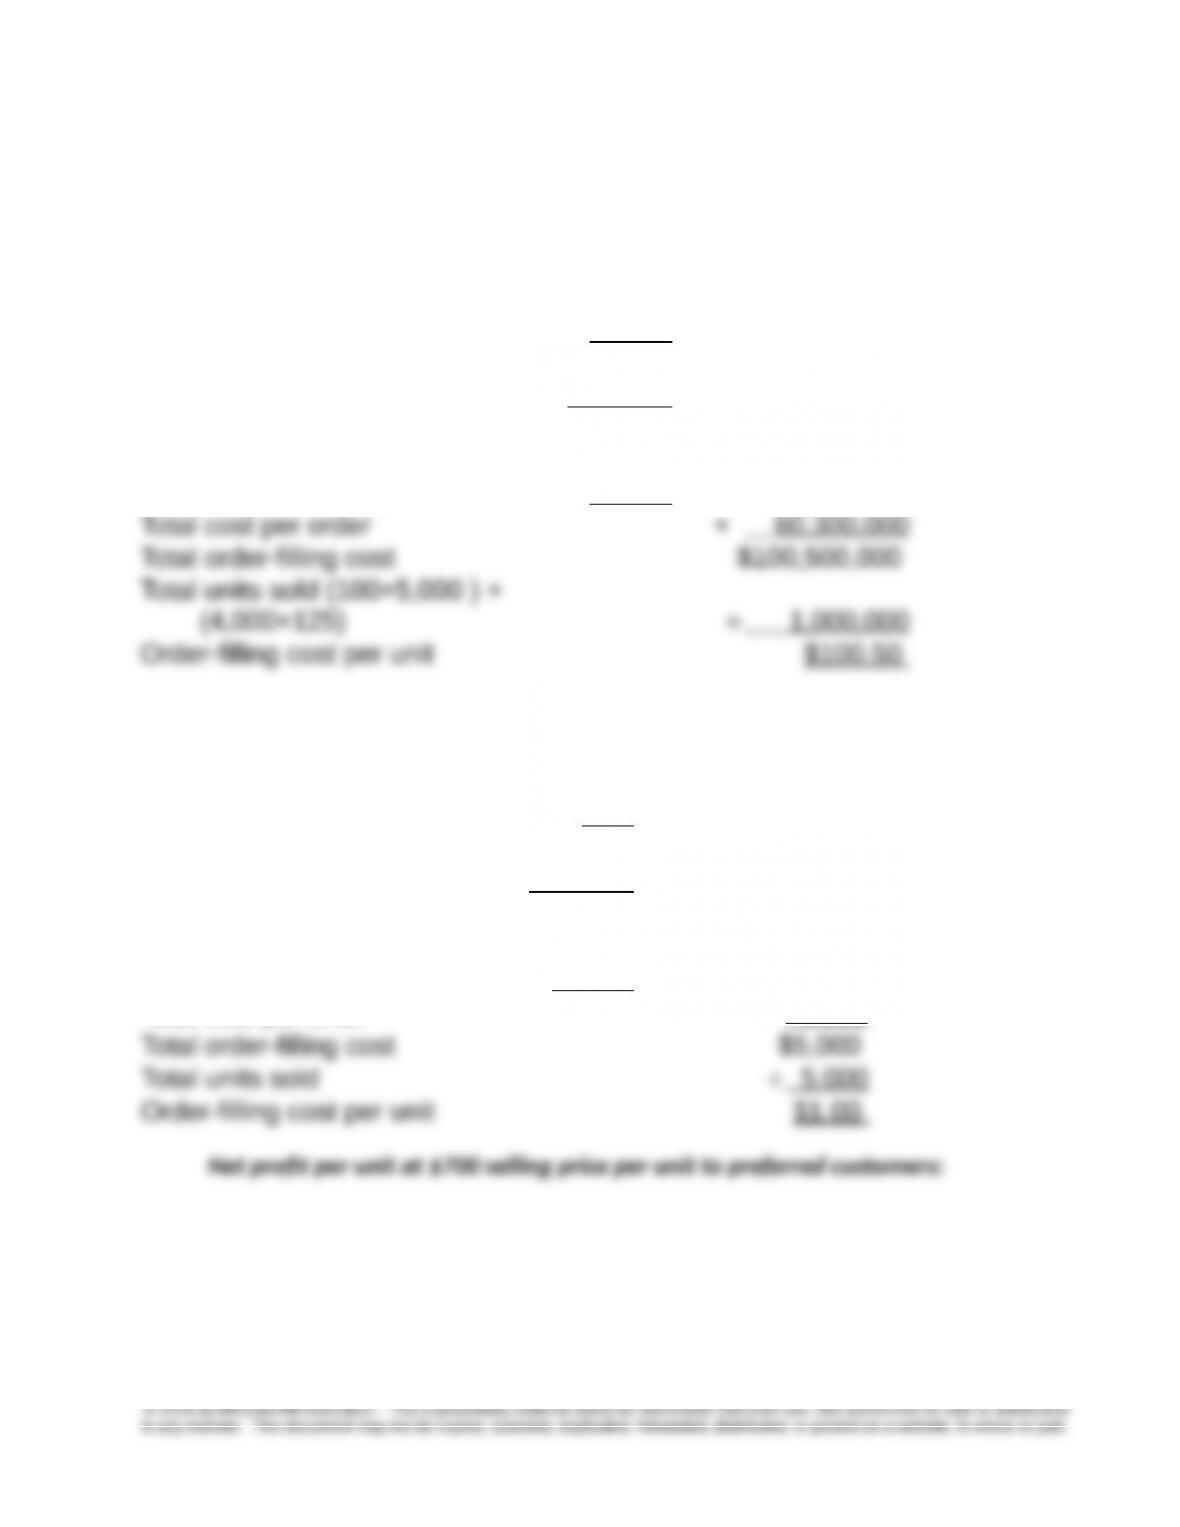
5-36 Customer Profitability Analysis (25 min)
1. Determinaion of the $100.50 order-illing cost per unit
Total number of orders:(2 × 100 PCs) + (10 × 4,000 SCs) = 40,200
Total number of orders 40,200
Number of orders per block 60
Total number of blocks 670
Cost per block × $60,000
Total cost of order blocks $ 40,200,000
Total number of orders 40,200
Per order order-filling cost × $1,500
2. Order illing cost per unit sold to PC:
Total number of orders 2
Number of orders per block 60
Total number of blocks 1/30
Cost per block × $60,000
Total block cost $2,000
Total number of orders 2
Order-filling cost per order × $1,500
Total cost per order + 3,000
5-17
Chapter 5 – Activity-Based Costing and Customer Profitability Analysis
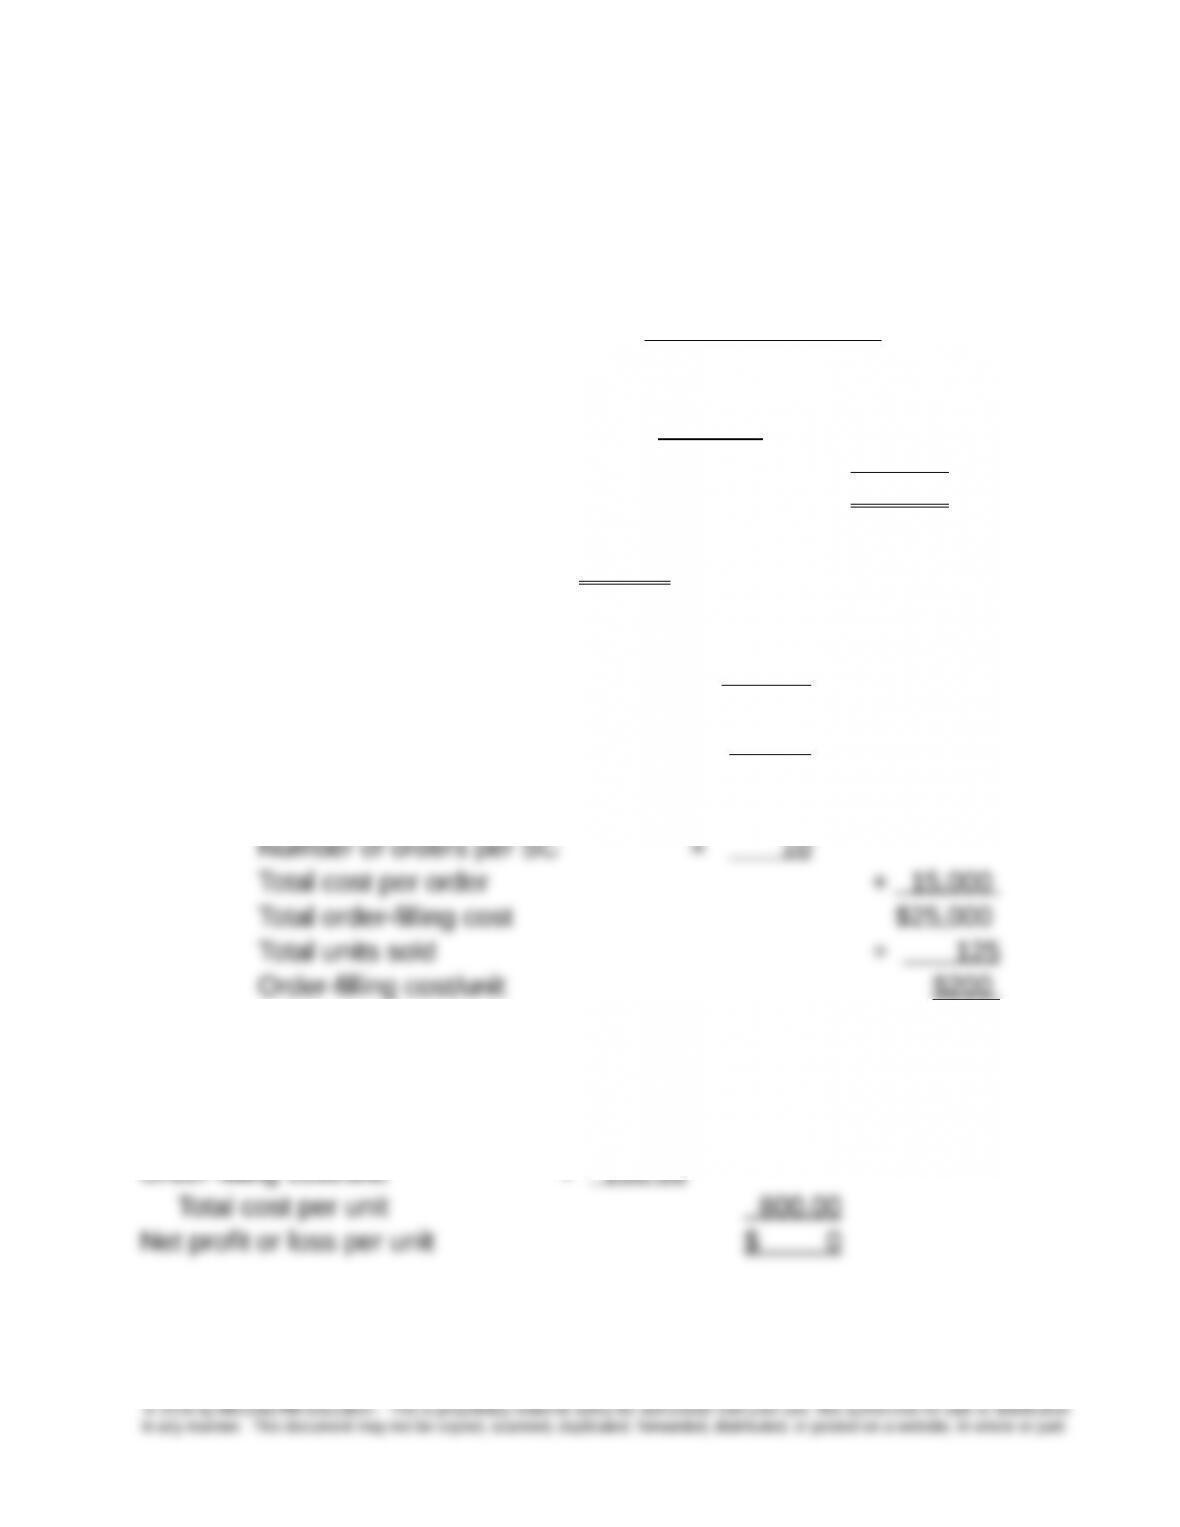
5-36 (continued)
3. Order illing cost per order by SC:
Cost per block $60,000
Number of orders per block ÷ 60
Block cost per order $1,000
Number of orders per SC × 10
Total block cost per SC $10,000
Order-filling cost per order $1,500
Proitability per unit at $800 selling price per unit to SC
Selling price per unit $800.00
Manufacturing cost $600.00
5-18
Preferred Customer
Selling price per unit $700.00
Manufacturing cost $600.00
Order-filling cost/unit + 1.00
Total cost per unit 601.00
Net Profit per unit $ 99.00
Profit margin per unit 14.14%

Chapter 5 – Activity-Based Costing and Customer Profitability Analysis
5-37 Tools for Successful ABC/M Implementation (10 min)
Other guides or tip for successful implementation are noted in the text, but
some are listed below:
Choose a type of context where ABC is likely to succeed, such as a
situation where there is product variety and operating complexity, so that
the ABC analysis provides significantly useful information
Keep the initial design system; use a simple prototype and build the
system gradually
Additional Sources: Dan Swenson and Douglas Barney, “ABC/M: Which
Companies Have Success?” The Journal of Corporate Accounting & Finance,
March/April 2001, pp 35-44. See also, Douglas T. Hicks, “Good Decisions
Require Good Models: Developing Activity-Based Solutions that Work for
Decision Makers,” Cost Management, March/April 2005, pp 32-40, and
Michael D. Shields and Michael A. McEwen, “Implementing Activity-Based
Costing Systems Successfully,” Cost Management, Winter, 1996, pp15-22.
5-19
Chapter 5 – Activity-Based Costing and Customer Profitability Analysis
PROBLEMS
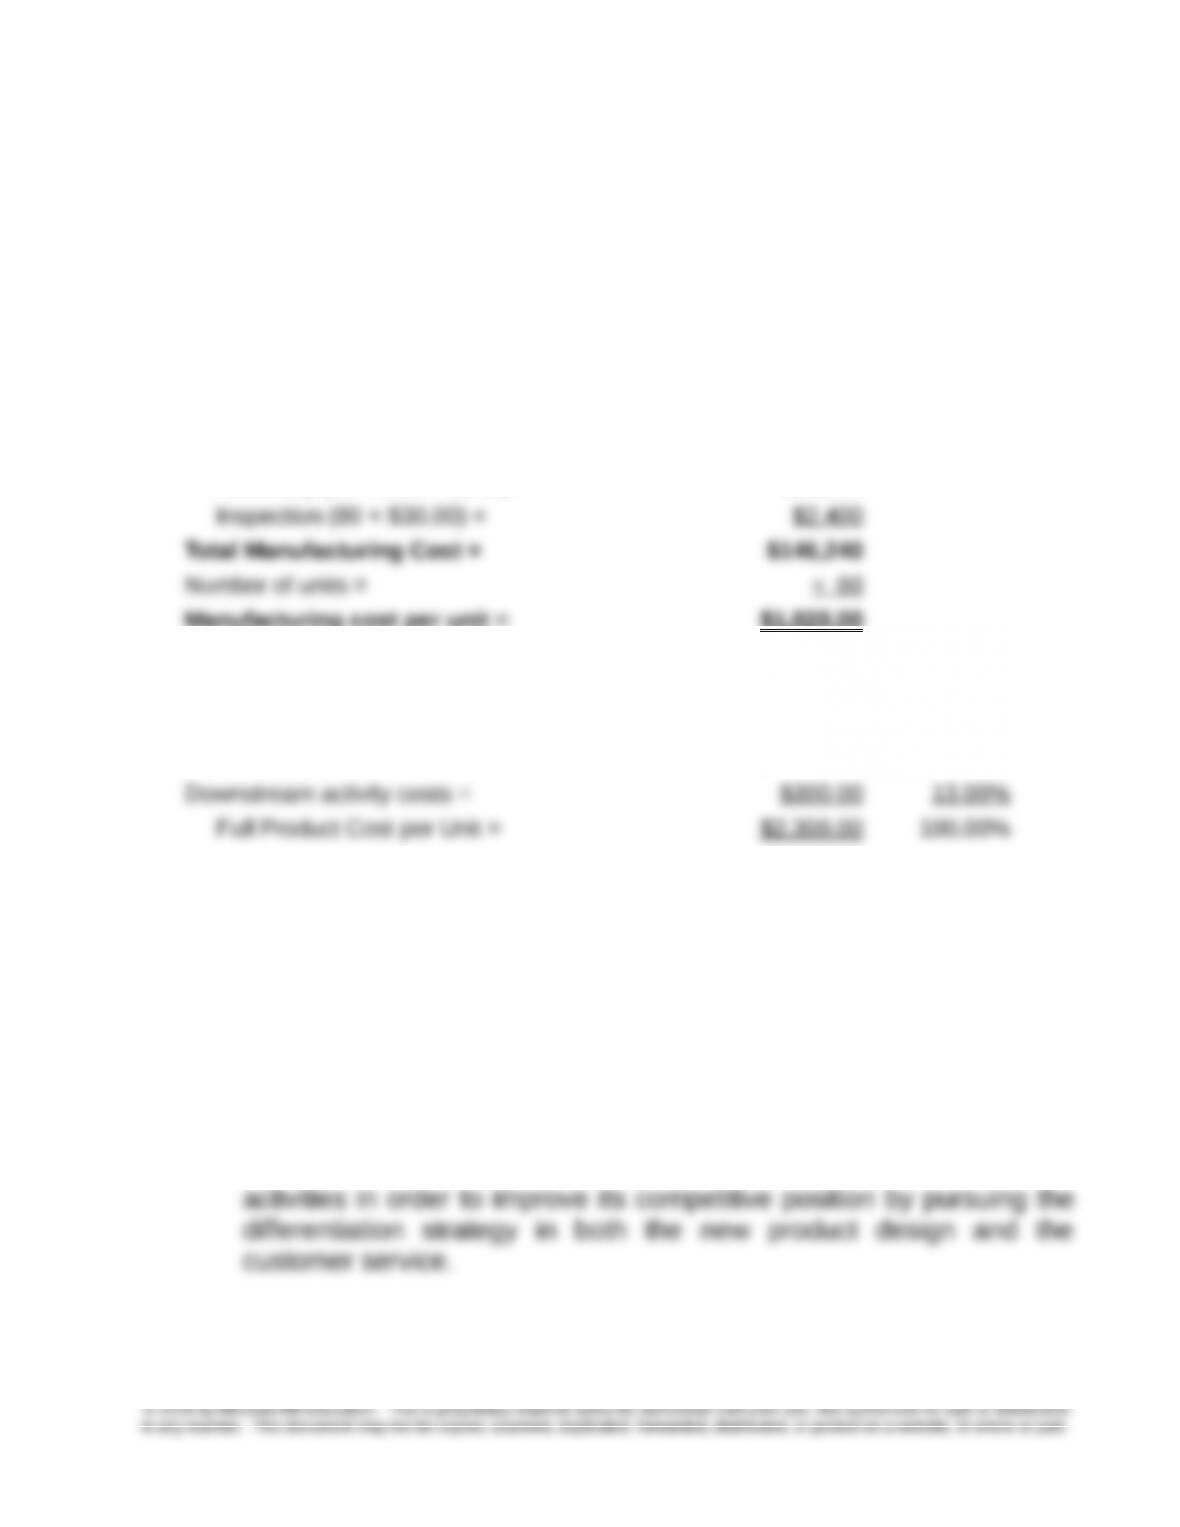
5-38 Activity-Based Costing, Value Chain Analysis (25 min)
1. Manufacturing cost (total, and per unit):
Prime manufacturing cost (80 ×$1,300) = $104,000
Manufacturing overhead:
Materials handling (80 × 100 × $0.60) = $4,800
Machining (80 × 3 × $51.00) = $12,240
Assembly (80 × 100 × $2.85) = $22,800
Manufacturing cost per unit = $1,828.00
2. Computation of full cost:
Upstream activity costs = $180.00 7.80%
Manufacturing costs = $1,828.00 79.20%
Strategic implications:
(1) Knowing the full cost of a product including upstream and
downstream costs allows the firm to be aware of all costs attributable
to the product.
(2) The amounts and proportions of upstream, manufacturing, and
downstream costs facilitate comparisons with competitors.
(3) The company should consider ways of spending less cost in the
manufacturing activity, and more on upstream and downstream
5-20