
Chapter 05 – Activity-Based Costing and Customer Profitability Analysis
3. Steps in ABC Costing
Step 1 – Identify resource costs and activities
Step 2 – Assign overhead to activity center or cost pools using resource consumption cost driver
Step 3 – Costs are assigned to products according to the number of the activities needed to
complete the product.
An activity is any event or transaction that is a cost driver (e.g. it causes the incurrence of cost,
examples: machine time, purchase order, and machine setups.
C. Activity-Based Cost Hierarchy:
a. Unit,
b. Batch,
c. Product-Sustaining,
d. Facility-Sustaining.
a. Unit Level – Performed for each unit of product produced
Examples of activity cost
Cost of inserting a component
Utilities to operate equipment
Sales commissions
b. Batch Level – Performed for each batch of product produced
Examples of activity cost
Cost of processing sales order
Cost of issuing and tracking purchase order
Cost of equipment setup
Cost of moving batch between workstations
Inspection cost per batch
c. Product Level – Performed to support each type of product
Examples of activity cost
Cost of administering product parts
Cost of product marketing, such as advertising
Cost of designing product
d. Facility Level – Performed to maintain general manufacturing capabilities
Examples
Maintenance cost pertaining to general facilities such as buildings and ground
Property taxes
Insurance
Two factors must be considered in selecting cost drivers:
a. the ease of obtaining data relating to the cost driver, and
b. the degree to which the cost driver measures actual consumption by products of the activity.
D. Benefits and limitations of ABC
Benefits
Better profitability measures.
Better decision and control.
Better information for controlling capacity cost.
5-7
Education.

Chapter 05 – Activity-Based Costing and Customer Profitability Analysis
Limitations
Not all costs have appropriate or unambiguous activity drivers.
Product or service costs identified by an ABC system are likely to not include all costs
associated with the product or service.
ABC system is not cost free and is time–consuming to develop and implement.
E. Activity-Based management (ABM). ABM focuses on managing activities in order to improve
business efficiency and effectiveness, and to improve the value received by customers as well as the
firm’s profits. ABC uses the information to improve the allocation of cost to products and
services. ABM uses activity information to reduce costs and improve product profitability.
Activity-based management focuses on managing activities–including identifying activities that
can be eliminated–and making sure that needed activities that cannot be eliminated are carried out
efficiently. To improve operations, management must search out unnecessary or inefficient activities,
determine the cost drivers for the activities, and change the level of those cost drivers. The major task
of the activity analysis is to identify high-value-added and low-value-added activities.
A high-value-added activity is an activity that is judged to contribute to (1) customer value and
satisfaction or (2) satisfy an organizational need. Examples include designing products, direct labor
processing, addition of direct materials, machining, and delivering products.
A low-value-added activity is an activity that is considered to contribute little or nothing to
customer value or to the organization’s needs. Examples include setting up, moving, waiting,
repairing, inspecting, and storing.
The percentages of high-value and low-value added activity differ by industry and company. As a
general rule, process manufacturers (chemical, food) and service companies (insurance, banks)
initially find a lower percentage of low-value (10-20%). Discrete part manufacturers (automotive,
computers) and governmental agencies typically find a higher low-value percentage (20-35%). When
excess capacity and activity best practices are incorporated into the low-value calculation, waste
typically reaches 35-45% in many industries.
F. Customer-Profitability Analysis
Customer profitability analyses analyze and report revenues earned from customers and costs
incurred to earn these revenues.
Objectives of Customer Profitability Analysis
Identifying highly profitable customers,
Providing better services to highly profitable customers,
Setting prices according to cost to serve,
Furnishing relevant data for negotiations with customers,
Transforming unprofitable customers into profitable customers, and
Identifying and conceding permanent loss customers to competitors.
Customer cost analyses classify customer-related costs into cost categories based on activities and
cost drivers to service customers.
Customer cost hierarchy:
Unit-level – resources spent on activities performed to sell and deliver each unit to a customer.
Batch-level – resources spent on activities performed to sell and deliver a group of units to a
customer, regardless of the number of units involved.
Customer–sustaining- resources spent on activities performed to earn or support a customer,
regardless of the number of units or batches involved.
5-8
Education.
Chapter 05 – Activity-Based Costing and Customer Profitability Analysis
Distribution-channel- resources spent on each distribution channel that serves customers,
regardless of the number of units, batches, or customers involved.
Sales-sustaining – resources consumed to sustain sales and service activities that cannot be
traced to an individual unit, batch, customer, or distribution channel.
Customer Lifetime Value: Using customer profitability analysis, and taking it a step further, the
value of a customer to an organization can be determined by calculating the net present value of all
future profits expected from the customer. This calculation is called customer lifetime value (CLV)
and is used widely in marketing and cost management in developing marketing plans and assessing
customer relationship programs.
G. ABC/ABM Implementation
Activity-based costing helps to reduce distortions caused by the volume-based costing system and
obtains more accurate product costs. It provides a clear view of how the mix of a firm’s diverse
products, services, and activities contributes in the long run to the bottom line. But developing and
implementing an ABC system is expensive and time-consuming. Resistance to change is most often
given as the prime reason for the failure of most ABC initiatives. Next come with the general
lack of improvement targets, timeframes and training. The management accountant needs to get
involved as a team player to help the firm develop and implement a successful ABC system.
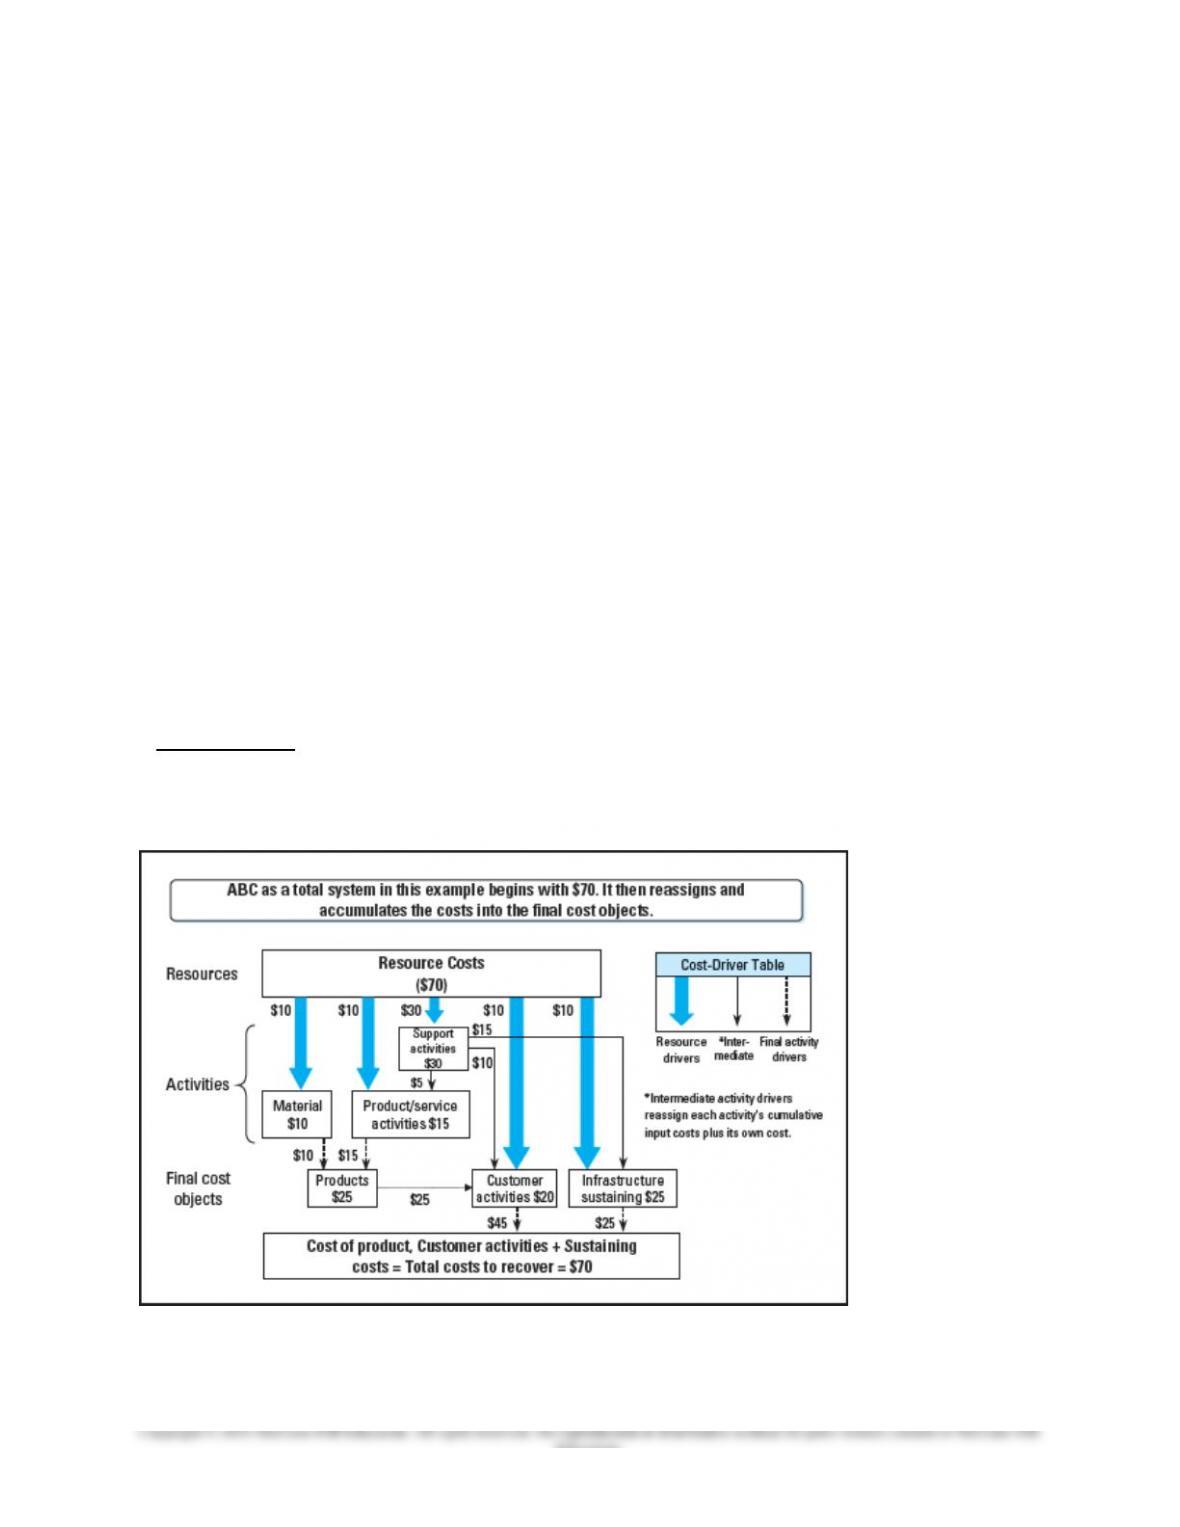
Implementing ABC/M involves three possible extensions of the basic ABC/M model – multistage ABC,
Resource Consumption Accounting (RCA), and Time-Drive Activity-Based Costing (TDABC).
Multistage ABC
Multistage ABC exists often in practice, where organizations have a complex interaction among
activities such that support departments serve other support departments as well as production
departments. The higher level of complexity is captured by more complex ABC models, as illustrated
below:
Time-Driven Activity-Based Costing (TDABC)
5-9
Education.

Another resource-centric approach to the implementation of large ABC costing
systems is based on the idea that the common element in the utilization of activities
is the unit of time. ABC traces and re-assigns resource expenses to the activities that consume them
and then further re-assigns them proportionately to the final cost objects based on the quantity of each
activity’s cost driver. When a substantial amount of the cost of a company’s activities are in a highly
repetitive process (much like in the RCA example above), the cost assignment can be based on the
average time required for each activity. Time-Driven Activity-Based Costing (TDABC) assigns
resource costs directly to cost objects using the cost per time unit of supplying the resource,
rather than first assigning costs to activities and then from activities to cost objects.
To illustrate TDABC. TDABC computes the cost per minute of the resources
performing the work activity. Assume 2 clerical workers paid $45,000 annually
perform a certain activity that is expected to require 17 minutes. TDABC calculates
the total cost as $45,000 x 2 = $90,000; TDABC then calculates the total time
available for the activity as 180,000 minutes (assuming 30 hours per week with two
weeks vacation: 2 workers x 50 weeks x 30 hours x 60 minutes per hour =
180,000 minutes per year).
The TDAC rate for the activity is $0.50 per minute ($90,000 / 180,000). The cost of
a unit of activity is $0.50 x 17 min = $8.50; if the activity required 20 min, then the
allocation would be $.50 x 20 = $10.
Resource Consumption Accounting (RCA)
Resource consumption accounting (RCA) is relatively new to the ield of cost
management and is an integration of principle from the German costing system
Grenzplankostenrechnung (GPK) and ABC. On the RCA Institute website (
www.rcainstitute.org ), RCA is formally deined as “a dynamic, fully integrated,
principle-based, and comprehensive management accounting approach that
provides managers with decision support information for enterprise optimization.” 5
Like ABC, RCA uses an activity/process view but integrates marginal costs and a
detailed resource consumption analysis to generate information for decision
support. Another notable feature of RCA is that depreciation expense is based on an
estimated replacement cost for the asset rather than historical acquisition cost.
An Illustration of the Five Steps for Strategic Decision Making for ABC Costing Follows:
The Five Steps of Strategic Decision Making for Haymarket BioTech Inc
Haymarket Biotech, Inc. (HBT) produces and sells two secure communications systems, AW
(Anywhere) and SZ (SecureZone). AW uses satellite technology and allows customers to communicate
anywhere on the earth. SZ uses similar technology except it allows communication between two parties
who are within 10 miles of each other. HBT operates in a very small but competitive industry. The
customers are governmental and corporate customers for whom these products are critical; the customers
rely on HBT’s ability to quickly adapt its products to threats from devices that would compromise the
security of the products. SZ has been successful for nearly 10 years and has undergone a number of
improvements in this time; sales are expected to continue to grow at 8-10% per year. AW, a more recent
product, has also been successful, but demand has not been as strong and sales growth is expected to be 3-
5% per year. Because of the higher profitability of the AW system (Exhibit 5.5), HBT is considering an
extensive advertising campaign to boost sales of AW, and to make plans for reallocating manufacturing
5-10
Education.

Chapter 05 – Activity-Based Costing and Customer Profitability Analysis
facilities from SZ to AW to make this possible. HBT has the following operating data for the two
products.
1. Determine the Strategic Issues Surrounding the Problem.
HBT competes on product leadership (differentiation) as its customers rely on the ability of these
products to provide secure communications. Because innovation is a key customer buying criteria,
HBT must take a long-term focus on developing innovations that meet expected future customer
expectations, and to implement these innovations into successful, profitable products.
2. Identify the Alternative Actions:
HBT is considering an advertising campaign and reallocation of manufacturing facilities to favor the
AW product line over the SZ.
3. Obtain Information and Conduct Analyses of the Alternatives
The information available to HBT under the volume-based cost system shows a unit margin of $100
for AW and $45 for SZ, while the ABC-based cost system shows unit margins for AW and SZ of $45
and $58.75, respectively. As the ABC system provides more comprehensive and accurate cost
information, HBT should rely on the latter figures which show that on a unit basis the SZ product is
more profitable.
4. Based on Strategy and Analysis, Choose and Implement the Desired Alternative
Considering the ABC cost information and the higher margins for SZ relative to AW, the plans to
promote AW and reallocate manufacturing facilities from SZ to AW are not consistent with HBT’s
long-term growth and profitability. The firm’s best advantage for future growth and profitability
would be to put resources behind SZ rather than AW.
5. Provide an On-going Evaluation of the Effectiveness of implementation in Step 4.
HBT should continue to review the ABC based costs and unit margins of existing and new products,
together with long-term projections of sales and customer expectations for these products, to choose
the products with the best advantage for long-term growth and profitability.
5-11
Education.