
Chapter 20 – Management Compensation, Business Analysis, and Business Valuation
Chapter 20
Management Compensation, Business Analysis, and Business
Valuation
Teaching Notes for Cases
20-1. Midwest Petro-Chemical Company: Evaluation of a Firm; Strategy
Adapted from teaching note provided by the case authors, David A. Kunz and Keith A. Russell
1. The case does not provide much information about the competitive environment for the firm, but we
know this is a commodity business, and the nature of the competition is therefore most likely to be cost
leadership. Appropriate compensation plans would be tied directly to managers’ ability to manage costs.
2. Analysis of company performance using ratio and industry norms as a benchmark.
Ratio/2013 Value Line Midwest
Profit margin 7.5% 2.4% ($2,315/$95,962)
Return on Assets 15.0% 5.3% ($2,315/$44,006)
(% earned total capital)
Return on Equity 17.5% 12.4% ($2,315/$18,657)
(% earned net worth)
Price Earning Ratio 18.5 7.3 ($22.50/$3.08)
Price to Book Value — .38 ($22.50/$58.74)
Operating Margin 17.0% 4.4% ($4,221/$95,962)
Income Tax Rate 35.5% 30.0% ($992/$3,307)
Per cent (%) Retained
to Common Equity 12.0% 85.0% ($16,698/$19,702)
Clearly, Midwest Petro-Chemical is a weak firm relative to industry norms, based on financial ratio
analysis.
Strengths of ratio analysis:
a. Provides an excellent historical profile of a firm.
b. Comparative information is readily available for public firms.
Weaknesses of ratio analysis:
a. Ratio analysis is an art; users have to make important judgments.
b. As firms diversify, become conglomerates, and/or multi-national, specific
industry/segment information is lost.
c. Even comparable-sized firms may use different accounting procedures with significant
20-1
Education.
Chapter 20 – Management Compensation, Business Analysis, and Business Valuation
3. Why did ratio analysis serve as an effective tool for Tom Williams?
As a banker, Williams was more concerned about loan repayment ability than about value.
4. Discuss each valuation method. What are strengths and weaknesses of each? What difficulties are
encountered when applying each method?
a. Asset-based or market value : The firm’s value can be determined by valuing the assets.
Three approaches to this method are;
Strengths of the asset method: Best used to value firms in natural resources or the securities
industry.
Weaknesses of the asset method: Not a popular method; techniques do not consider firm as a
going concern; historical or book value may bear little, if any, relationship to market value.
b. Market Comparison: Uses market values for similar forms to determine value.
Strengths: Can be useful for similar firms in terms of financial policies, if turnover ratios, profit
opportunity cost of funds by the investor. The rate typically contains two components:
1. a risk-free element equal to the rate earned on a short-term government instrument
(Treasury Bill, for example), and
2. a return premium equal to the risk factor associated with the firm being valued.
Strengths: Very popular with sophisticated investors; conceptually very strong.
Weaknesses: Complex; determination of risk premium requires a subjective judgment.
d. Capitalization of earnings: Based on the value of historical or future earnings divided by a
capitalization rate.
Historic earnings: An average of the firm’s net incomes is divided by the capitalization rate. If
1. Riskier businesses have higher capitalization rates
2. Firms with higher earnings growth rates have lower capitalization rates
20-2

Chapter 20 – Management Compensation, Business Analysis, and Business Valuation
Strengths: Used by knowledgeable investors; solid method for evaluating a low-risk firm.
Weaknesses: Capitalization rate determination is subjective (estimated); the method may be
somewhat difficult to understand.
5. Develop values for Midwest’s Petro-Chemical’s stock using the methods discussed in part 4.
. Asset-based or market value (000s omitted)
Exhibit One: Appraisal Value (Replacement) for land,
plant, property, and equipment $24,335
Plus: Book value of current assets 24,490
Less: Book value of liabilities 24,408
Asset base value $24,417
$24,417/751 shares outstanding = $32.51 per share.
B. Market Comparison:
Year Earnings per share
2013 $3.08
2012 $2.66
2011 $1.08
2010 $1.15
$7.97/ 4 years = $1.99 x 16* = $31.84
* sales price x earnings for Western Solvents (given in case)
20-3
Education.

Chapter 20 – Management Compensation, Business Analysis, and Business Valuation
C: Discounted Cash Flow
First, determine the cost of sales and income as a percent of sales as a basis for projecting income
for 1996-2000.
Statement of Income
for years ending December 31
($, 000s omitted)
2013 2012
Net Sales $95,652 (100%) $92,333
Cost and Expenses
Cost of Sales 77,719 (81.2%) 74,882
Selling G & A 13,712 (14.4%) 13,388
Total cost & Exp 91,431 (95.6%) 88,270
Operating Income 4,221 ( 4.4%) 4,063
Interest Expense 914 1,214
Income before Income Tax 3,307 2,849
Income Tax Exp. 992 854
Net Income $2,315 ( 2.4%) $1,995
Second, develop the income projections based on the above percentages for 2013 and 2012:
($,000 omitted)
2014 2015 2016 2017 2018
Sales
Cost of Sales
$99,000 $102,466 $106,050 $109,764 $113,605
Costs & Expenses 80,388 83,202 86,113 89,128 92,247
Selling G & A 14,256 14,755 15,271 15,806 16,359
Total Cost & Exp 94,644 97,957 101,384 104,934 108,606
Operating Income 4,356 4,509 4,666 4,830 4,999
Interest Expense 900 850 800 750 700
Income before
Income Tax 3,456 3,659 3,866 4,080 4,299
Income Tax Exp.
(30%)
1,037 1,098 1,160 1,224 1,290
Net Income $2,419 $2,561 $2,706 $2,856 $3,009
Earnings per share 3.22 3.41 3.60 3.80 4.01
Dividends per share .35 .40 .45 .50 .55
Third, develop Cash Flow Projections:
20-4

Chapter 20 – Management Compensation, Business Analysis, and Business Valuation
Cash Flow WC Cash Cash
Year NI Depr In Flow Out* Flow Net
2014 $2,419 + $800 = $ 3,219 – $385 = $2,834
2015 2,561 + 800 = 3,361 – 398 = 2,963
2016 2,706 + 800 = 3,506 – 412 = 3,094
2017 2,856 + 800 = 3,656 – 427 = 3,229
2018 3,009 + 800 + 3,809 – 442 = 3,367
*2013 Working Capital / Sales = % of Sales
CA $24,490/$95,652 = 25.6%
CL $13,509/$95,652 = 14.1%
11.5%
Supporting data for developing the cash flow projections:
WC Cash Flow Out: Changes in Sales
2014 = 3,348 x .115 = 385
2015 = 3,465 x .115 = 398
2016 = 3,586 x .115 = 412
2017 = 3,712 x .115 = 427
2018 = 3,842 x .115 = 442
Fourth, develop the valuation based on discounted cash flow:
Present Value
Cash Flow @ 15%*
2014 $2,834 x .8696 = $2,464
2015 2,963 x .7561 = 2,240
2016 3,094 x .6575 = 2,034
2017 3,229 x .5718 = 1,846
2018 34,930** x .4972 = 17,367
$ 25,951
$25,951 / 751 = $34.55
*Discount rate: Debt cost (balance sheet) .095
+ Premium (equity) .030
+ Premium (small firm) .025
.150
** Cash Flow plus stockholder equity ($,367 + 31,563)
Supporting data for the above:
Changes in Stockholder Equity (000s omitted):
NI Dividend SE
2013 $ $ $ 19,702
2014 2,419 – 263 = 21,858
2015 2,561 – 300 = 24,119
2016 2,706 – 338 = 26,487
2017 2,856 – 376 = 28,967
2018 3,009 – 413 = 31,563
20-5
Education.

Chapter 20 – Management Compensation, Business Analysis, and Business Valuation
Dividends (rounded to nearest 000s):
2014 .35 x $751,000 = $ 263,000
2015 .40 x 751,000= 300,000
2016 .45 x 751,000= 338,000
2017 .50 x 751,000= 376,000
2018 .55 x 751,000= 413,000
D. Capitalization of Earnings (000s omitted)
Net Income Begin SE* Return on Equity
2013 $ 2,315 / $17,612 = 13.1%
2014 1,995 / 15,805 = 12.6%
2015 809 / 15,161 = 5.3%
2016 865 / 14,446 = 6.0%
37.0% / 4 = 9.25%
* Year Begin SE NI – Dividends
2013 $19,702
2012 17,612 2,315 – 225 ($.30 x 751)
2011 15,805 1,995 – 188
2010 14,446 809 – 165
2009 15,161 865 – 150
Historic EPS
2013 – $3.08
2012 – 2.66
2011 – 1.08
2010 – 1.15
$7.97 / 4 = $1.99
$1.99 / .0925 = $21.51
Projected EPS
2014 – $ 3.22
2015 – 3.41
2016 – 3.60
2017 – 3.80
2018 – 4.01
$18.04 / 5 = $3.61
$ 3.61 / .0925 = $39.03
20-6
Education.
6. Based on your previous answers, develop a fair-market value for Midwest’s common stock.
Use an average for each of the values produced in part 5 above:
. Asset-based: $ 32.51
B. Market comparison: $ 31.84
C. Discounted cash flow: $ 34.55
D. Capitalization of earnings
1. Historic: $ 21.51
2. Projected: $ 39.03
$159.44 / 5 = $31.89
7. Have Frank Armstrong draft a response to Georgia Chemical in Atlanta covering the following
points:
The Board’s surprise at the purchase inquiry since Midwest has not made public an interest to
The above strategy would (1) determine the seriousness of the offer, (2) enable Allen and Warren to
complete their internal analysis of the value of Midwest, and (3) provide time for a “cooling-off” period
by the Board and provide time for reflection by Fletcher.
However, it should be noted that Fletcher owns 41.8% of Midwest shares. Also, the pension funds own
10.4% of the shares voted by Allen. These two blocks of stock give Fletcher 52.2% of the voting shares.
Allen will vote the pension fund shares the way Fletcher, his boss, tells him to vote the shares. In short,
Fletcher still controls Midwest. No sale will take place until Fletcher agrees to the sale no matter what
negotiations take place.
8. Once a price is agreed upon by a buyer and a seller, sales terms must be structured.
. Will the price be paid in cash at closing?
Rarely is the full purchase price paid in cash at closing.
As an initial cash payment plus future payments?
Yes, this is the traditional method of payment.
As stock or some combination of the aforementioned?
Possible, but not very likely. Sellers want as much cash as possible and buyers want as
much control of their new business as possible. Cash and debt instruments are the
preferred method of payment.
B. Will stock and assets be sold?
20-7
Education.

Chapter 20 – Management Compensation, Business Analysis, and Business Valuation
Either method of transfer of ownership is acceptable. Each part to the transaction needs to
address this issue in terms of tax liabilities, concern about unexpected events within the
firm, and related uncertainties.
Will the sales terms affect the price? YES.
Traditionally there is a continuum where all cash and lower sales price is at one end and
zero cash and higher sales price is at the other end. Sellers want cash, usually, and buyers,
usually, want to pay with anything but cash. The normal give and take of negotiating
works each group to a point on the continuum where each assumes they have optimized
their winning position.
20-8
Education.
20-2. Evaluating a Firm
This case describes the financial analysis of the W. T. Grant retail firm in the five years prior to its
bankruptcy in 1975. To disguise the case, the actual dates are not used in the text. The year 19X8
represents the actual year 1968, and so on. The case is useful to point out some of the limitations of
financial analysis based primarily on ratio analysis, and to point out the importance of analyzing cash
flows, especially for firms under financial stress, as was W. T Grant in the early 1970s.
The article by Largay and Stickney in the August, 1980 Financial Analysts Journal (“Cash Flows,
Ratio Analysis, and the W.T. Grant Company Bankruptcy”) is the basis for the following discussion.
“Although they surfaced as a gusher rather than a trickle, the problems that brought the W.T.
Grant Company into bankruptcy and ultimately, liquidation, did not develop overnight. Whereas
traditional ratio analysis of Grant’s financial statements would not have revealed the existence of many of
the company’s problems until 1970 or 1971, careful analysis of the company’s cash flows would have
revealed impending doom as much as a decade before the collapse.”
Grant’s continuing inability to generate cash from operations should have provided investors with
an early signal of problems. Yet as recently as 1973, Grant stock was selling at nearly 20 times earnings.
Investors placed a much higher value on Grant’s prospects than an analysis of the company’s cash flow
from operations would have warranted.” (Largay and Stickney, p51)
The analysis of liquidity and profitability ratios is shown below.
20-9
Chapter 20 – Management Compensation, Business Analysis, and Business Valuation
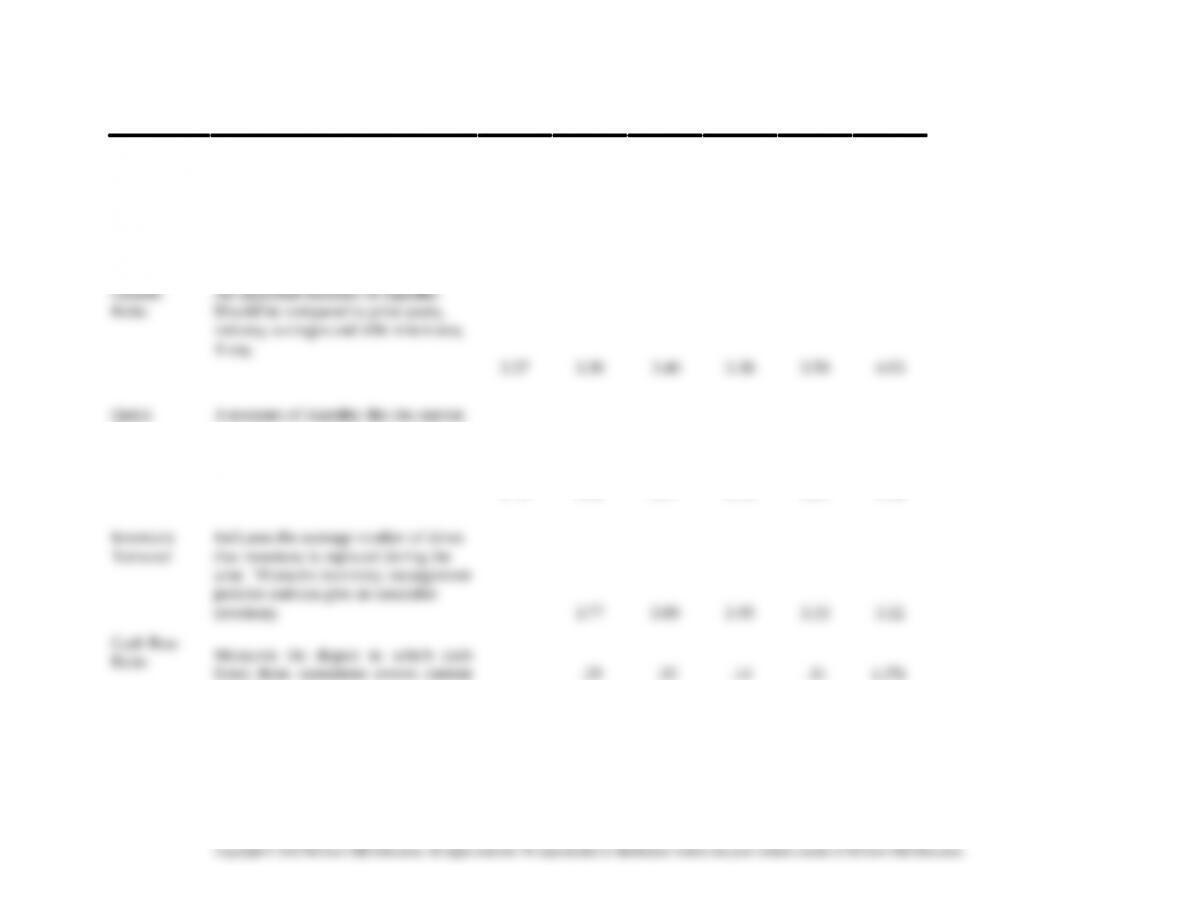
Liquidity
Ratios Relevance 2008 2009 2010 2011 2012 2013
A/R
Turnover
The average number of times per yr.
net receivables turn into cash.
Indicates effectiveness of credit policy
and collections. Should be compared
to prior years and to industry averages.
3.74 3.57 3.20 3.07 3.23
Ratio
(Acid Test)
ratio, but more conservative. Includes
only highly current assets-cash,
marketable securities, and receivables.
2.19 2.03 2.17 2.13 2.22 2.36
liabilities
Looks OK overall, but for recent buildup in inventory and receivables; all ratios look stable. The key is to see that the cash flow ratio is falling steadily, with a
sharp drop in the recent year. This shows that the company is beginning to fund operations through long term debt, a signal of sever liquidity problems. Note
that the conventional liquidity measures do not tend to show this, and disguise the rapid build up in receivables in inventory.
20-10