Chapter 19 – Strategic Performance Measurement—Investment Centers
19-36 (Continued-1)
Further, such differences likely have incentive effects. For example, if the
division in question currently generates an ROI greater than, say, 15% (or
even 11%), it is not clear that the manager of the division would be
motivated to accept the proposed investment, in spite of the fact that the
proposed investment is justified on a present-value (i.e., discounted cash
flow) basis.
In summary, this question ultimately deals with the incentive effects of using
one method for making long-term investment decisions (DCF, as
discussed in Chapter 12) and a different method for evaluating the
subsequent financial performance of the decision-maker and operating unit
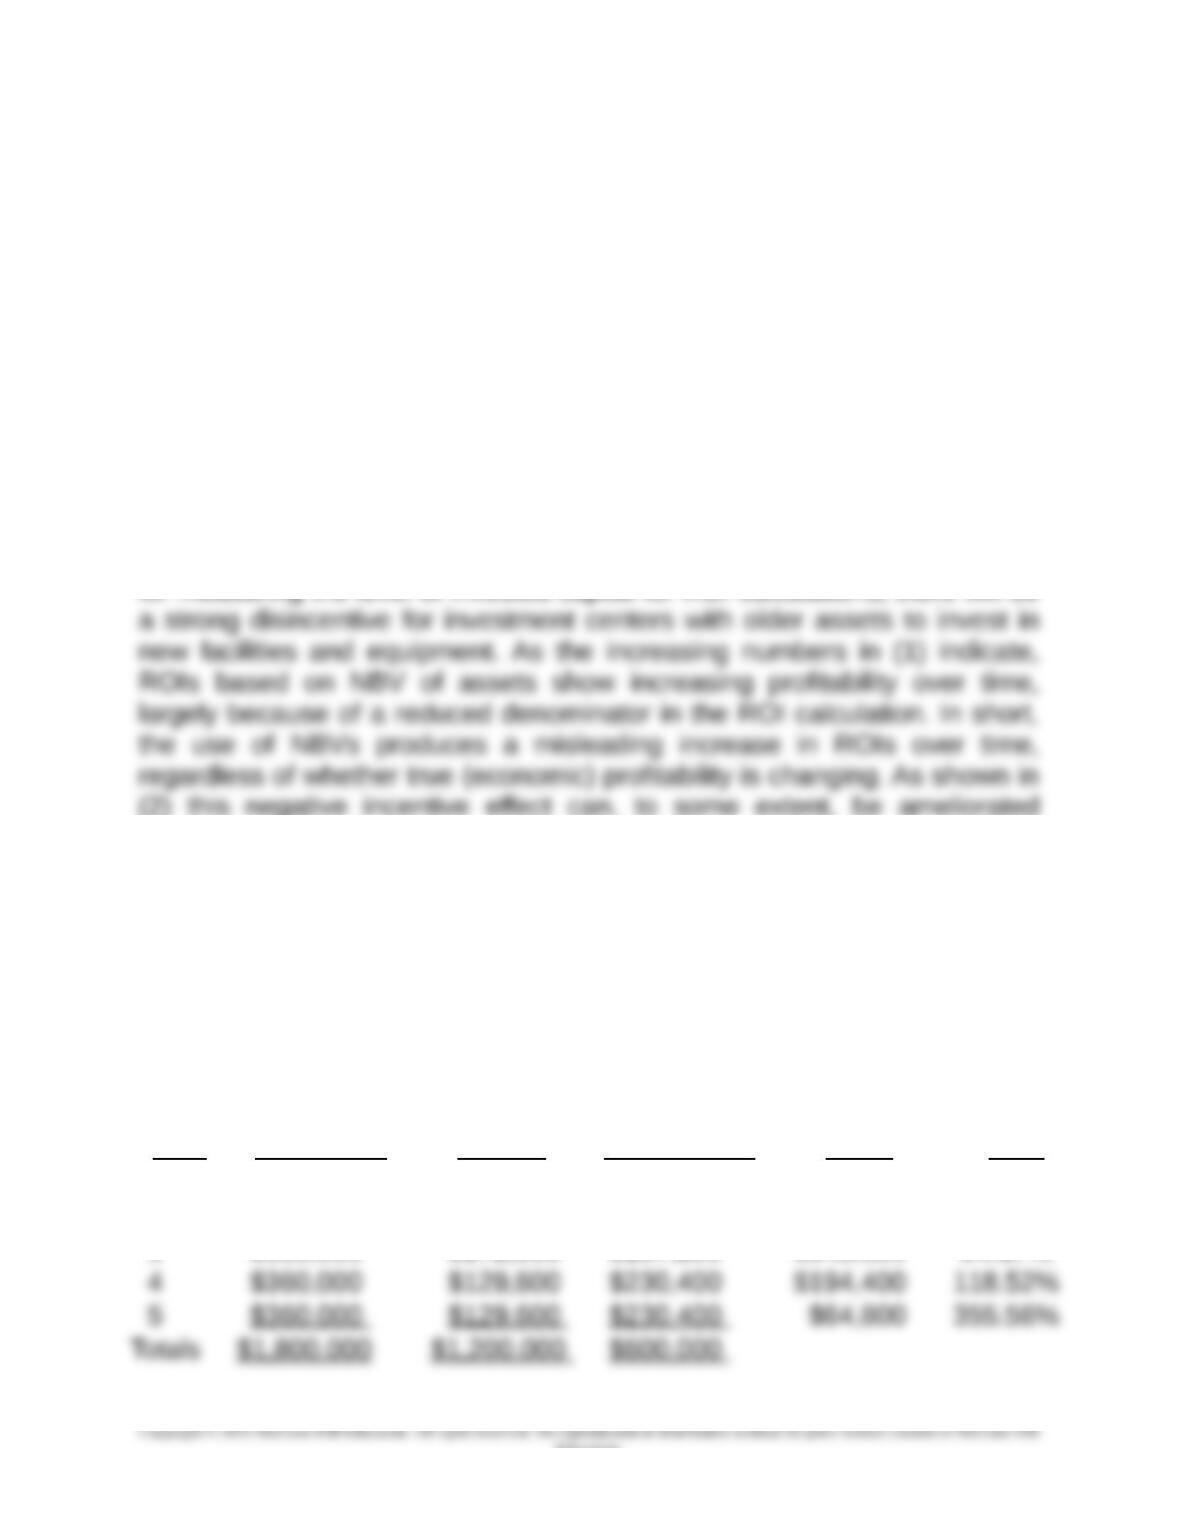
(e.g., ROI based on accrual-accounting data). If NBV is used as the basis
for measuring the level of invested capital for ROI calculations, there will be
(2) this negative incentive effect can, to some extent, be ameliorated
through the use of gross book values when measuring the investment base
in the ROI calculation. The important point, however, is the ability to identify
incentive effects associated with different implementation options of the
ROI performance metric.
4. Year-by-Year ROIs, based on average NBV of the investment and accelerated
(DDB) depreciation:
Year
Income Prior
to Deprec.
DDB
Depreciation
Charge
Operating
Income After
Depreciation
Average
NBV of
Asset
ROI
Based on
NBV
1 $360,000 $480,000 ($120,000) $960,000 (12.50%)
2 $360,000 $288,000 $72,000 $576,000 12.50%
3 $360,000 $172,800 $187,200 $345,600 54.17%
19-31
Education.
Chapter 19 – Strategic Performance Measurement—Investment Centers
19-36 (Continued-2)
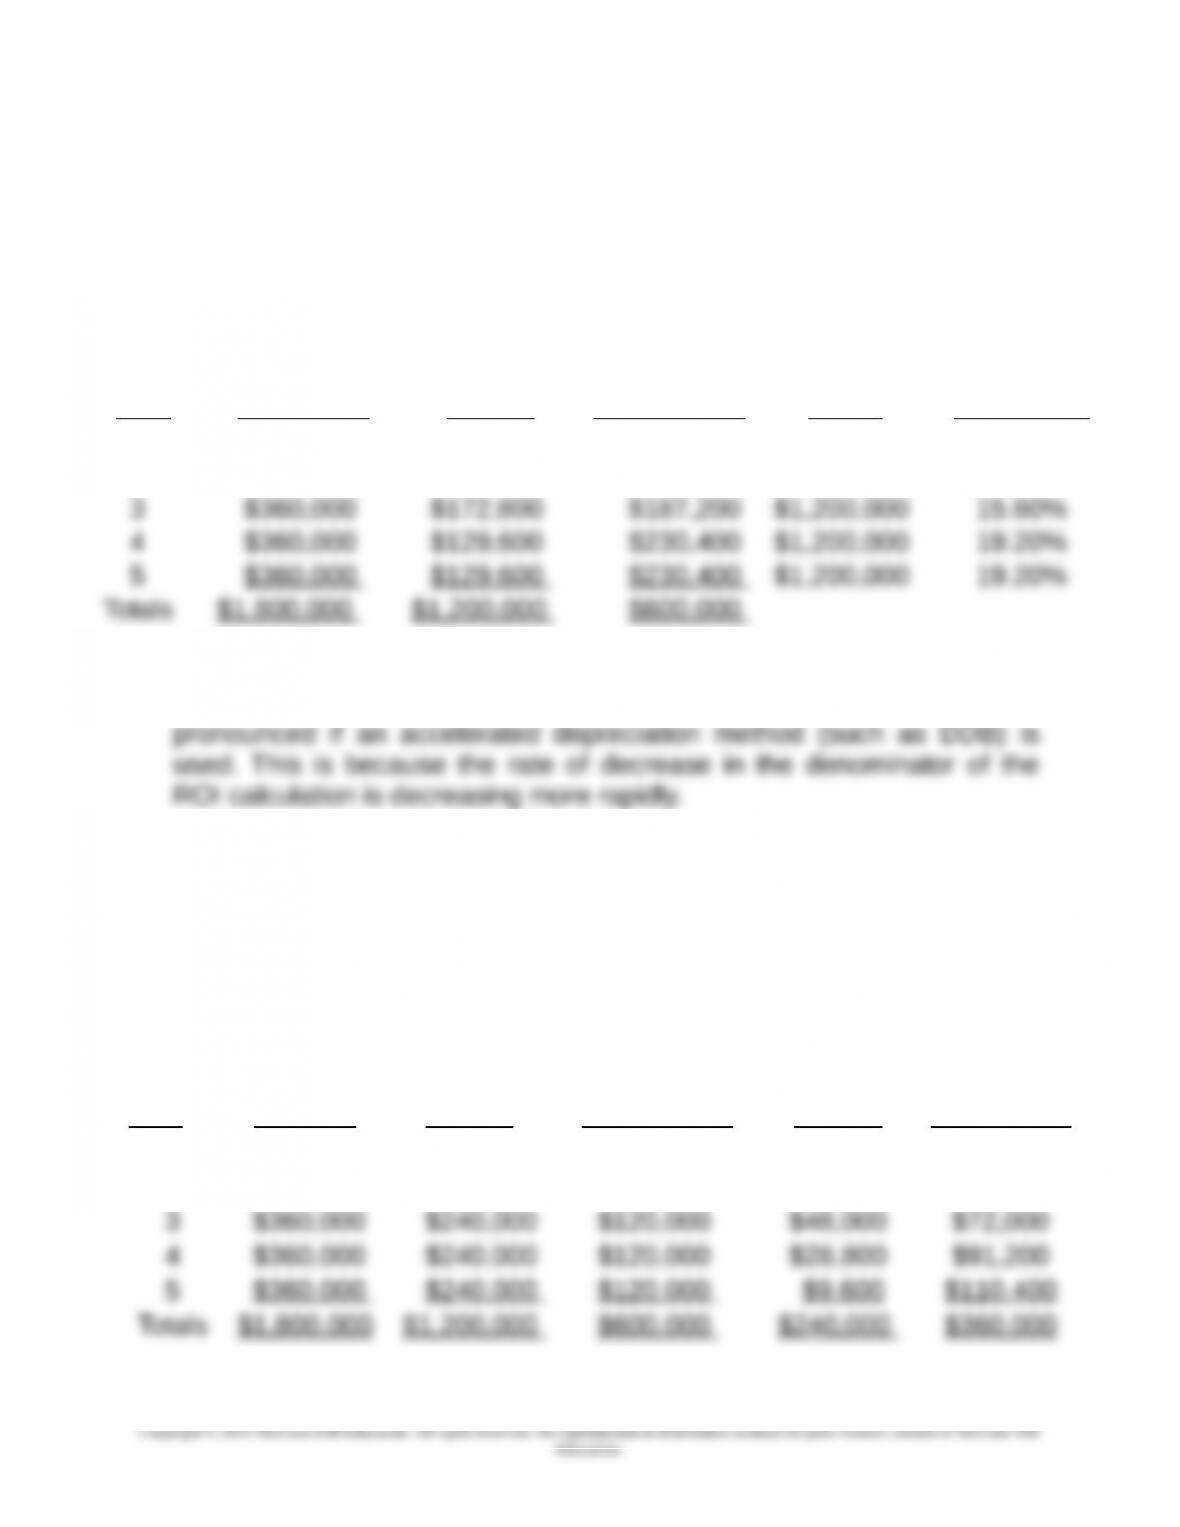
Year-by-year ROIs, based on GBV of the investment and DDB depreciation
(with a switch to SL depreciation in year 4):
DDB Operating Average
ROI Based
on
Income Prior Depreciation Income After Gross Book on Gross
Year to Deprec. Charge Depreciation Value Book Value
1 $360,000 $480,000 ($120,000) $1,200,000 (10.00%)
2 $360,000 $288,000 $72,000 $1,200,000 6.00%
Summary: the above results demonstrate that the bias associated with
the use of NBV versus GBV of the asset (investment) base is even more
5. Year-by-Year Financial Results: Residual Income (RI)
a. Using average NBV of long-lived assets as the investment base, and SL
depreciation (per requirement 1 above):
Income
Operating
Income
Less: 8%
Imputed
Year
Prior to
Deprec.
Depreciation
Charge
After
Depreciation
Capital
Charge
Residual
Income (RI)
1 $360,000 $240,000 $120,000 $86,400 $33,600
2 $360,000 $240,000 $120,000 $67,200 $52,800
19-32
Chapter 19 – Strategic Performance Measurement—Investment Centers
19-36 (Continued-3)
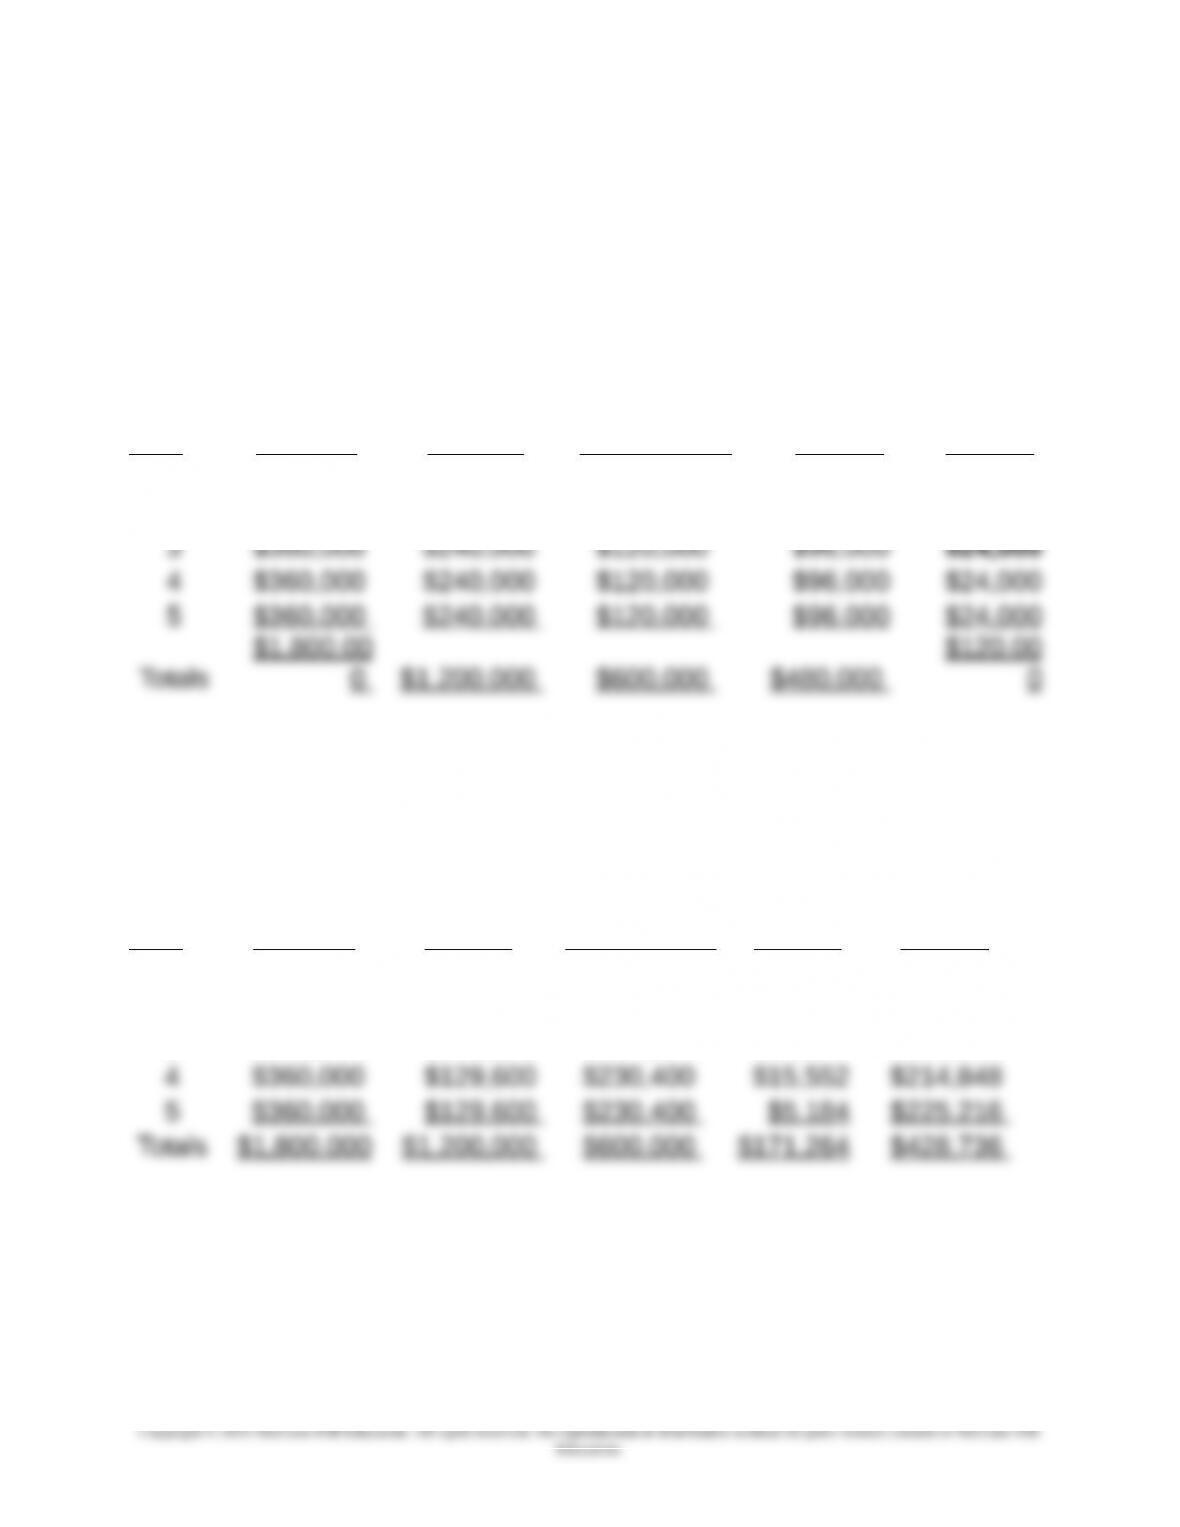
b. Using GBV of long-lived assets as the investment base, and SL
depreciation (per requirement 2 above):
Income
Operating
Income
Less: 8%
Imputed
Year
Prior to
Deprec.
Depreciatio
n Charge
After
Depreciation
Capital
Charge
Residual
Income
1 $360,000 $240,000 $120,000 $96,000 $24,000
2 $360,000 $240,000 $120,000 $96,000 $24,000
c. Using NBV as the investment base and DDB depreciation (per
requirement 4(1) above):
Year
Income
Prior to
Deprec.
Depreciation
Charge
Operating
Income After
Depreciation
Less: 8%
Imputed
Capital
Charge
Residual
Income
1 $360,000 $480,000 ($120,000) $76,800 ($196,800)
2 $360,000 $288,000 $72,000 $46,080 $4,800
3 $360,000 $172,800 $187,200 $27,648 $139,200
19-33
Chapter 19 – Strategic Performance Measurement—Investment Centers
19-36 (Continued-4)
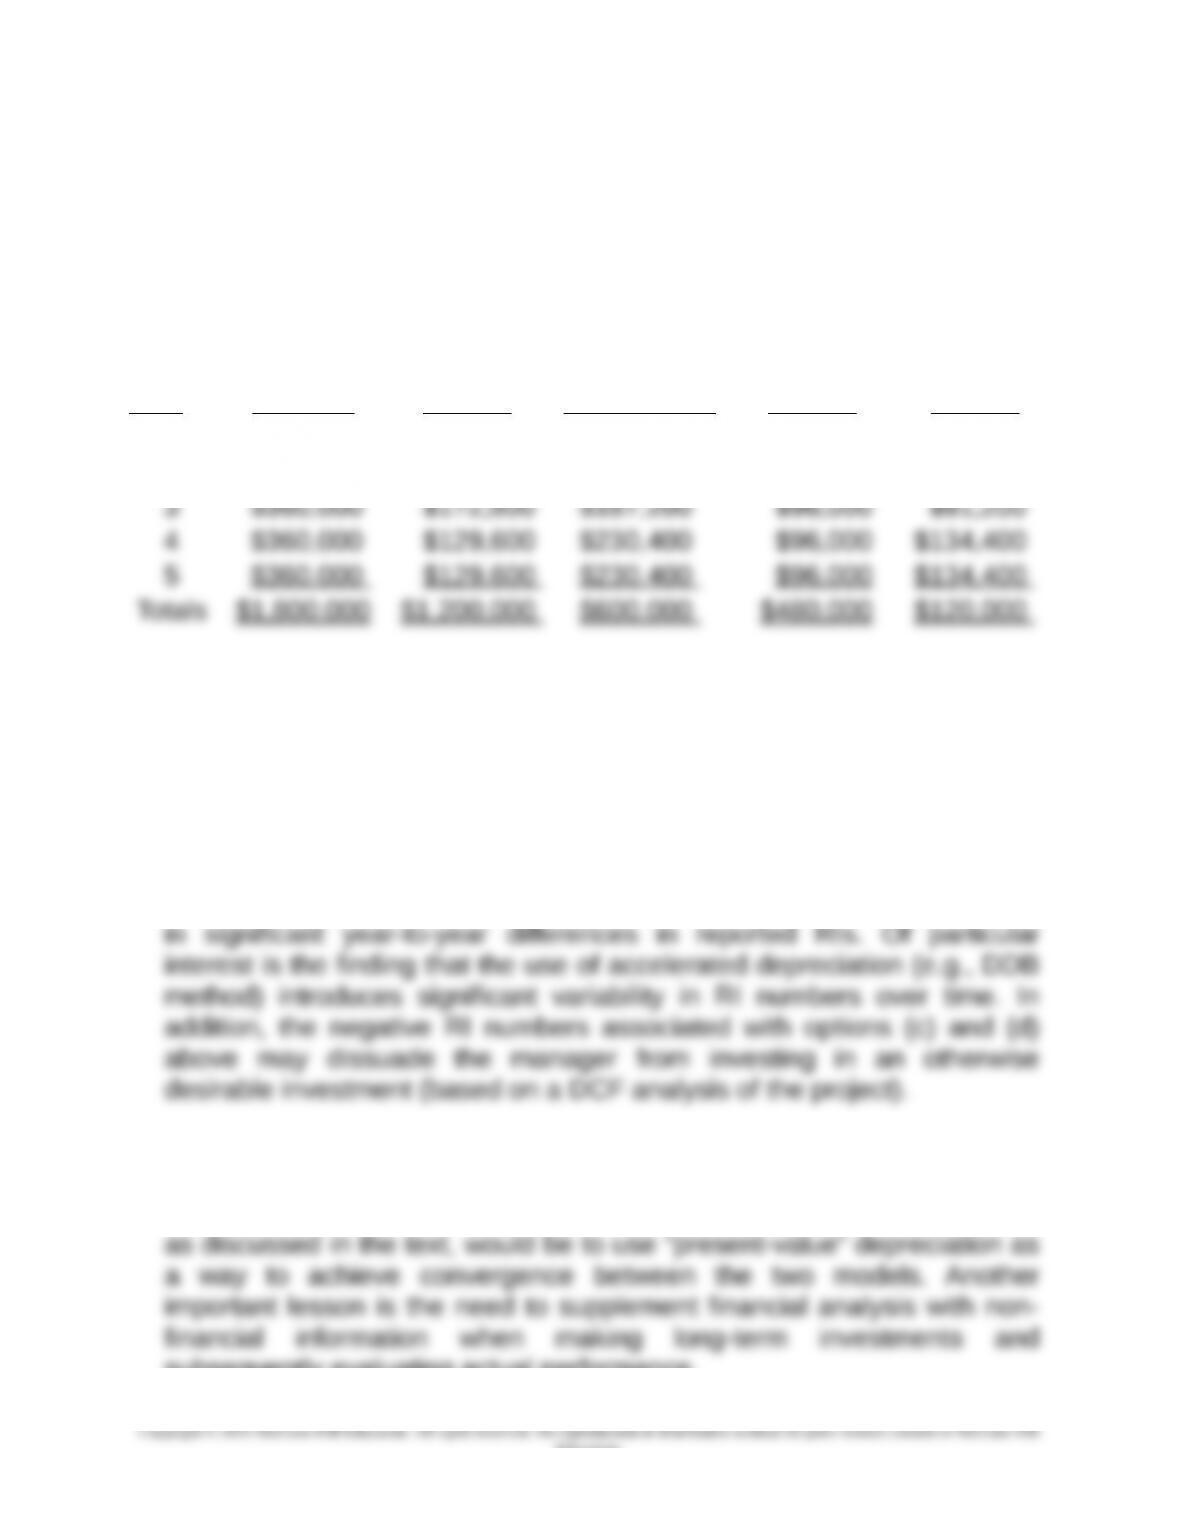
d. Using GBV as the investment base and DDB depreciation (per
requirement 4(2) above):
Year
Income
Prior to
Deprec.
Depreciation
Charge
Operating
Income After
Depreciation
Less: 8%
Imputed
Capital
Charge
Residual
Income
1 $360,000 $480,000 ($120,000) $96,000 ($216,000)
2 $360,000 $288,000 $72,000 $96,000 ($24,000)
The preceding results show that, as in the case with ROI, there is no
unambiguous way to calculate the residual income (RI) financial
performance indicator. Differences exist as to how RI is calculated.
These differences cause year-to-year differences in RI amounts, as
demonstrated by the calculations in (a) through (d) above. Note that the
differences observed in requirement 5 are attributable both to the
depreciation method chosen and to how the level of investment was
defined (operationalized). As shown above, these differences can result
Again, the basic issue is the existence of a disconnect between the
model used for long-term decision-making (i.e., DCF) and the model
used subsequently for assessing financial performance. One possibility,
subsequently evaluating actual performance.
19-34
Education.

Chapter 19 – Strategic Performance Measurement—Investment Centers
19-36 (Continued-5)
An Excel file solution for this assignment is embedded (below) into this
Word solution file. To access the Excel file solution, place the cursor
anywhere over the object, right-click, choose “Worksheet Object,” then
choose “open.”
Pr. 19-36 7e.xlsx
19-35
Education.
Chapter 19 – Strategic Performance Measurement—Investment Centers
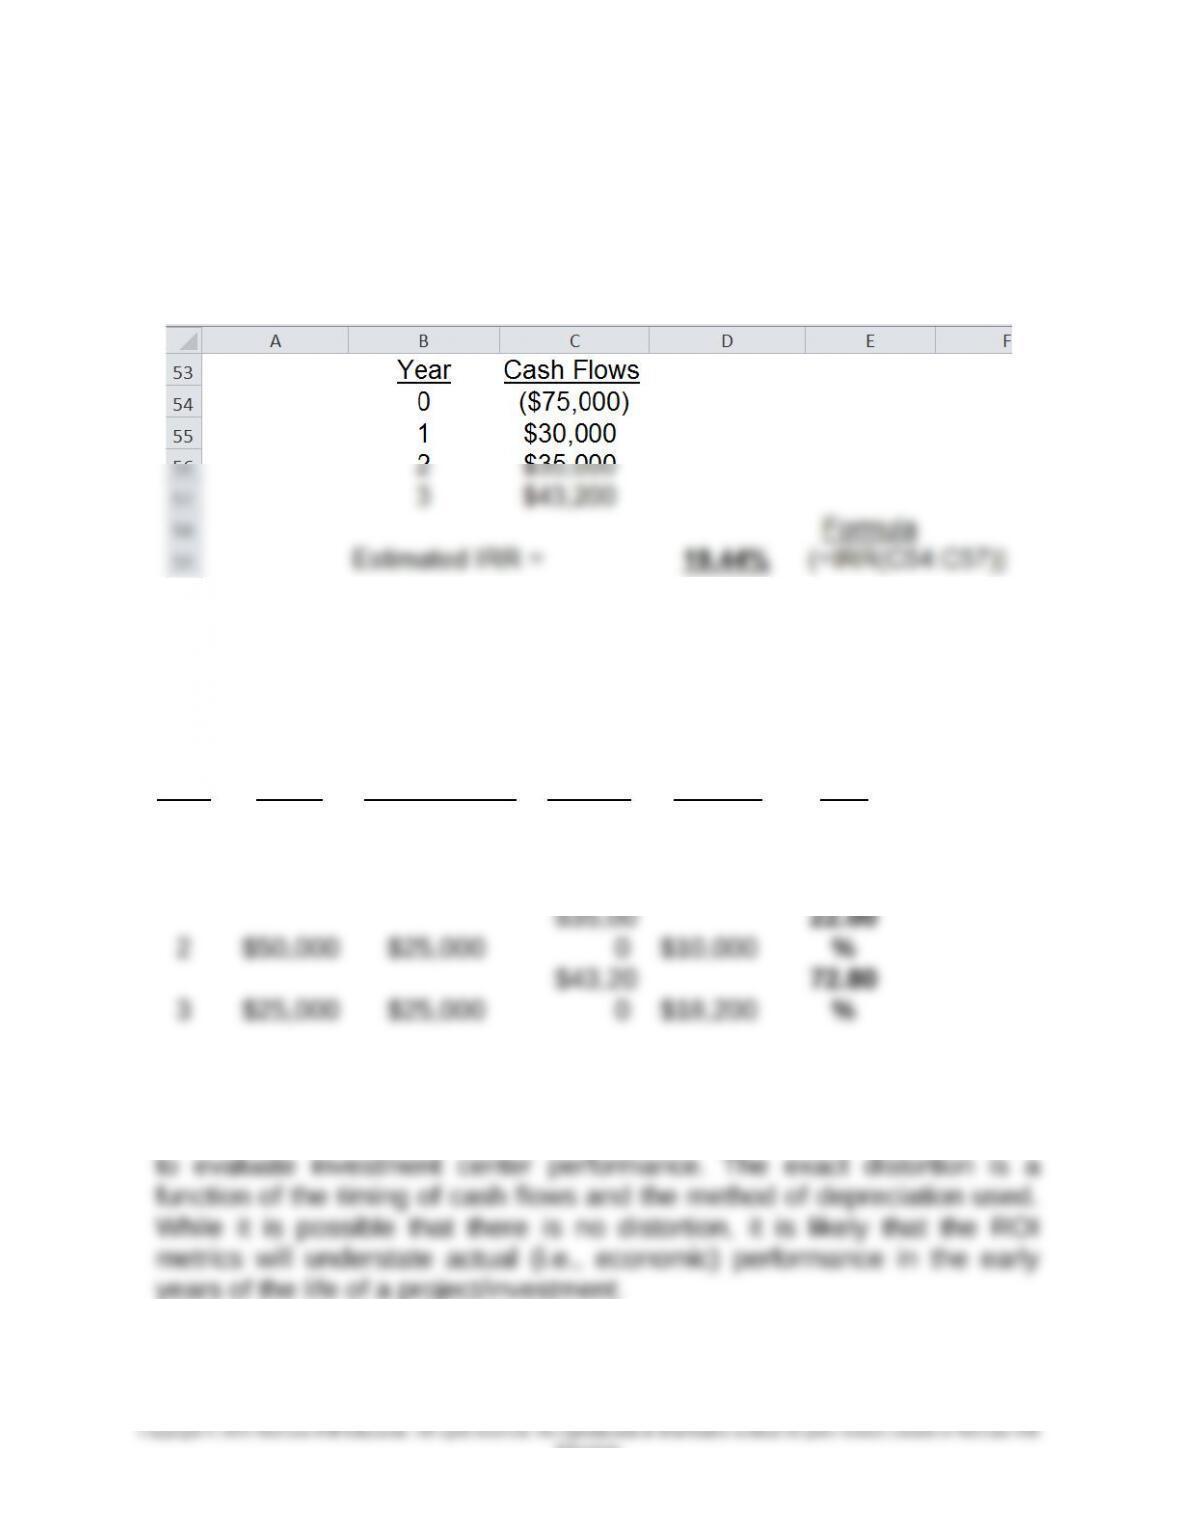
19-37 Return on Investment (ROI), Present-Value Depreciation;
Spreadsheet Application (60 Minutes)
1. Determining the IRR of the proposed investment (using the built-in
function in Excel):
2. Year-by-Year Accounting Rate of Return (SL depreciation);
Investment measured as beginning-of-year book value
BOY
Book SL Cash Operating
Year Value Depreciation Inflows Income ROI
0
1 $75,000 $25,000
$30,00
0 $5,000 6.67%
$35,00
22.00
Given the required rate of return for this company (15%), this project will
appear unsatisfactory in Year 1. The point of this example is to illustrate
the bias for new investment that exists when accrual-based data are used
19-36
Education.
Chapter 19 – Strategic Performance Measurement—Investment Centers
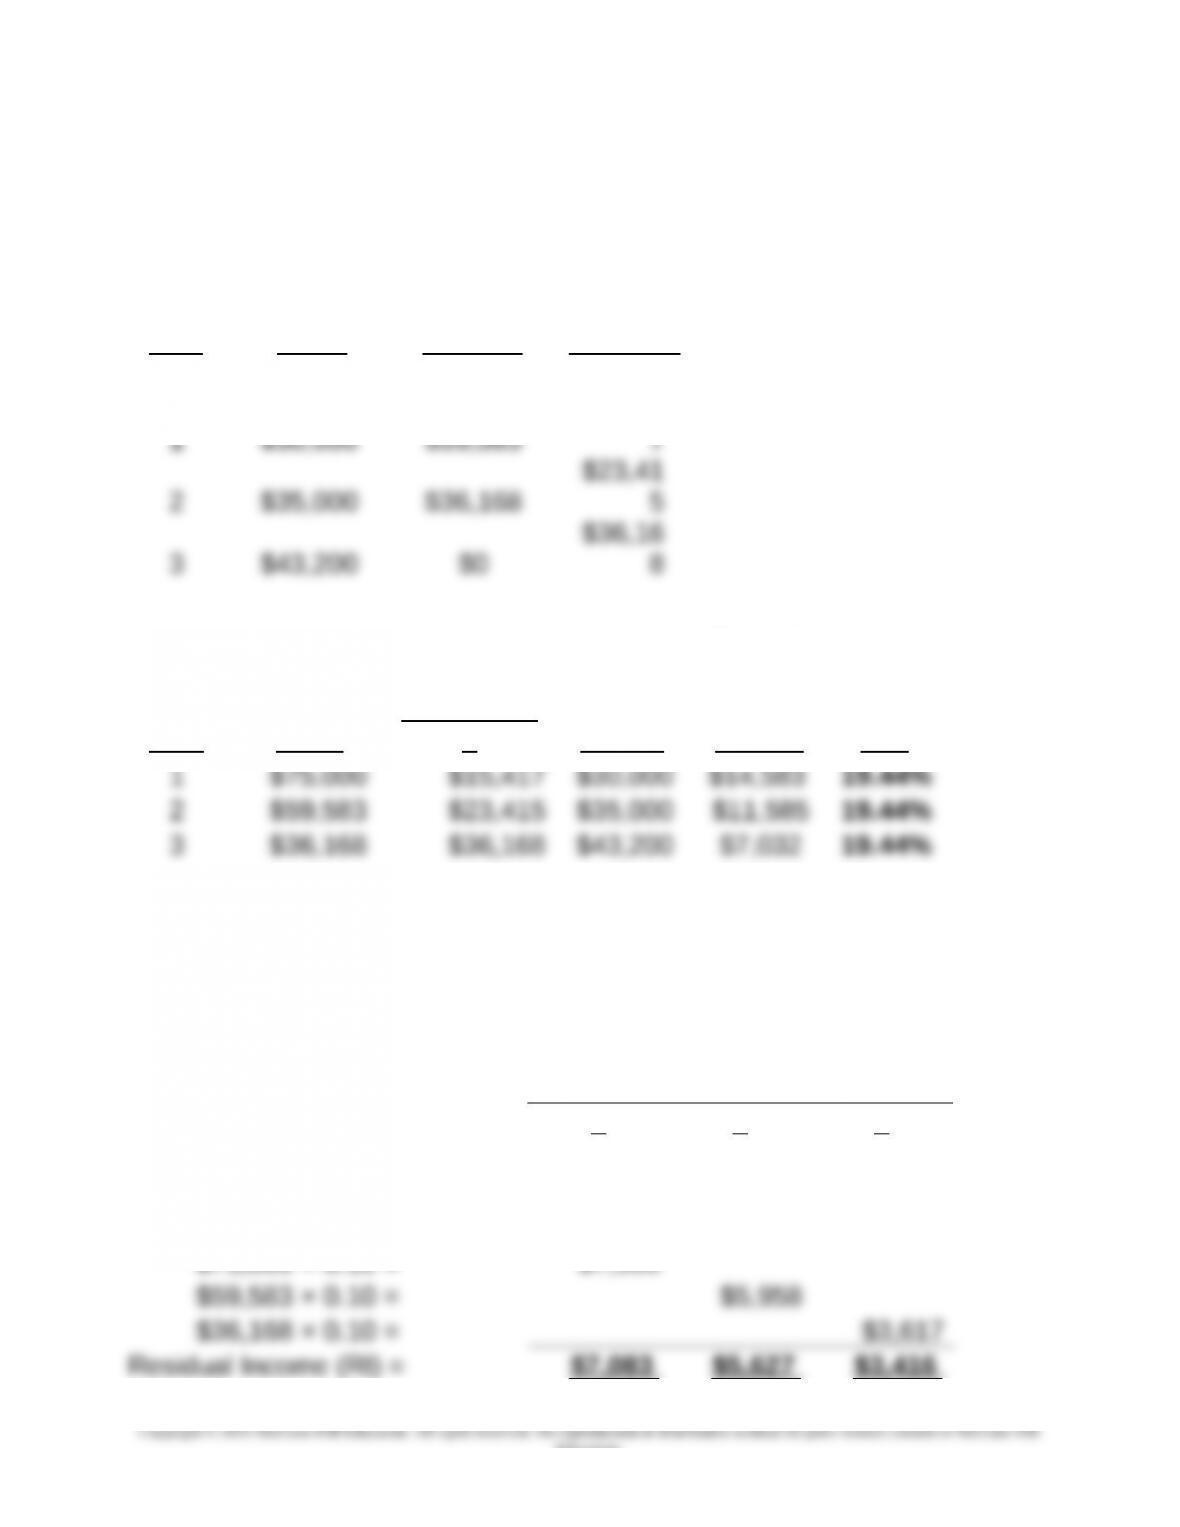
19-37 (Continued-1)
3. Year-by-Year ROI, Present-Value Depreciation:
PV of Cash Decrease
Cash Inflows (@ in PV of
Year Flows 19.44%) the Asset
0($75,000) $75,000
$15,41
BOY Book PV Cash
Operatin
g
Year Value
Depreciatio
n Inflows Income ROI
Summary: The use of present-value (i.e., “economic”) depreciation
reduces the negative incentive effects illustrated above in part 2.
4. Estimated Year-by-Year Residual Income (RI), Present-Value
Depreciation:
Year
123
Cash Inflows $30,000 $35,000 $43,200
Present Value Depreciation $15,417 $23,415 $36,168
Imputed Capital Charge:
$75,000 × 0.10 = $7,500
19-37
Education.

Chapter 19 – Strategic Performance Measurement—Investment Centers
19-38
Chapter 19 – Strategic Performance Measurement—Investment Centers
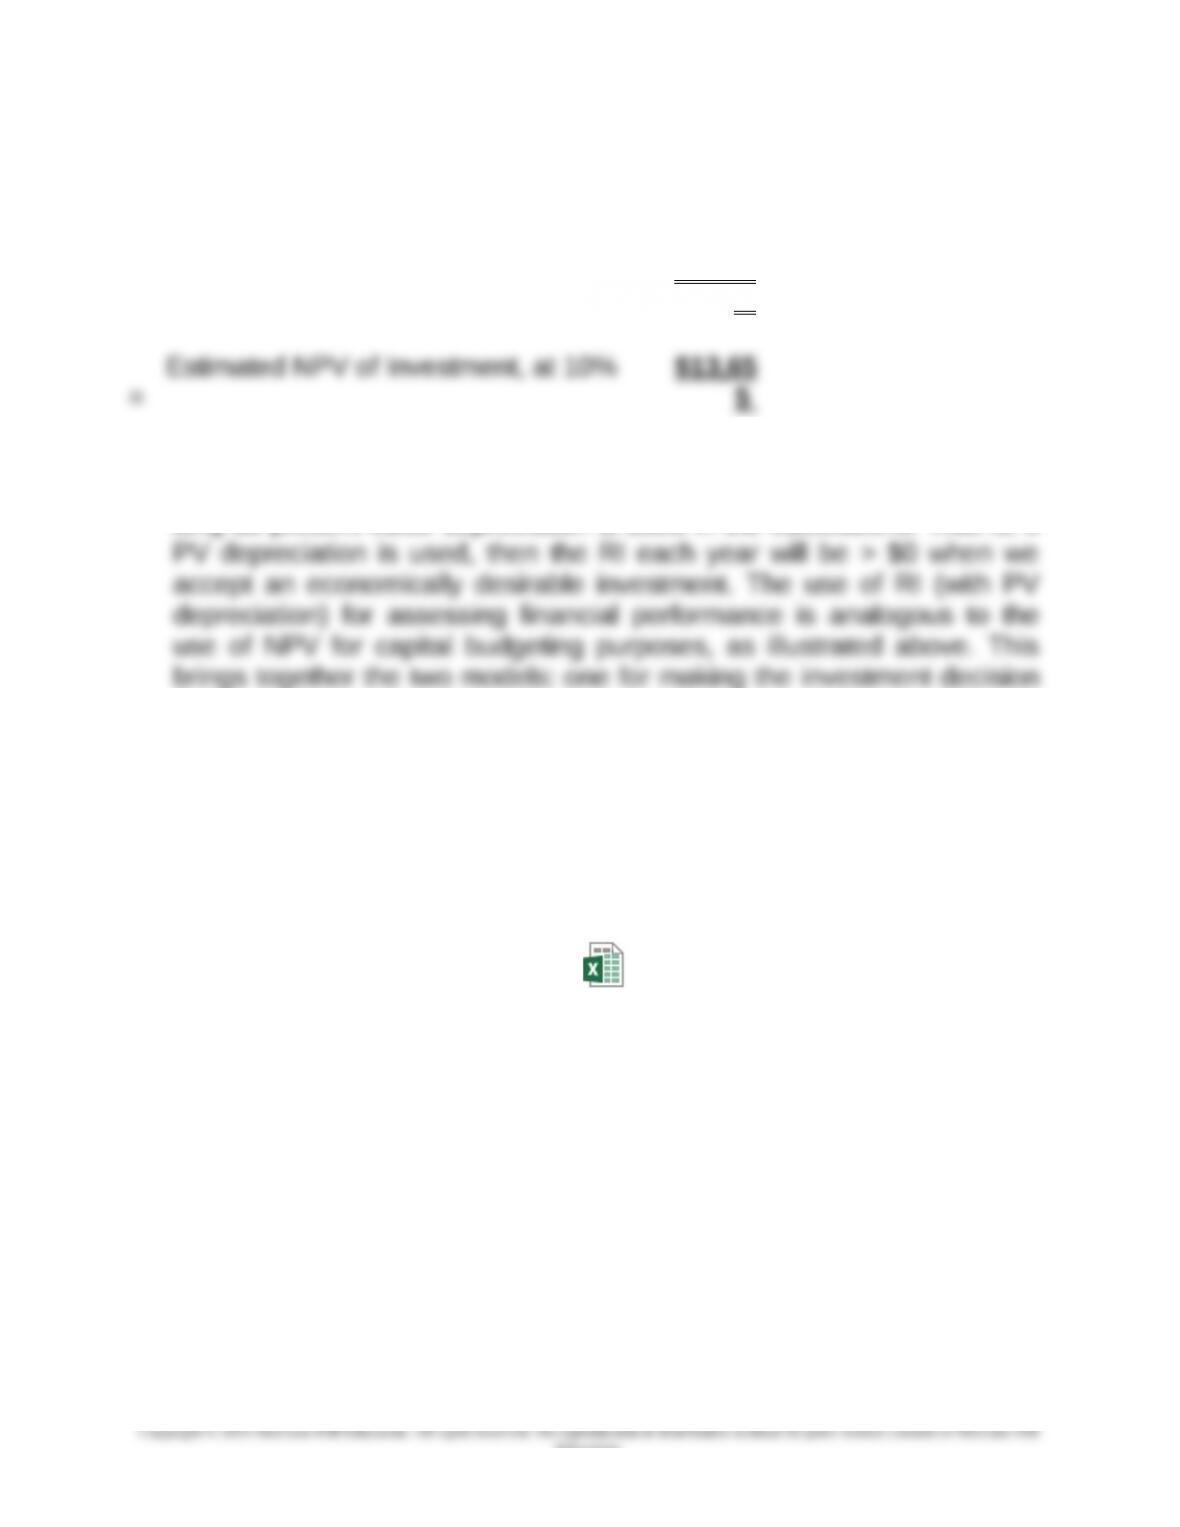
19-37 (Continued-2)
Using the built-in function (NPV) in Excel, we estimate the following:
Estimated NPV of RIs, at 10% =
$13,65
5
Summary: For an economically desirable project (as in the case here:
IRR > 10%), the RI for each year of a project’s life will be positive so
long as present-value depreciation is used in the calculations. That is, if
(NPV), and the other for evaluating subsequent performance (RI, with
PV depreciation).
An Excel file solution for this assignment is embedded (below) into this
Word solution file. To access the Excel file solution, place the cursor
anywhere over the object, right-click, choose “Worksheet Object,” then
choose “open.”
19-39
Education.
Pr. 19-37 7e.xlsx
Chapter 19 – Strategic Performance Measurement—Investment Centers
19-38 Research Assignment, Strategy (60 minutes, including reading time)
1. As the authors note on page 123 of their article, “Globalization has left
only one true path to profitability for firms operating in high-wage,
developed nations: to base their competitive strategy on exceptional
human capital management (HCM).” In the past, these same firms may
have been able to secure sustainable competitive advantage by
managing their financial or physical capital. Performance-measurement
systems for managing such assets are well-developed and key to
traditional management accounting and control systems. The
2. The overall purpose of the framework proposed by the authors is to
establish empirical linkages between “people” (or, the quality of HCM)
and organizational performance (e.g., sales revenue, factory safety,
student scores on standardized tests, or stock-market returns).
Conceptually, the authors are trying to model key HCM drivers of
five major categories.
From the standpoint of a management accounting and control system,
the key imperative is to focus, for the given organization, on the most
important HCM drivers of organizational success. This requires a
statistical analysis between HCM scores over time (or across
organizational units) and key organizational outcomes (such as
19-40
Education.