Chapter 19 – Strategic Performance Measurement—Investment Centers
19-24 Target Sales Price; Return on Investment (ROI) (20 minutes)
1. ROI = Operating Income ÷ Investment (avg. total assets)
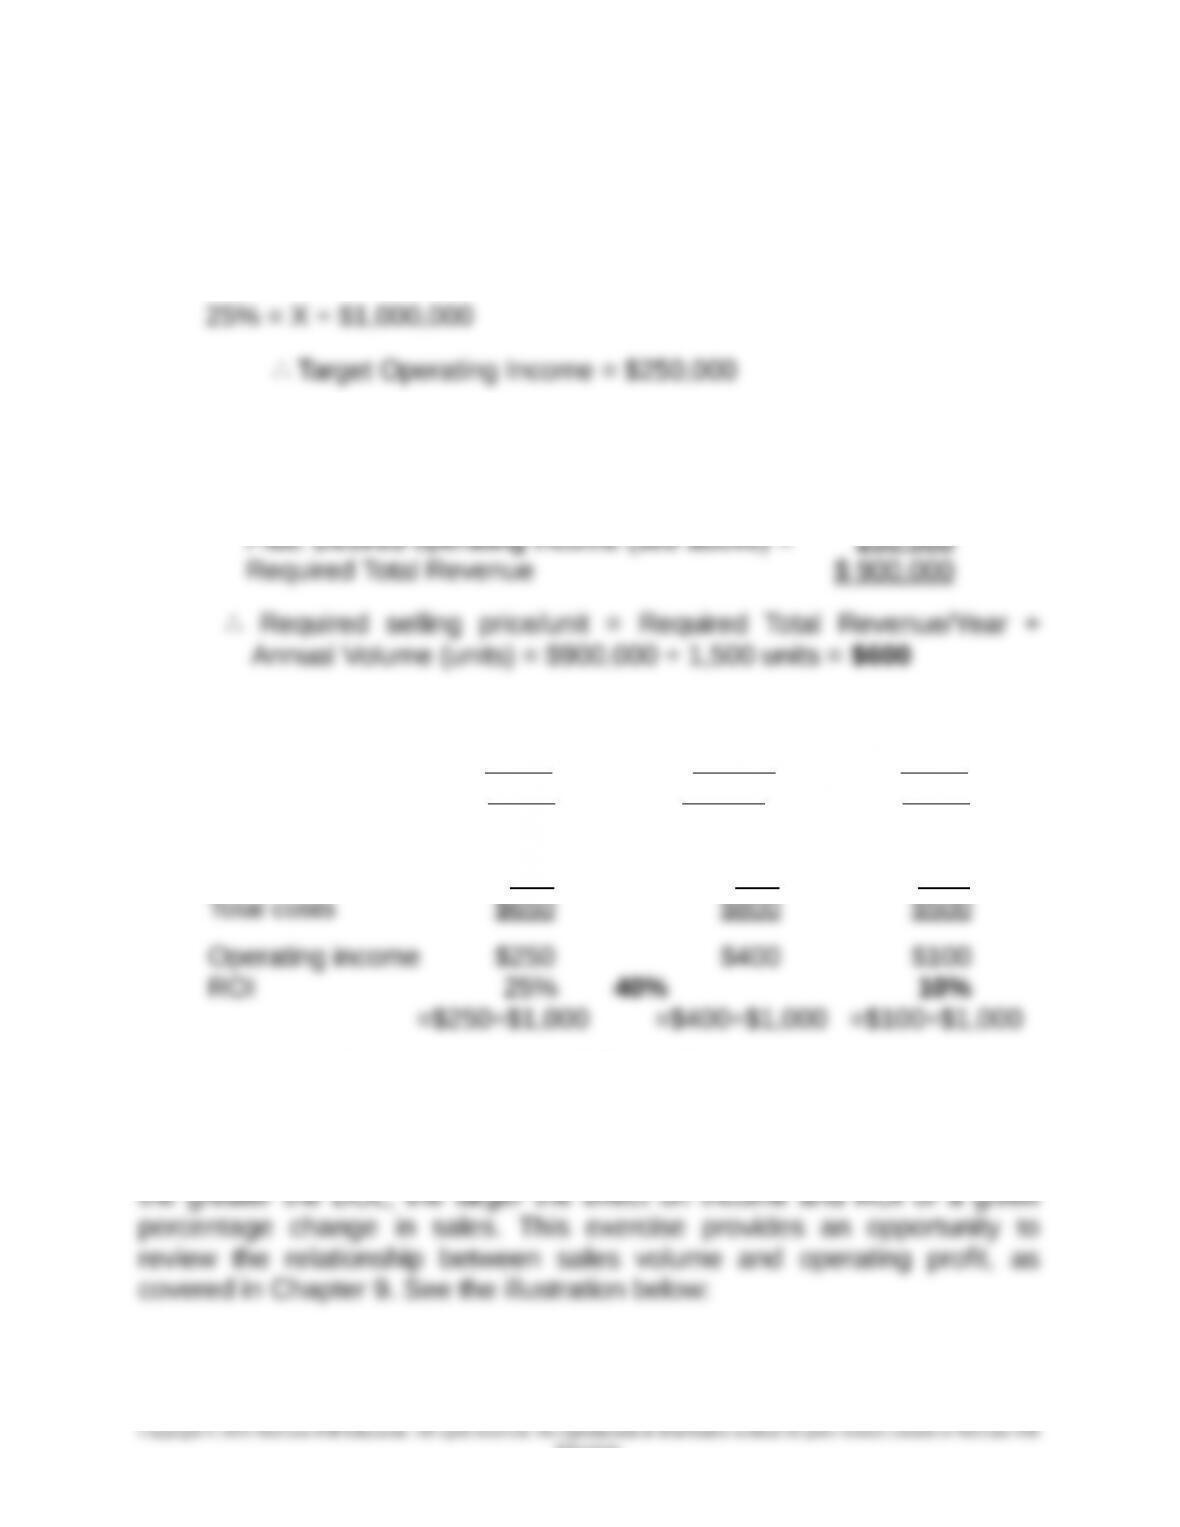
Let X = target Operating Income:
Target (required) total revenue = $900,000, calculated as follows:
Fixed costs, per year $200,000
Plus: Variable costs = 1,500 units × $300/unit = 450,000
2. Data are in thousands:
Units 1,500 2,000 1,000
Revenues ($600/unit) $ 900 $1,200 $ 600
Variable costs $450 $600 $300
Fixed costs 200 200 200
Note how the change in income follows the change in revenues, as
predicted by operating leverage, which is defined and explained in Chapter
9. Degree of operating leverage (DOL) multiplied times the percentage
change in sales gives the percentage change in operating income. Thus,
19-11
Education.
Chapter 19 – Strategic Performance Measurement—Investment Centers
19-24 (continued)
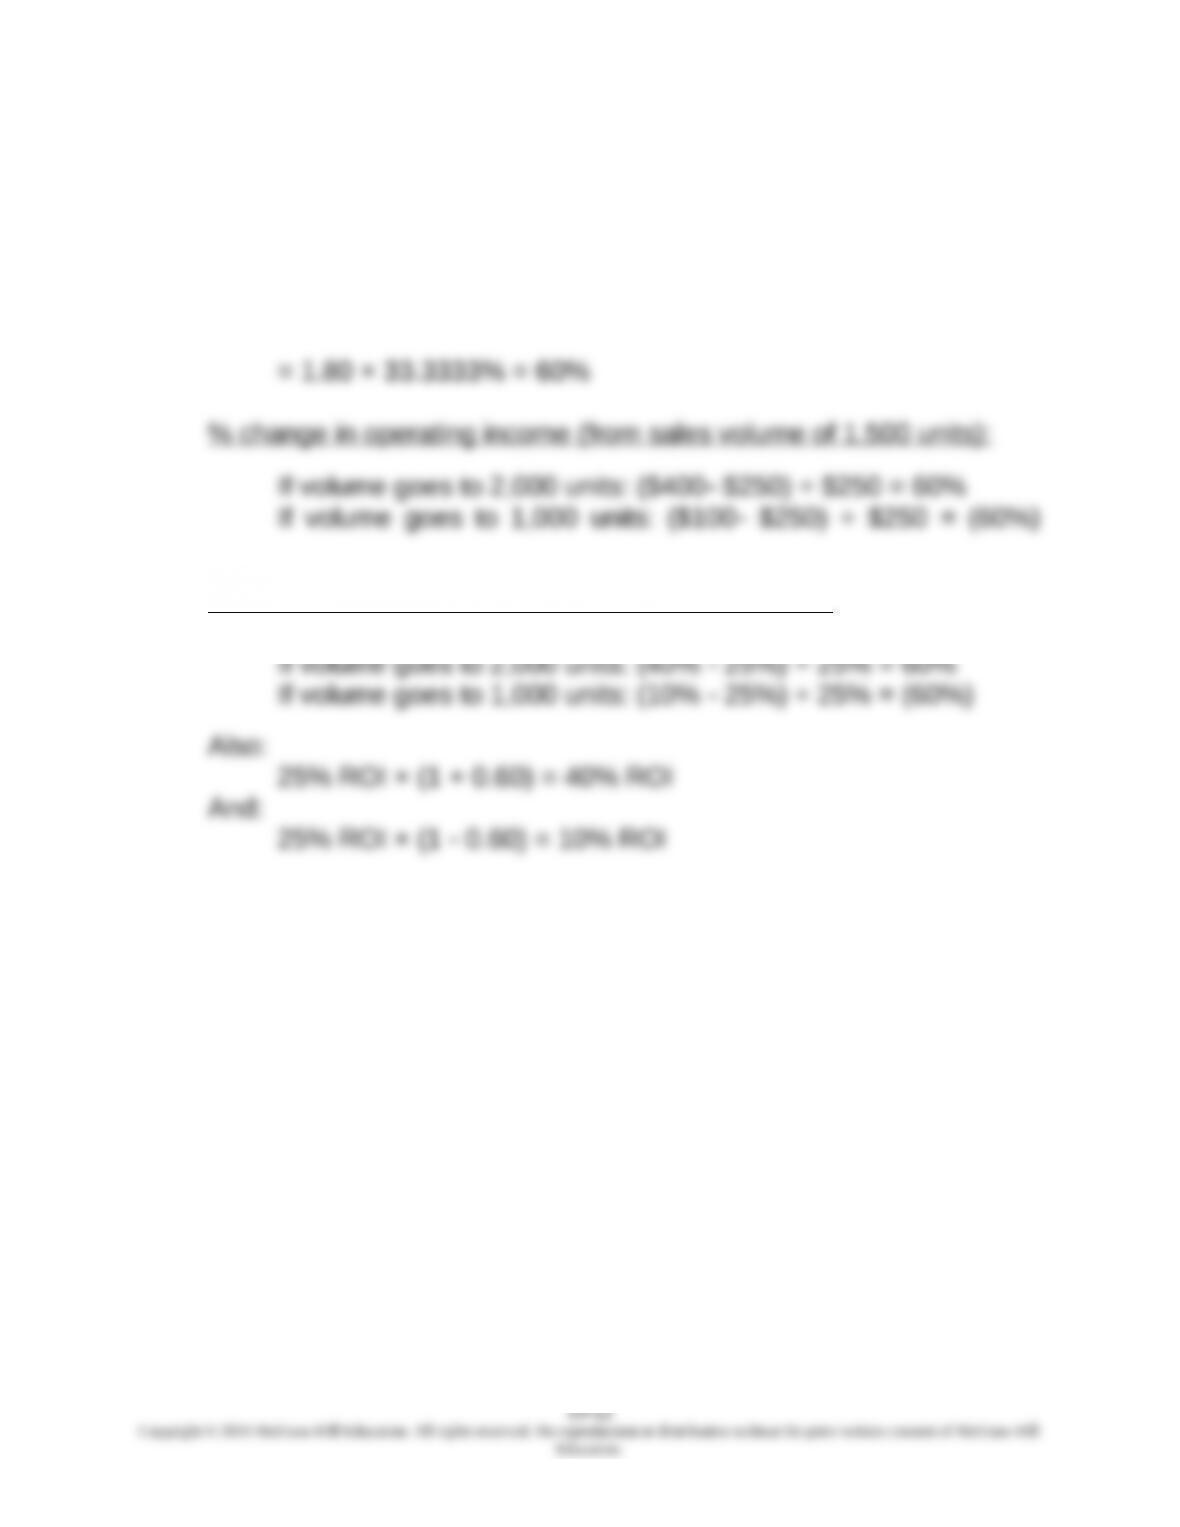
DOL = contribution margin ÷ operating income
= ($900 $450) ÷ $250 = 1.80
% change in operating income = DOL × % change in revenues
% change in ROI (from sales volume of 1,500 units):
Chapter 19 – Strategic Performance Measurement—Investment Centers
19-25 Return on Investment (ROI); Goal-Congruency Issues (30 Minutes)
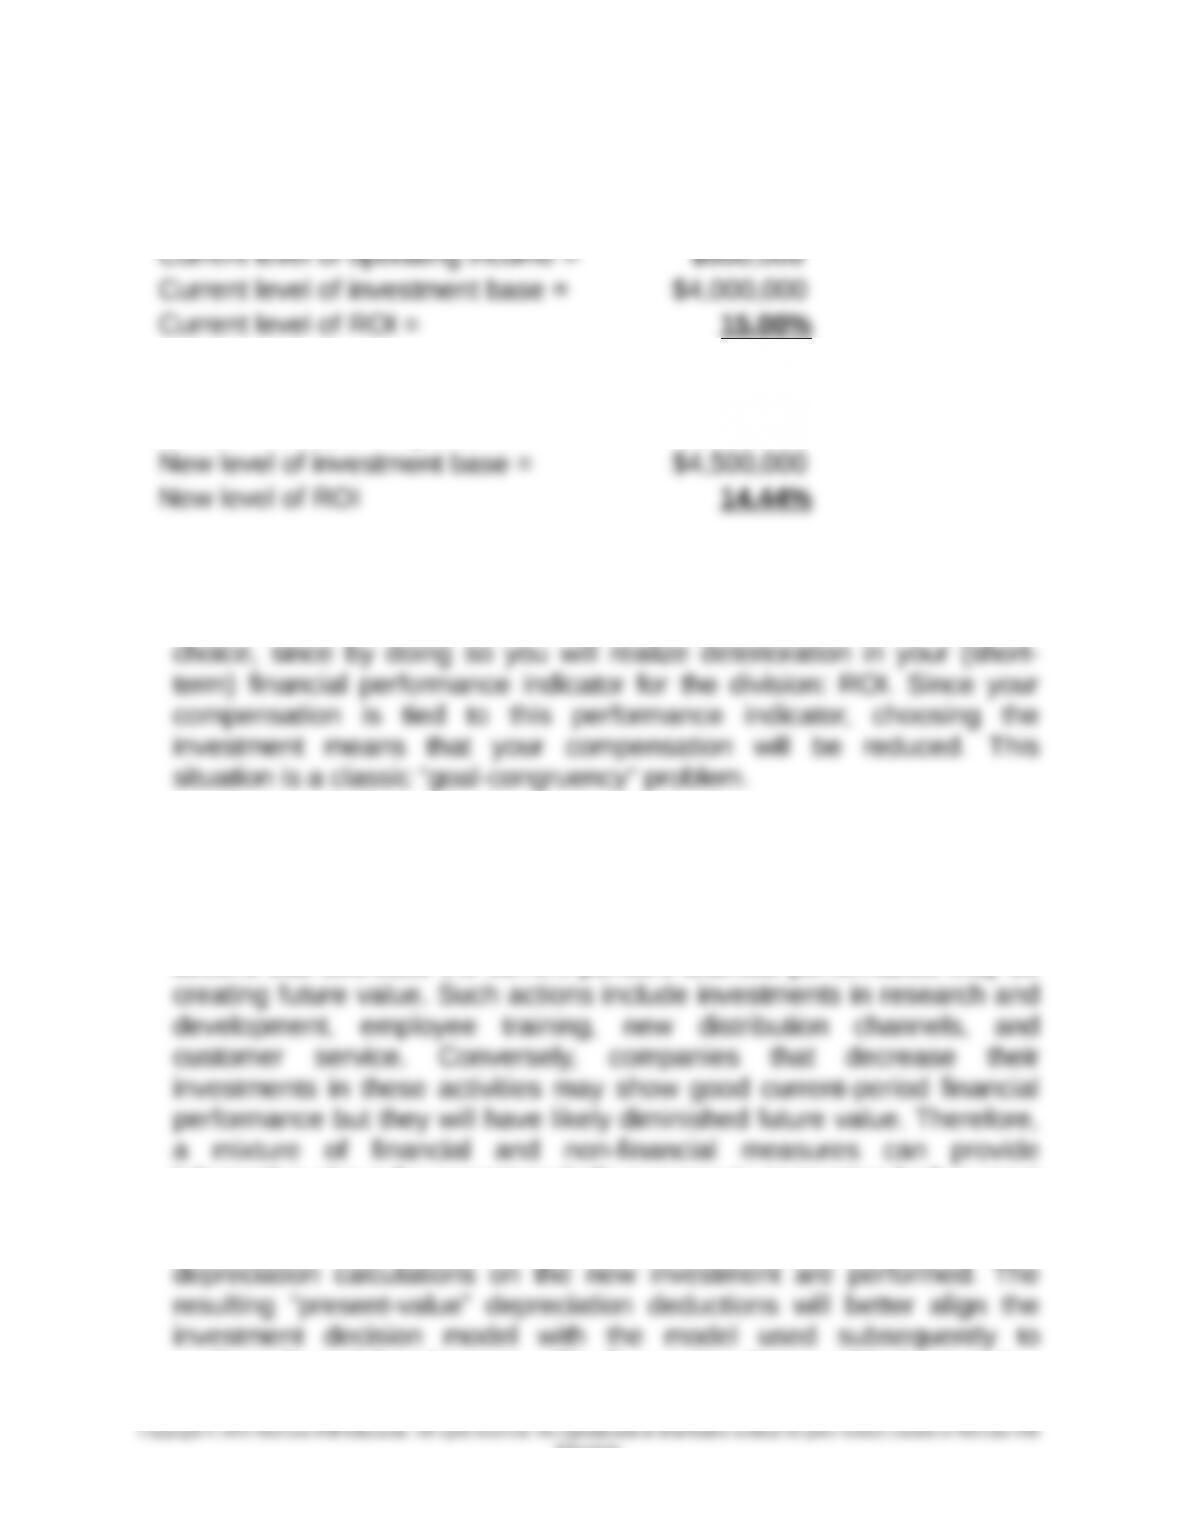
1. Current ROI of the Division:
2. ROI after new investment:
New level of operating income = $650,000
3. Probably not. While the proposed project may, in an economic sense,
benefit the company as a whole (i.e., it adds to shareholder wealth),
there is little incentive for you (as divisional manager) to make this
4. A variety of changes are possible. For example, the manager could
receive a flat bonus upon achieving a target ROI or target residual
income (RI). Another alternative is to base the manager’s compensation
on a combination of financial and nonfinancial measures. Current-period
actions that decrease the current period’s financial performance may be
information about the current period’s success in generating both current
financial performance and growth options for the future. As indicated in
the chapter, another possibility would be to change the way in which
evaluate financial performance. Finally, as also discussed in the text, for
19-13
Education.

Chapter 19 – Strategic Performance Measurement—Investment Centers
19-25 (Continued)
performance-evaluation purposes, we might choose to use multi-year
residual income (RI) numbers, rather than ROI.
Chapter 19 – Strategic Performance Measurement—Investment Centers
19-26 Return on Investment (ROI) and Residual Income (RI) (20 minutes)
1. A quick inspection of the data shows mortgage loans with a higher ROI
to be more successful. But see 2, below.
2. Mortgage Loans Consumer Loans
Average Total Assets $ 2,000 $20,000
Operating Income 400 2,500
Return on Investment (ROI) 20% 12.5%
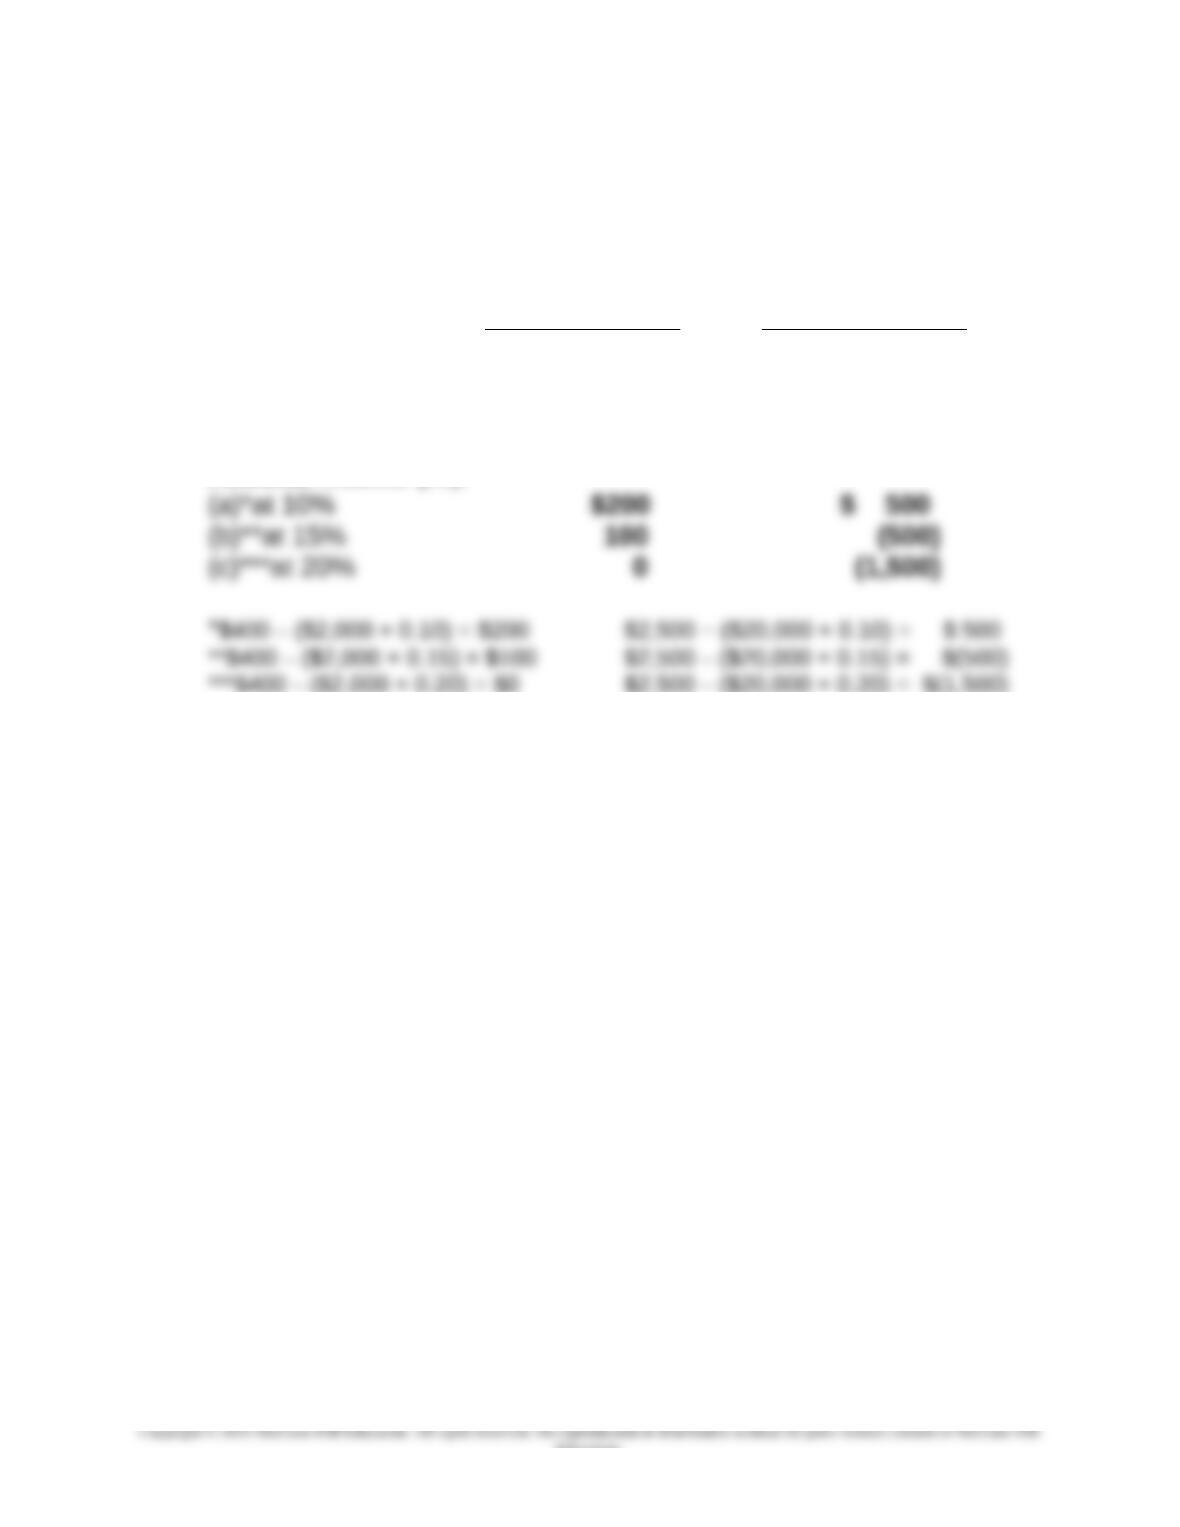
Residual Income (RI):
There is no simple answer to which is more successful in terms of
residual income (RI). Consumer Loans is more successful at low
rates, while Mortgage Loans is more successful at high rates. This
reflects an important limitation of RI: larger divisions (Consumer
Loans in this case) are favored when the desired return used to
determine RI is relatively low.
19-15
Education.
Chapter 19 – Strategic Performance Measurement—Investment Centers
19-27 Return on Investment (ROI); Residual Income (RI); EVA® (25
minutes)
1, 2, and 3:
Intangibles’
Operating Average Value of NBV Plus Effect on
Region Income Total Assets Intangibles Intangibles Net Income
Soap Products $3,250,000
$60,000,0
00 $1,500,000 $61,500,000
$1,000,00
0
Skin Lotions 2,750,000
33,000,0
00 8,000,000
41,000,
000
6,000,00
0
Hair Products 5,000,000
55,000,0
00 1,000,000
56,000,
000
700,00
0
Desired Rate of Return 5.00%
Cost of Capital 4.00%
RETURN ON INVESTMENT
(ROI)
Soap Products 5.42% = $3,250,000 ÷ $60,000,000
Skin Lotions 8.33% = $2,750,000 ÷ $33,000,000
Hair Products 9.09% = $5,000,000 ÷ $55,000,000
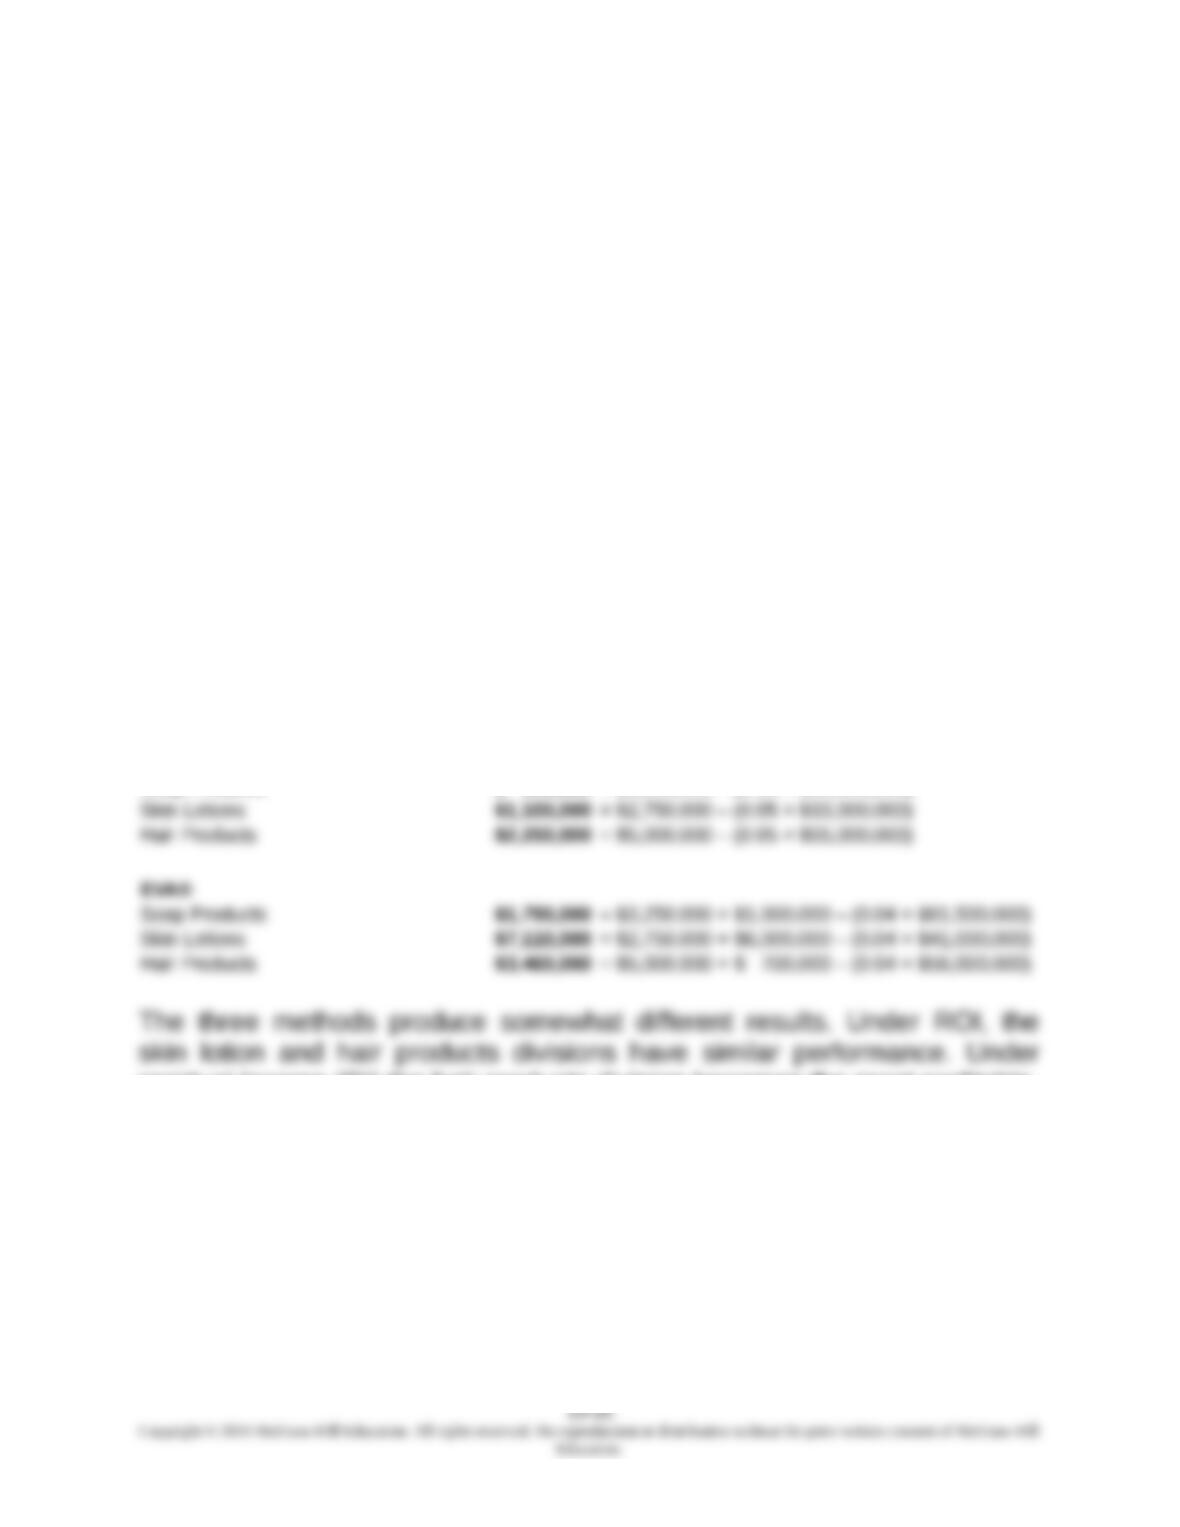
RESIDUAL INCOME (RI)
Soap Products $ 250,000 = $3,250,000 – (0.05 × $60,000,000)
residual income (RI) the hair products division becomes the most profitable,
in part because it is the largest division. Using EVA®, the skin lotion
division is the most profitable. Note that the skin lotions division has the
largest amount of intangible assets, and for this reason has the highest
performance under EVA®.
Chapter 19 – Strategic Performance Measurement—Investment Centers
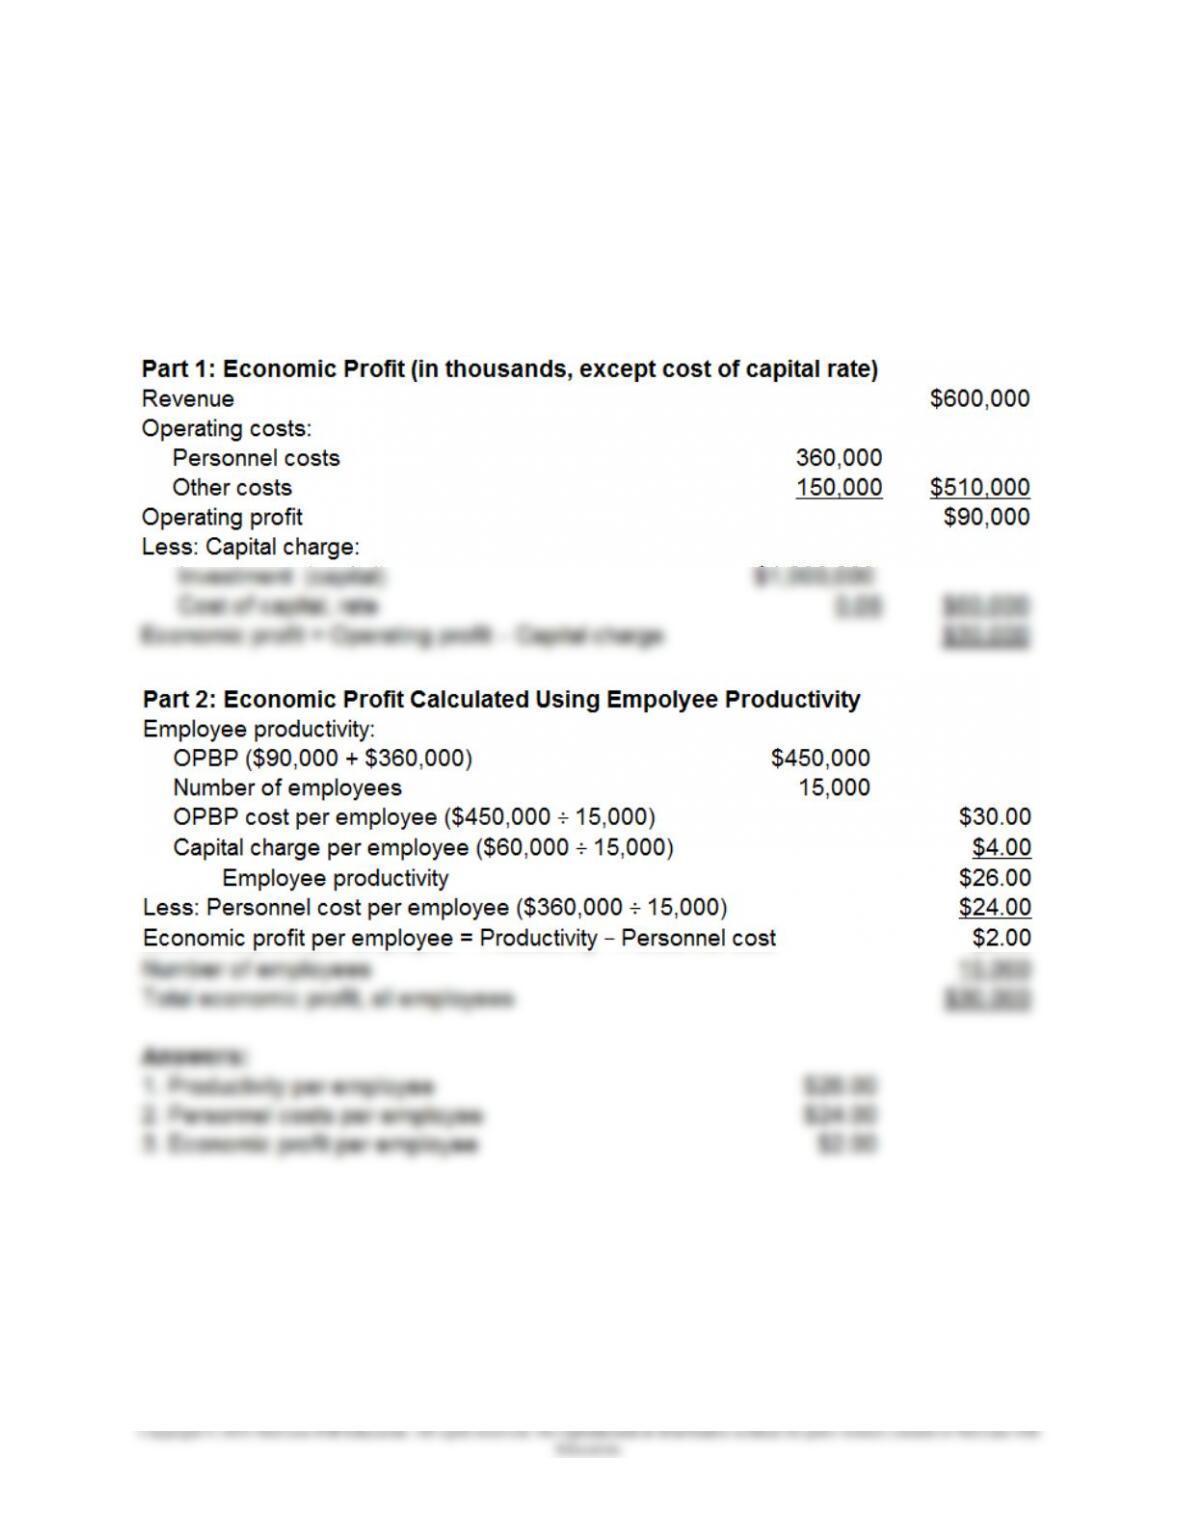
19-28 Economic Profit and Employee Productivity; Service Industries (30
minutes)
Productivity is $26,000 per employee, and the cost per employee is
$24,000. The economic profit per employee is therefore $2,000, or a total
of $30 million (i.e., $2,000/employee × 15,000 employees).
19-17
Chapter 19 – Strategic Performance Measurement—Investment Centers
19-29 Return on Investment (ROI) for Innovative Companies (40
minutes, including reading time)
The objective of this assignment is to engage the class in a discussion of
the limitation of return on investment (ROI) in the specified context. A key
question arises: how have these companies developed their innovative
process and products? If internally developed, then current GAAP requires
that the cost of developing these innovations will not be shown on the
balance sheet and therefore total assets and equity will be understated,
and returns based on the balance sheet numbers could be overstated.
calculated will be smaller and perhaps more representative of the economic
returns in the company.
The discussion could take alternative directions, but a key feature would be
the accounting for intangible assets, such as those developed by these
Source: Jena McGregor, “The World’s Most Innovative Companies,”
Business Week, April 24, 2006, pp. 76.
19-18
Education.

Chapter 19 – Strategic Performance Measurement—Investment Centers
19-30 Transfer Pricing Issues (15 minutes)
In order to provide an incentive for a supplying division to reduce costs,
the transfer pricing agreement should provide an incentive, such as:
1. The cost-based transfer price will not be reduced as a result of the
cost reduction for a given period, say for a period of six months to
2. The transfer price could be lowered only by a percentage of the
19-19
Education.
Chapter 19 – Strategic Performance Measurement—Investment Centers
19-31 General Transfer-Pricing Rule (45 Minutes)
1. Transfer prices represent the amount that one division (subunit) of an
organization charges another division (subunit) of the organization for
services and products transferred internally.
Transfer prices serve the following roles:
a) They provide price data (i.e., inputs) for evaluating the financial
performance of profit centers and investment centers. In the
absence of such price information regarding internal exchanges,
b) They provide “signals” to internal units as to when the firm as a
whole is better off by having a producing division sell internally
2. The general transfer-pricing rule presented in the chapter is consistent
with the definition of “relevant costs,” to which students were exposed in
Chapter 11 of the text. That is, one specification of “relevant costs” is:
Out-of-Pocket Costs + Opportunity Costs. This general transfer-pricing
rule will generally reveal when an internal transfer should take place,
19-20
Education.